ABSTRACT
MARGITA, KALEIGH MARIE. Interactions and Conformational Changes of Double Stranded DNA with Cationic Ligand-Protected Au Nanoclusters by Spin-Labeling EPR and Ionizable EPR Probes (Under the direction of Dr. Alex I. Smirnov).
Integrations of stable and structurally tunable monolayer protected Au clusters
nitroxide 2,2,3,4,5,5-hexamethylimidazolidin-1-oxyl. Next, a series of model
Interactions and Conformational Changes of Double Stranded DNA with Cationic Ligand-Protected Au Nanoclusters by Spin-Labeling EPR and Ionizable EPR Probes
by
Kaleigh Marie Margita
A thesis submitted to the Graduate Faculty of North Carolina State University
in partial fulfillment of the requirements for the degree of
Master of Science
Chemistry
Raleigh, North Carolina 2017
APPROVED BY:
_______________________________ _______________________________
Dr. Alex I. Smirnov Dr. Alex Nevzorov
Committee Chair
ii
DEDICATION
iii
BIOGRAPHY
Kaleigh Margita was raised in Florence, South Carolina, where her love for science and learning was cultivated. She graduated from Newberry College in the spring of 2014 with a B.S. in Chemistry and a minor in Spanish. During her undergraduate career, she completed summer research projects in nanotechnology under the direction of Prof. Samuel Achilefu at Washington
University in St. Louis and in bioelectronics under the direction of Prof. George Malliaras and Prof. Roisin Owens at the Centre Microélectronique de Provence of the Ecole Nationale Supérieure des Mines de Saint-Étienne. In the Fall of 2015, she joined the lab of Prof. Alex I.
iv
ACKNOWLEDGMENTS
I am incredibly grateful for the direction, unwavering support, and encouragement of my advisor Prof. Alex I. Smirnov. I would like to extend a special thanks to Dr. Maxim Voinov, who patiently answered my many questions. I also wish to acknowledge Dr. Sergey
Milikisiyants and Ms. Melanie Chestnut for their help and many long nights of work on obtaining DEER Spectroscopy and SEM data. I would like to thank Prof. Alex Nevzorov and Prof. Gavin Williams for readily serving on my committee. To everyone in the Smirnov, Smirnova and Nevzorov labs, I would like to send my many heartfelt thanks for the
v
TABLE OF CONTENTS
LIST OF TABLES ... vii
LIST OF REACTION SCHEMES ... viii
LIST OF FIGURES ... x
LIST OF ABBREVIATIONS ... xiii
LIST OF COMPOUNDS SYNTHESIZED ... xiv
1. CHAPTER 1 INTRODUCTION ... 1
1.1 Effect of Ionic Strength on 2,2,3,4,5,5-hexamethylimidazolidin-1-oxyl (HMI) Nitroxide: ... 1
1.2 Site Directed Spin Labeling of Oligonucleotides: ... 2
1.3 DEER Spectroscopy for Characterization of Nitroxide Labeled Oligonucleotides: ... 8
CHAPTER 2 RESULTS AND DISCUSSION ... 16
2.1 Potentiometric titration of aqueous solutions of 2,2,3,4,5,5-hexamethylimidazolidin-1-oxyl (HMI) nitroxide: (The content of the following section was published by Springer in the fall of 2016.28)... 16
2.2 Chemical Synthesis: (Procedures adapted from a previous graduate student’s thesis5) 22 2.2.1. Ligands- ... 22
2.2.2 Spin Labeled Ligands- ... 23
2.2.3 Gold Nanoparticles- ... 25
2.3 Site Directed Spin Labeling of Single Stranded Deoxyribonucleic Acid: ... 33
2.3.1 4-Pulse DEER Spectroscopy of Nitroxide Labeled Oligonucleotides- ... 41
2.3.2 4-Pulse DEER spectroscopy of nitroxide labeled oligonucleotides in the presence of Au NP- ... 43
2.4 Conclusions: ... 50
CHAPTER 3: EXPERIMENTAL... 51
3.1 Materials and Instruments: ... 51
3.3 Ligand Synthesis: ... 55
3.3.1 Synthesis of 11-(dimethylamino)undecane-1-thiol hydrochloride (1)- ... 55
3.3.2 Synthesis of 10-(Acetylthio)decanoic acid (2)- ... 58
3.3.3 Synthesis of 4-(2-aminoethylamino)-1-oxyl-2,2,5,5-tetramethyl-2,5-dihydro-1H-imidazole (3)- ... 59
vi 3.3.5 Synthesis of 12-(acetylthio)dodecyl
1-oxyl-2,2,5,5-tetramethyl-2,5-dihydro-1H-pyrrole-3-carboxylate (5)- ... 63
3.4 Gold Nanoparticle Synthesis: ... 64
3.4.1 11-(dimethylamino)undecane-1-thiol hydrochloride- coated water soluble Au NP (7)-... 64
3.4.2 S-10-oxo-10-(2(1-oxyl-2,2,5,5-tetramethyl-2,5-dihydro-1H-imidazol-4-ylamino)ethylamino)decyl ethanethioate modified Au NP (8)- ... 65
3.5 Site Directed Spin Labeling of Oligonucleotides: ... 66
3.5.1 Single-strand DNA labeling in a two-phase system- ... 66
3.5.2 Synthesis of double stranded labeled DNA- ... 66
3.5.3 Purification of labeled double stranded DNA strands by Anion Exchange HPLC-67 3.5.4 Preparation of DEER Spectroscopy Samples- ... 68
vii
LIST OF TABLES
Table 1: Parameters (slopes and ε values) for the calibration plots obtained from potentiometric titration of solutions with various ionic strength of NaCl... 17 Table 2: Experimentally determined pKa values and weighed nitrogen hyperfine coupling constants, Aiso, for HMI solutions of varying ionic strength. Aiso were determined from the least-squares fit of the experimental data to the modified Henderson-Hasselbalch equation ... 20 Table 3: Number Statistics of Dynamic Light Scattering for size measurement of
11-(dimethylamino)undecane-1-thiol hydrochloride-coated water soluble Au NP ... 26 Table 4: Data from TGA analysis of 11-(dimethylamino)undecane-1-thiol hydrochloride-coated water soluble Au NP ... 28 Table 5: Primary and complimentary strand sequences of DNA used in Experiments ... 34 Table 6: Average distance between spin labels in each DNA strand from calculation methods, and measured distances with and without nanoparticles ... 34 Table 7: Number Statistics of Dynamic Light Scattering for size measurement of
viii
LIST OF REACTION SCHEMES
ix
LIST OF EQUATIONS
Equation 1: The energy between the two spin states, ΔE, of the electron dipole, μe, in the presence of a magnetic field, Bo, where g and βe are the electron spin g-factor and Bohr magnetron correspondingly. The addtional hyperfine varriables, due to interaction of the unpaired electron and nearby nuceli, is also included in terms of the nuclear spin state, m1, and
the hyperfine interaction A. ... 3
Equation 2: Energy equation for the precession of vectors dependent on the Bohr Magneton, μB, the electronic spin state ml, and the external magnetic field, B013,14 ... 9
Equation 3: tip angle equation where tp is the length of the pulse2,5 ... 10
Equation 4: Rabi frequency of precision of M0 around B12,5 ... 10
Equation 5: Echo attenuation factor18 ... 13
Equation 6: Decay rate constant of the transverse relaxation of spin A18 ... 13
Equation 7: Rate of instantaneous diffusion18 ... 13
Equation 8: Inverse echo amplitude as a function of time18 ... 13
Equation 9: Distance distribution determination where Ci is the product of the g-values, θ is the angle between the spin-spin vector, r is the distance between the two spin, γ is the fraction of spins and B(t) is the background function20,21 ... 15
Equation 10: Distance between spins calculation from perpendicular ν of the pake pattern21 15 Equation 11: Modified Nernst equation where ε is the total potential which remains constant for a given electrode and solution composition, s is the slope of the plot, and E is the experimentally measured potential (mV)... 17
Equation 12: pKa of the protonatable functionality as defined by Henderson-Hasselbalch equation ... 18
x
LIST OF FIGURES
xi Figure 23: TEM Image of 11-dimethylamino)undecane-1-thiol hydrochloride-coated water soluble Au NP with 5nm scale bar (right) and 2nm scale bar (left) with atomistic detail. ... 27 Figure 24: Graph of TGA analysis of 11-(dimethylamino)undecane-1-thiol hydrochloride-coated water soluble Au NP ... 28 Figure 25: Titration of 11-(dimethylamino)undecane-1-thiol hydrochloride coated Au NP with 0.2M HCL/NaOH in 0.025M NaCl (dark circles) and 0.1M NaCl (open circles) ... 31 Figure 26: X-Band EPR Spectrum of Au NP coated with S-10-oxo-10-(2-(1-oxyl-2,2,5,5-tetramethyl-2,5-dihydro-1H-imidazol-4-ylamino)ethylamino)decyl ethanethioate ... 32 Figure 27: HPLC Chromatogram of purification of labeled NUCS_2_20 using Reverse Phase Chromatography ... 35 Figure 28: HPLC Chromatogram of purification of standard oligonucleotide DT18 using Anion Exchange Chromatography with gradient method 1 ... 36 Figure 29: HPLC Chromatogram of purification of standard oligonucleotide DT18 using Anion Exchange Chromatography with gradient method 2 ... 36 Figure 30: HPLC Chromatogram of free
1-Oxyl-2,2,5,5-tetramethyl-3(methanesulfonyloxymethyl) pyrroline using Anion Exchange Chromatography with gradient method 2... 37 Figure 31: HPLC Chromatogram of purification of unlabeled single stranded NUCS_2_20 using Anion Exchange Chromatography with gradient method 3 ... 37 Figure 32: Anion exchange HPLC chromatogram of labeled single stranded NUCS_2_20 .. 39 Figure 33: Anion exchange HPLC chromatogram of labeled single stranded NUCS_2_20 with a 2% concentration gradient ... 39 Figure 34: Circular dichroism spectrum of single stranded labeled NUCS_2_20 ... 39 Figure 35: Anion exchange HPLC chromatogram of nitroxide labeled double stranded
NUCS_2_20 ... 40 Figure 36: Circular dichroism spectrum of labeled double stranded NUCS_2_20 ... 41 Figure 37: NUCS_T_2_20 DEER echo modulation trace (left) and the distance distribution obtained from the raw data fitting (solid red line) using Tikhonov regularization method (right). ... 42 Figure 38: NUCS_T_2_20 DEER echo modulation trace (left) and the distance distribution obtained from the raw data fitting (solid red line) using Gaussian distribution method (right).42 Figure 39: NUCS_2_20 DEER echo modulation trace (left) and the distance distribution obtained from the raw data fitting (solid red line) using Tikhonov regularization method (right). ... 43 Figure 40: DEER echo modulation trace (left) and the distance distribution obtained from the raw data fitting (solid red line) using Gaussian distribution method (right). ... 43 Figure 41: Effect of glycerol and Au NPs on the X-Band EPR spectrum of NUCS_2_20 .... 44 Figure 42: Effect of glycerol and Au NPs on the X-Band EPR spectrum of NUCS_T_2_20 45 Figure 43: Effect of glycerol and Au NPs on the X-Band EPR spectrum of NUCS_2_30 .... 45 Figure 44: DLS analysis graphs generated by number% statistics in Table 5 of freshly prepared 11-(dimethylamino)undecane-1-thiol hydrochloride-coated water soluble Au NP in the presence of 20% glycerol ... 46 Figure 45: CD spectrum of labeled single stranded NUCS_2_20 (green), labeled double stranded NUCS_2_20 (red), labeled double stranded NUC_2_20 in the presence of
xii Figure 46: NUCS_T_2_20 Distance distribution obtained from the raw data fitting of the DEER echo modulation using Tikhonov regularization method (right) and the DEER echo modulation
trace (left) compared to the sample without nanoparticles (red). ... 48
Figure 47: NUCS_2_20 Distance distribution obtained from the raw data fitting of the DEER echo modulation using Tikhonov regularization method (right) and the DEER echo modulation trace (left) in comparison to the sample without nanoparticles (red). ... 49
Figure 48: NUCS_2_20 Distance distribution obtained from the raw data fitting of the DEER echo modulation using Tikhonov regularization method (left) and DEER echo modulation trace (right) and the distance distribution obtained from the raw data fitting (solid red line) ... 49
Figure 49: NUCS_T_2_20 Distance distribution obtained from the raw data fitting of the DEER echo modulation Tikhonov regularization method (right) and the DEER echo modulation trace (left) in the presence of 0.1M NaCl (black) compared to that without salt (red). ... 50
Figure 50: Titration of 2.0M NaCl for Acid and Base Region Calibration Curves ... 55
Figure 51: Synthesis Scheme of thioacetic acid-S-(11-bromoundcyl) ester ... 56
Figure 52: IR Spectrum of thioacetic acid-S-(11-bromoundcyl) ester ... 56
Figure 53: 1H NMR of thioacetic acid-S-(11-bromoundcyl) ester ... 56
Figure 54: Syntheis Scheme of 11-(dimethylamino)undecane-1-thiol ... 57
Figure 55: Synthesis scheme of 11-(dimethylamino)undecane-1-thiol hydrochloride... 58
Figure 56: 1H NMR of 11-(dimethylamino)undecane-1-thiol hydrochloride ... 58
Figure 57: Synthesis Scheme of 10-(Acetylthio)decanoic acid ... 59
Figure 58: 1H NMR of 10-(Acetylthio)decanoic acid... 59
Figure 59: Synthesis Scheme of 4-(2-Aminoethylamino)-1-oxyl-2,2,5,5-tetramethyl-2,5-dihydro-1H-imidazole... 61
Figure 60: IR Spectrum of 4-[(2-Azidoethyl)amino]-1-oxyl-2,2,5,5-tetramethyl-2,5-dihydro-1H-imidazole ... 62
Figure 61: IR Spectrum of 4-(2-Aminoethylamino)-1-oxyl-2,2,5,5-tetramethyl-2,5-dihydro-1H-imidazole ... 62
Figure 62: Synthesis Scheme of 12-(Acetylthio)dodecanol ... 63
Figure 63: Synthesis Scheme of 12-(acetylthio)dodecyl 1-oxyl-2,2,5,5-tetramethyl-2,5-dihydro-1H-pyrrole-3-carboxylate ... 63
Figure 64: IR Spectrum 12-(acetylthio)dodecyl 1-oxyl-2,2,5,5-tetramethyl-2,5-dihydro-1H-pyrrole-3-carboxylate ... 64
Figure 65: Synthesis Scheme of 11-(dimethylamino)undecane-1-thiol hydrochloride-coated water soluble Au NP ... 65
Figure 66: Attachment of S-10-oxo-10-(2(1-oxyl-2,2,5,5-tetramethyl-2,5-dihydro-1H-imidazol-4-ylamino)ethylamino)decyl ethanethioate EPR Sensitive Ligand to Gold Nanoparticles .... 66
Figure 67: Anion Exchange HPLC Trace of Labeled Double Stranded NUCS_2_20 Using Gradient Method 6 ... 68
xiii
LIST OF ABBREVIATIONS
AIBN Azobisisobutyronitrile
DCC N,N’-Dicyclohexylcarbodiimide
DMAP 4-Dimethylaminopyridine
DLS Dynamic Light Scattering
DMSO Dimethyl sulfoxide
DMF Dimethylformamide
HCL Hydrochloric Acid
EPR Electron Paramagnetic Resonance IR Infrared spectroscopy
NMR Nuclear Magnetic Resonance
THF Tetrahydrofuran
TLC Thin Layer Chromatography
xiv
LIST OF COMPOUNDS SYNTHESIZED
1 11-(dimethylamino)undecane-1-thiol hydrochloride
2 10-(Acetylthio)decanoic acid
3 4-(2-aminoethylamino)-1-oxyl-2,2,5,5-tetramethyl-2,5-dihydro-1H-imidazole
4 12-(Acetylthio)dodecanol
1
CHAPTER 1 INTRODUCTION
1.1 Effect of Ionic Strength on 2,2,3,4,5,5-hexamethylimidazolidin-1-oxyl (HMI) Nitroxide: Over the years molecular probes based on stable free radicals (a.k.a. spin probes) and the associated Electron Paramagnetic Resonance (EPR) methods have been finding numerous bioanalytical applications from measuring oxygen concentrations in cells and tissues in vivo to obtaining unique data, on polarity of phase-separated liquids and microviscosity of cellular membranes.6 Most recently, proton transfer-related and surface electrostatic phenomena have been studied using pH-dependent EPR molecular probes.7 These molecular probes have a unique chemical functionality that is capable of a reversible ionization, such as protonation, in addition to possessing an EPR-active reporter nitroxide group (N-O•). In such molecular probes, the ionization event causes a formation of protonated and nonprotonated nitroxide species with different magnetic parameters (Aiso, giso) that are readily identified by EPR.
Solution ionic strength has a known effect on the chemical equilibrium of the charge species, and therefore is expected to affect the equilibrium constant (pKa) of the reversible protonation of the nitroxide.7 However, until our work published earlier this year only some scarce data on effects of the solution ionic strength on the experimental pKa of ionizable nitroxide species can be found in literature. Specifically, we have carried out a series of EPR titration experiments using
2 Figure 1:Reversible protonation of nitroxide HMI
1.2 Site Directed Spin Labeling of Oligonucleotides:
At the center of most living organisms, the self-replicating material Deoxyribonucleic Acid (DNA) carries all the genetic information. DNA is comprised of four nucleotides, Adenine, Thymine, Guanine, and Cytosine, and its biological function arises from the structure and
dynamics of the molecule. Much research has been devoted to understanding the biological interactions of DNA on the most basic level.9,10 Initially X-ray Crystallography was used to obtain the structure of DNA assemblies and to provide atom to atom measurements; however, as later it has been realized that the rigid crystal may not represent the definite structure as found under biological conditions in cells as well as model solutions.11 Nuclear Magnetic Resonance (NMR) has been used for biomolecules in solution to obtain information on the molecular dynamics and interactions of the nucleobases with an upper limit of approximately 50-100kDa molecules or 40-80 nucleotide strand of DNA ( although molecular weight limits for solution NMR have been constantly pushed further towards heavier molecules).10,12 Additional biophysical methods have also been employed in DNA studies. For example, EPR and fluorescence spectroscopy are the two methods that can provide precise measurements of nanometer distances, structure, and orientation of larger biomolecules at biological conditions. Both methods involve an attachment of a molecular tag (a paramagnetic spin label for EPR or a fluorophore moiety for optical detection) to DNA. For biophysical studies spin-labeling EPR is viewed to be more suitable for DNA studies because of the relatively small perturbations to the native structure when a spin label is added in comparison to the attachment of a fluorophore.13
3 Site-Directed Spin Labeling (SDSL) is and EPR technique that is based on covalent attachment of an EPR-active paramagnetic tag to a specific residue within the biological
molecule. A spin label is a molecule with one lone electron, most commonly contained within a nitroxyl group with a spin quantum number of S=1/2. The basic theory of SDSL involves the interaction between the electron dipole and the applied magnetic field, which is mathematically denoted the Equation 1 where μe is the dipole moment of the electron and the Bo is the external magnetic field applied. The electron dipole also interacts with the nearby nuclei magnetic fields, m1, or hyperfine interactions, A, which contribute to the overall energy difference as well. The electron dipole in the presence of a magnetic field has two spin states so the difference in energy of the spin states can be found using Equation 1.
ΔE=hv=μeBo+m1A=gβeBo+m1A
Equation 1: The energy between the two spin states, ΔE, of the electron dipole, μe, in the presence of a magnetic field, Bo, where g and βe are the electron spin g-factor and Bohr magnetron correspondingly. The additional hyperfine variables, due to interaction of the unpaired electron and nearby nuclei, is also included in terms of the nuclear spin state, m1, and the hyperfine interaction A.
4 occurring as the dipole rotates. Spectral peak shape changes can then be directly correlated to the many rotational moments of the nitroxide molecule as shown in Figure 3. Spectra linewidth broadening occurs when the nitroxide rotational motion is hindered and narrows with an increase in rotational motion. This is particularly useful because the nitroxide can be coupled to large biological molecules and provide information about the environment surrounding the labeling location.
Figure 2: Energy level transitions corresponding to the first derivative EPR spectrum (modified to include EPR
spectrum from HMI Nitroxide13)
Figure 3: Rotational Dynamics present in R5 Nitroxide and Theoretical Effect on EPR Spectra (modified illustration
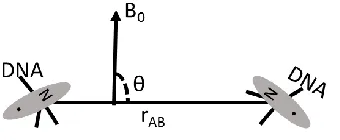
5 Electron-electron dipolar interactions, where the energy between the two electron dipoles, Edip, is added to each electron energy level, can also be examined. Mathematically, with the case of two electron dipoles, the total energy is dependent on the distance between the two spins and the angle of the distance vector and the magnetic field, as illustrated in Figure 4.13
Figure 4: Electron-electron dipolar spin interaction where B0 is the magnetic field and θ is the angle of the distance vector, rAB (modified13)
The EPR spectra can be obtained of these pairwise interactions using the method double electron-electron resonance (DEER). The DEER method further explained in the subsequent chapter, uses a series of pulse sequences and measures the EPR signal in the time domain during the relaxation or echo period and is further discussed in the next section. The incorporation of two or more nitroxide molecules into a biological molecule and analysis with DEER can provide a wealth of information about not only the local environment but also provide accurate distances between portions of the molecule and the angle at which the nitroxides are oriented. In DNA, RNA, and Protein studies this data is crucial in understanding molecular conformations and association dynamics, which govern key biological functions.
6 EPR data to be obtained about each site within the molecule. With each attachment location, it is important to note that each method for labeling is different with varying degrees of DNA
perturbation.
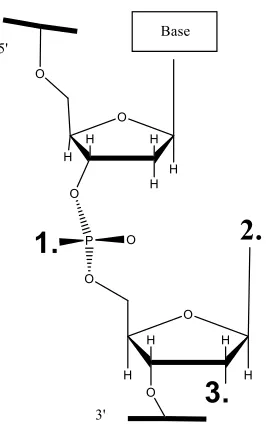
Figure 5: Locations for nitroxide labeling within DNA. 1. Internal Phosphate, 2. Sugar, 3. Nitrogenous Base (modified14)
The most prevalent and highly efficient method involves assembling single nucleotides in the 3’ to 5’ direction and incorporating a functional group, for example, a thiol or amine which can be modified after a complete length of single stranded DNA is constructed. This allows the spin label to be added anywhere within the molecule. The replacement of a phosphate group with a phosphorothioate allows for the use of one method of SDSL proven particularly successful by the Qin group and shown in Figure 6 below. Phosphorothioate modified DNA assembled as described was commercially purchased for our studies. The phosphorothioate is further modified with a iodomethyl nitroxide (R5) moiety that attaches the nitroxide to the desired location with high efficiency. The attachment of the R5 nitroxide to the
7 phosphorothioate addition is also much less than developing modified oligonucleotides.
However, while this method seems very flexible and advantageous some key aspects of the nitroxide must be discussed. The three single bonds which attach the nitroxide to the
phosphorothioate group are rotatable, which gives rise to the limited perturbation of the DNA strand, but also introduces a degree of inconsistency in the labeling process. The solid-phase synthesis method introduces both diastereomers of phosphorothioate, resulting in the local environment of each nitroxide being slightly different as shown in Figure 7. The two forms have been successfully separated using HPLC methods, but the mixed diastereomers can still be used in EPR studies.15 With the attachment of the R5 nitroxide, one negative charge of the phosphate group is lost, which is a concern for obtaining electrostatic measurements and labeling at certain cites within DNA molecule. Overall, the phosphorothioate labeling scheme, is best suited for our experiments to obtain accurate distance measurements and local environment information for mapping of the DNA molecule using the R5 label.13,14
Figure 6: A) Synthesis of iodomethyl derivative nitroxide R5 B) Phosphorothioate Labeling of DNA Scheme with R5(redrawn16)
8 Figure 7: Conformational diastereomers of R5 labeled phosphorothioate (redrawn15)
1.3 DEER Spectroscopy for Characterization of Nitroxide Labeled Oligonucleotides:
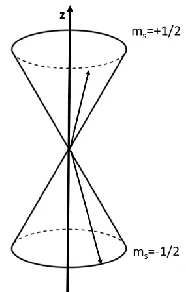
EPR fundamentally begins with the interaction of an electron in an external magnetic field. A simple energy-level diagram is shown below in Figure 2 for a particle, such as the R5 nitroxide, with a spin of ½. The external magnetic field, B, is varied, changing the energy level separation until the frequency of the microwave radiation is resonant with the energy transition sending electrons from the lower to upper state. This relation can be explained by Equation 1, where the change in energy is directly described by the resonant frequency, ν, and planks constant, h. Considering the spin angular momentum, in the presence of the magnetic field, the interaction of the ms=±1/2 spin states can also be illustrated as a vector precession as shown in Figure 8. The frequency of the procession, known as the Larmor frequency, can be determined by the product of the gyromagnetic ratio of an electron and the magnetic field. Subsequently, the energy between the two states can also be given by Equation 2. This equation introduces
9 fingerprint like EPR spectrum arises from the splitting of the electrons individual resonance lines due to the interactions of the electrons with nuclei within the system. The hyperfine coupling constant, a, quantifies the degree of splitting from the center resonance line, B.17–19
ΔE=geμBB0
Equation 2: Energy equation for the precession of vectors dependent on the Bohr Magneton, μB, the electronic spin state ml, and the external magnetic field, B018,19
Figure 8: Representation of angular momentum of an electron in an external magnetic field along the z-axis through vector precession with parallel and anti-parallel distribution18
From examining electrons as vectors in precession, it is reasonable that a pulsed EPR method, reminiscent of a spin-echo double resonance NMR experiment which measures interactions throughout a time domain could have many advantages. Numerous EPR methods with varying pulse sequences have been developed. Each generally increasing the sensitivity and range of distances between paramagnetic centers that can be measured but each having niche applications.20 For our experiments a 4 pulse double electron electron resonance method was chosen.
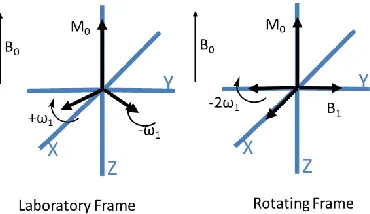
Moving from the laboratory reference frame illustrated in Figure 8, where the
10 microwave pulses simpler. The linearly polarized microwaves can be represented as two
circularly polarized components which are perpendicular to B0, below in Figure 9. At resonance, one of the components of B1 appears stationary and the second component or fast component which rotates with an angular velocity of 2ω1 can be neglected because of effective fields. It can also be assumed that the magnetization, B0, can also be neglected because it is not processing in the frame. This leaves a simple rotating frame and the components of B1 and the net
magnetization of many electron spins, M0, to consider. M0 can then be rotated to process around B1 with a frequency termed the Rabi frequency, shown in equation 3 below. Pulses are labeled by the tip angle,α, or the angle which M0 must be rotated to process about B1.17
Figure 9: Depiction of magnetization in reference frames (redrawn17)
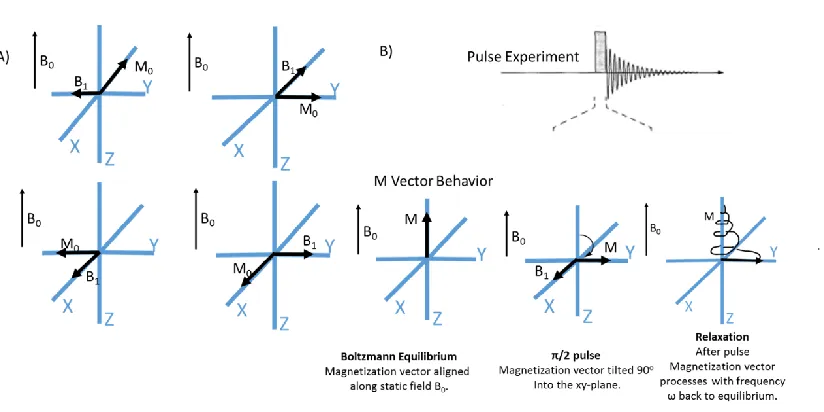
Typical EPR pulse sequences include characteristic pulses of π/2 which rotates M0 90° and π which rotates M0 180°. The rotating frames of the four possible pulse phases are illustrated below where B1 can be found on any of the ±x and ±y axes. In Figure 10, a π/2 pulse sequence is shown, where before the microwave pulse M0 is aligned with B0 until the microwave pulse and then M0 is rotated to processes around B1 until the pulse is completed and then spin-lattice relaxation occurs. Spin Lattice relaxation is the decay process of the magnetization back to alignment with the z-axis after the microwave pulse is removed. The phenomenon can be quantified by T1, describing how quickly the magnetization returns to the z-axis or by the
ω1= -γB1
Equation 4: Rabi frequency of precision of M0 around B12,5
α= -γ|B1|tp
11 transverse relaxation time, T2, which is how quickly the magnetization disappears in the x-y plane.17,21 The Free Induction Decay (FID) spectrum can then be obtained and Fourier
transformed into the EPR spectrum. To increase the signal, the FID is measured multiple times through a series of pulses and added together. However, there are several limitations in
increasing the signal due to having to wait until the magnetization returns to the z-axis before the next pulse can be made and the inhomogeneous relaxation of electrons which cause decay. The decay of the FID signal is caused by the different frequencies at which the electrons relax, some are fast, others move slower based on their surroundings, and some even move out of the x-y frame.17,22
Figure 10: A) four phases of B1 in the rotational coordinate frame B) simple π/2 pulse diagram with subsequent behavior of magnetization vector (modified17)
12 of precession have time to “catch up” refocusing the magnetization, as shown below in Figure 11.17 The proceeding echo measures the FID of the refocusing and then the subsequent
dephasing of the electrons.
Figure 11: π pulse refocusing of magnetization before echo (modified17)
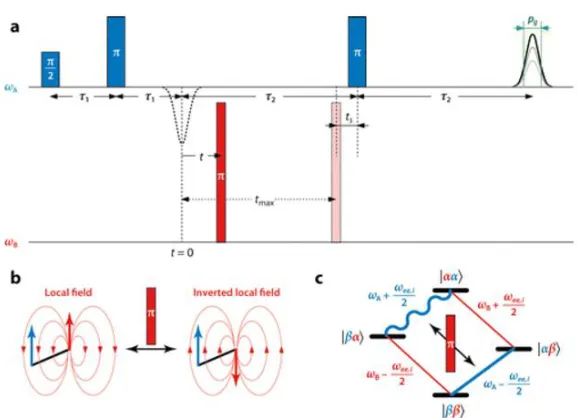
From the three basic pulse EPR components, π/2 pulse, π pulse, and the echo, a pulse sequence can be constructed for obtaining DEER spectra and accurate distance measurements from 1.5nm-8nm. 4-pulse DEER has two pulse frequencies, observer frequency, ωA, and pump frequency, ωB, which correspond to the two electrons. The observer pulse refocuses the inhomogeneous line broadening of spin A, while the electrons, B, that are coupled to spin A are excited and subsequently inverted by the pump pulse frequency. As seen in Equation 6A, 4-pulse DEER begins with a π/2 pulse which begins the precession of the magnetization around B1. Secondly a π pulse is used to refocus the spin A, which then transversely relaxes along with electrons that are coupled to A and excited by the same pulse and leads to the echo. Inhomogenities come from the hyperfine couplings, coupling of A spins to B spins which are not excited and g-value dispersions. The transverse relaxation of spin A and coupled spins leads to an echo attenuation described by the factor, shown in Equation 5. The decay rate constant, shown below in
13 coupling of spin A with spin B, the inversion of spin B causes changes in the frequency of spin A, and can be related to changes in the echo amplitude through equation 8. The energy level diagram in Figure 12C, shows how the transition between the energy levels of spin A differ by the frequency of ωee,i.23 During the time that B is flipped, A is allowed to evolve and then is also flipped by a π observer pulse but it no longer aligns with the axis that initially flipped to after the first observer pulse. The difference in phase alignment corresponds to ωee,i. It is then that the final echo FID oscillations are detected in the time domain and translated into the desired spectrum and shown in Figure 13.
𝑒𝑥𝑝[−2𝑘(𝑇1+ 𝑇2)]
Equation 5: Echo attenuation factor23
𝑘 = 1
𝑇2,𝐴+ 𝑘𝐼𝐷
Equation 6: Decay rate constant of the transverse relaxation of spin A23
𝐾𝐼𝐷 = 𝐶𝐴𝐾𝐴
Equation 7: Rate of instantaneous diffusion23
𝜈(𝑡) = ∏{1 − 𝜆𝑖[1 − cos (𝜔𝑒𝑒,𝑖 𝑖
𝑡)]}
Equation 8: Inverse echo amplitude as a function of time23
14 Figure 12: A) 4-pulse DEER sequence B) effect of π pulse on B spins and local field of A spins C) energy level diagram for the exchange of energy between A and B spins (obtained from reference23)
Figure 13: Theoretical DEER spectrum where the two spin packets have a difference in the frequency precession, ωee (obtained from reference24)
The distance distribution between spins A and B can be determined by the following modification to Equation 8 shown in Equation 9. This equation makes the following key assumptions:
1) The external magnetic field is quantized and so are the spins.
2) Neglection of the electron spins exchange coupling can occur, simplifying the coupling to only dipole-dipole coupling.
3) The spin pairs are mostly isolated.
15 𝜈(𝑡) ={1 − 𝜆[1 −∫ 𝑐𝑜𝑠(𝐶𝑖
𝑟𝑖3 (1 − 𝑐𝑜𝑠 2 𝜃
𝑖)𝑡)𝑑𝑐𝑜𝑠𝜃 1
0
]} 𝐵(𝑡)
Equation 9: Distance distribution determination where Ci is the product of the g-values, θ is the angle between the spin-spin vector, r is the distance between the two spin, γ is the fraction of spins and B(t) is the background function25,26
The Fourier transform of v(t) gives the common dipolar pake pattern, in Figure 14, and using Equation 10 the frequency of the perpendicular spins can be used to determine the distance between two spins.10
𝑟(𝑛𝑚) = √ 52.04
𝜈⊥(𝑀𝐻𝑧
3
Equation 10: Distance between spins calculation from perpendicular ν of the pake pattern26
Figure 14: Dipolar Pake pattern with the frequency of perpendicular spins( obtained from reference26)
More often, instead of preforming a Fourier transform of the time domain computational programs are used assuming all orientations of the pake pattern are excited. Computation of distance distributions directly from the time trace or form factor has been thoroughly analyzed and it has been suggested that the Tikhonov regularization with an added nonnegativity constraint is the top transformation method.26 The resulting distribution includes information about, mean distance, width, and shape in increasing order of reliability. Several measurements often need to be observed to obtain accurate information limiting the length that can be
16 spectroscopy method will be used to determine the molecular conformation of DNA in the
presence of cationic nanoparticles.
As in many spectroscopic methods, there are many experimental parameters to take into consideration which have potential to affect the system and decrease sensitivity of the
measurements. Most importantly for DEER are the temperature and concentration parameters, the microwave frequency band, and the labeling efficiency of the sample. At low
temperatures(40-60K), transverse relaxation is dominated by proton spin diffusion allowing for longer values for Tmax, increasing sensitivity of the measurement and measuring longer distances between spins. The parameters of labeling efficiency and concentration work hand in hand. While it is important to have a sample with a high labeling efficiency so that there are many spin pairs to observe transitions between, it is just as important to maintain a homogenous distribution within the sample.23,27 The microwave frequency band is also an important parameter to
consider. Sensitive DEER measurements are typically done at X-band frequencies, but at Q-band frequencies and a high power set up can further enhance the measurements.
CHAPTER 2 RESULTS AND DISCUSSION
2.1 Potentiometric titration of aqueous solutions of 2,2,3,4,5,5-hexamethylimidazolidin-1-oxyl (HMI) nitroxide: (The content of the following section was published by Springer in the fall of 2016.28)
17 fit with the modified Nernst equation shown in Equation 11. The slope and ε values for the calibration plots are shown in Table 1 below for each ionic strength solution.
𝐸 = 𝜀 − 𝑠×𝑝𝐻
Equation 11: Modified Nernst equation where ε is the total potential which remains constant for a given electrode and solution composition, s is the slope of the plot, and E is the experimentally measured potential (mV)
Table 1:Parameters (slopes and ε values) for the calibration plots obtained from potentiometric titration of solutions with various ionic strength of NaCl
[NaCl],
M acidic
Slope
acidic basic
Slope basic
0.10 428.14 65.85 786.37 90.81
0.30 431.41 65.92 749.00 80.05
0.50 414.03 62.84 684.67 71.33
1.00 416.14 63.06 808.41 91.49
2.00 405.57 58.84 391.83 55.94
5.00 494.01 73.30 430.00 57.26
18 Equation 12: pKa of the protonatable functionality as defined by Henderson-Hasselbalch equation
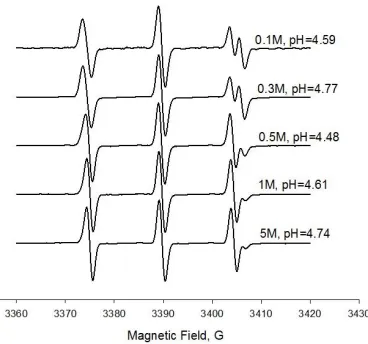
At each titration point, an X-band (9.5GHz) EPR spectrum was also taken, revealing two superimposed components and simulated assuming a two-center model as described in
literature.29,30 A representative two component X-band EPR spectrum acquired at intermediate pH with a least squares decomposition of the experimental spectrum for components
corresponding to the non-protonated and protonated forms of the nitroxide is shown below. The residual of the fit illustrates that experimental spectrum fits into the two component model rather well.
Figure 15: Least squares decomposition of the experimental X-band EPR spectrum acquired from HMI in 2 M NaCl solution for the spectral components corresponding to the protonated and non-protonated forms of the
nitroxide.
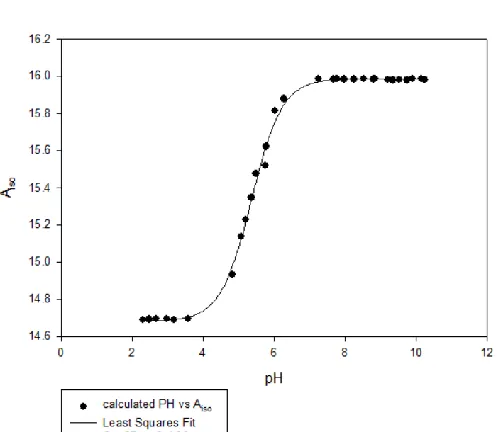
Figure 16 shows the results of EPR titration of HMI in a 2 M NaCl aqueous solution. The pH values in the acidic and basic regions were calculated using the parameters from 2 M NaCl calibration plots and plotted against the weighed Aiso obtained from the fit of the two component EPR spectrum shown in Figure 15. The solid line represents the least squares fit of the
a 10 10
R•
p log H log
R•H
K K p
19 experimental data to the Henderson-Hasselbalch equation, shown in Equation 13, giving a pKa of 5.36 ± 0.03. Table 2 below lists the experimentally determined pKa values and weighed nitrogen hyperfine coupling constants, Aiso, for each HMI solutions of varying ionic strength.
a
a pH p
iso iso
iso pH p
R• 10
R•H
1 10
K
K
A
A
A
Equation 13: Modified Henderson-Hasselbalch equation used for fitting the experimental EPR titration data. Aiso represents the nitrogen hyperfine coupling constant averaged out proportionally to the weights of the individual
spectral components (non-protonated and protonated forms of the nitroxide).
20 Table 2:Experimentally determined pKa values and weighed nitrogen hyperfine coupling constants, Aiso, for HMI solutions of varying ionic strength. Aiso were determined from the least-squares fit of the experimental data to the
modified Henderson-Hasselbalch equation
As the ionic strength of the solution increases the pKa experiences an upward shift
graphed in Figure 17. This trend can be explained by considering the electrostatic interactions of the Cl- with the protonated HMI; an increase in Cl- ions concentration results in a better
21 Figure 17: pKa’s of HMI plotted vs. NaCl concentration. Open circles – pH was calculated from ionic strength calibration plots; filled circles – pH was directly measured with a temperature-corrected 3-point calibrated pH electrode; red circle – a literature data31 (0.01 M buffer, temperature was not specified) shown as a reference
Figure 18: pKa from calculated pH values versus the ionic strength parameter
22 15, where the higher ionic strengths cause an increase in the fraction of the protonated form of HMI.
Figure 19: Representative X-band (9.5 GHz) EPR spectra of HMI acquired at essentially the same pH (pH is shown on the right) but at various NaCl concentrations.
2.2 Chemical Synthesis: (Procedures adapted from a previous graduate student’s thesis5) 2.2.1. Ligands-
11-(dimethylamino)undecane-1-thiol hydrochloride (1)-
To study electrostatic properties of nanoparticles as a function of pH,
11-(dimethylamino)undecane-1-thiol hydrochloride was synthesized to serve as a ligand for
attachment to gold nanoparticles.32,33 Thioacetic acid was combined with 11-bromo-1-undecene and AIBN to form thioacetic acid-S-(11-bromoundecyl) ester and characterized by 1H NMR and IR spectroscopy. Thioacetic acid-S-(dromoundecyl) ester was converted to
11-(dimethylamino)undecane-1-thiol using dimethylamine and then a solution of gaseous HCL in THF was used to make the hydrochloride form illustrated below in Scheme 1.
23 2.2.2 Spin Labeled Ligands-
Two thioacetyl ligands were successfully coupled to nitroxide radicals by DCC mediated reactions to form spin label ligands for the attachment to Au NPs and examination of the local environment of the Au NPs surface.
12-(Acetylthio)dodecanol-1-oxyl-2,2,5,5-tetramethyl-2,5-dihydro-1H-pyrrole-3-carboxylate (5) -
The substitution reaction of potassium thioacetate and 12-bromo-1-dodecanol was completed to form 12-(Acetylthio)dodecanol (4) and examined for impurities using TLC.34 The structure of the product is shown in Scheme 2.
The product was then coupled with the commercially available nitroxide 3-Carboxy-2,2,5,5-tetramethyl-3-pyrroline-1-oxyl in the presence of DCC and DMAP to make
12-(Acetylthio)dodecanol-1-oxyl-2,2,5,5-tetramethyl-2,5-dihydro-1H-pyrrole-3-carboxylate shown below in Scheme 3.35 IR spectroscopy was used to characterize this ligand. Previous
experiments have shown that while the compound is not inherently sensitive to the pH of the system, it is valuable as an EPR probe for the studying of ligand dynamics in self assembled monolayers.
24 Scheme 3: Synthesis of 12-(acetylthio)dodecyl 1-oxyl-2,2,5,5-tetramethyl-2,5-dihydro-1H-pyrrole-3-carboxylate EPR active Ligand
S-10-oxo-10-(2-(1-oxyl-2,2,5,5-tetramethyl-2,5-dihydro-1H-imidazol-4-ylamino)ethylamino)decyl ethanethioate (6)-
A nucleophilic substitution reaction between potassium thioacetate and
10-bromodecanoic acid produced 10-(acetylthio)decanoic acid (2) illustrated in Scheme 4 was completed.34 The ligand formation was confirmed by 1H-NMR.
Scheme 4: Structure of 10-(acetylthio)decanoic acid
The nitroxide 4-(2-Aminoethylamino)-1-oxyl-2,2,5,5-tetramethyl-2,5-dihydro-1H-imidazole (3)
was then synthesized for the coupling to 10-(acetylthio)decanoic acid.36 2,2,5,5-Tetramethyl-2,5-dihydro-1H-imidazol-1-ol 3-oxide precursor was oxidized with MnO2 to form aldonitrone 2,2,5,5-tetramethyl-3-imidazoline-1-oxyl. This intermediate was then reacted with 2-bromoethyl isocyanate to afford 1-(2(Bromoethyl)-6-oxyl-5,5,7,7-tetramethyltetrahydroimidazo[1,5-b][1,2,4] oxadiazol-2-one. Thirdly, 1-(2(Bromoethyl)-6-oxyl-5,5,7,7-tetramethyltetrahydroimidazo[1,5-b][1,2,4] oxadiazol-2-one was treated with with NaN3 to give 4-[(2-Azidoethyl)amino]-1-oxyl-2,2,5,5-tetramethyl-2,5-dihydro-1H-imidazole as an oily product. Finally,
25 The product shown below in Scheme 5 was characterized using IR spectroscopy and found to be identical with a previously reported compound.36
The coupling of the nitroxide (3) to 10-(acetylthio)decanoic acid (2) shown in Scheme 6 was completed in the presence of DCC and DMAP.35 Due to the inoizable amidino group, S-10-oxo-10-(2-(1-oxyl-2,2,5,5-tetramethyl-2,5-dihydro-1H-imidazol-4-ylamino)ethylamino)decyl ethanethioate ligand has the potential to serve as a pH sensitive spin probe.
Scheme 6: Synthesis of pH sensitive ligand S-10-oxo-10-(2-(1-oxyl-2,2,5,5-tetramethyl-2,5-dihydro-1H-imidazol-4-ylamino)ethylamino)decyl ethanethioate
2.2.3 Gold
Nanoparticles-11-(dimethylamino)undecane-1-thiol hydrochloride-coated water soluble Au NP (7)- Using adapted one-pot synthesis literature procedures, stable
11-(dimethylamino)undecane-1-thiol hydrochloride-coated water soluble Au NP in small sizes were synthesized as illustrated in Scheme 7.37–39 11-(Dimethylamino)undecane-1-thiol hydrochloride
(1) was added to tetrachloroaurate in a solution THF and acetic acid and stirred overnight at room temperature. The solution was then cooled to 0°C and ice cold sodium borohydride
26 solution was added to the mixture and stirred at 0°C for 24 hours. The gold nanoparticles were then characterized using Scanning Electron Microscopy, Dynamic Light Scattering,
Transmission Electron Microscopy, and Thermal Gravimetric Analysis as subsequently shown below.
Scheme 7: Synthesis of 11-(dimethylamino)undecane-1-thiol hydrochloride-coated water soluble Au NPs
Figure 20: SEM Images of Gold Nanoparticles approximately 10nm in size
27 Figure 21: Dynamic Light Scattering analysis graphs generated by number% statistics in Table 3 of freshly
prepared 11-(dimethylamino)undecane-1-thiol hydrochloride-coated water soluble Au NP
Figure 22: TEM Image of 11-dimethylamino)undecane-1-thiol hydrochloride-coated water soluble Au NP with 20nm scale bar (right) and corresponding histogram (left) of nanoparticle size and frequency that it appears in the image determined by ImageJ software.
28 Table 4: Data from TGA analysis of 11-dimethylamino)undecane-1-thiol hydrochloride-coated water soluble Au NP
SEM images showed that the nanoparticles had an average diameter of 10nm. However, TEM images reveal that the nanoparticles are polydisperse within a range of 1nm to 10nm in size. The largest populations of particles can be determined from the histogram above to be from 1-3nm. Using the equation below, the average size of Au NP can also be calculated using the statistical data from the DLS measurements. Mean Number % was used to avoid a small percent of large sized particles, attributed to dust, but in so small numbers that it was too low to contribute to the whole.
Temperature (°C) Weight (mg) Weight %
200.2577 0.8516035 95.5784
297.2024 0.6733973 75.5777
297.5340 0.67332514 75.5696
500.3200 0.58662999 65.8395
Weight of Ligand (mg)
Portion One Total
0.178 0.265
Weight of Au (mg) 0.713 0.626
Thermal Gravametric Analysis of
11-(dimethylamino)undecane-1-thiol hydrochloride-Coated Water Soluble AuNP
Temperature, o C
0 200 400 600 800 1000
W ei gh t % 50 60 70 80 90 100 110
Temperature vs Weight %
29
𝑆𝑖𝑧𝑒 = ∑ 𝑆𝑖𝑧𝑒𝑖 𝑥 𝑀𝑒𝑎𝑛 𝑁𝑢𝑚𝑏𝑒𝑟%𝑖
𝑛 𝑖=1
100%
Using TGA, a mass loss which occurs from approximately 200°C to 500°C can be attributed to the loss of ligand from the gold core. From the information obtained through thermal gravimetric analysis, TEM, SEM and dynamic light scattering size measurements the potential compositions of 1nm, 2nm, 3nm, 6nm and 10nm size 11-(dimethylamino)undecane-1-thiol hydrochloride-coated water soluble Au NP was determined. The following representative calculations are completed using DLS data which reported 10nm particles. The same calculations were completed resulting in the table below for each of the potential sizes.
The volume of each nanocore can be determined as illustrated below.
VNP= 4 3 πr3=
4 3 π(
100.0Å
2 )
3
=523,599 Å3= 5.236 × 10⁻²⁵𝑚3=5.236 × 10⁻¹⁹𝑐𝑚3 The volume of Au cubic unit cell is
𝑉𝐴𝑢 𝐶𝑢𝑏𝑖𝑐 𝑈𝑛𝑖𝑡 = 𝚤3 = (4.0786 Å)3 = 67.847 Å3
Gold has a density of 19.3 g/cm3 so the mass of the gold nanocore = 1.011 x 10⁻¹⁷g. The number of gold atoms in the nanoparticle is found by
𝑚𝑎𝑠𝑠
197𝑔/𝑚𝑜𝑙 × 𝑁𝐴 =
1.011 ×10⁻¹⁷𝑔
197 𝑔/𝑚𝑜𝑙 ×6.022 × 10
23𝑝𝑎𝑟𝑡𝑖𝑐𝑙𝑒𝑠
𝑚𝑜𝑙 = 30,891
𝑎𝑡𝑜𝑚𝑠 𝑁𝑃
The surface area of the nanoparticle sphere is found by
𝑆 = 4𝜋𝑟2 = 4𝜋 (100.0Å
2 ) 2
= 31,16Å2
30
𝐶𝑒𝑙𝑙𝑠 𝑜𝑛 𝑆𝑢𝑟𝑓𝑎𝑐𝑒 = 𝑆
2.932 ≈ 3659 𝑐𝑒𝑙𝑙𝑠
If 3659 cells are on the surface then 27, 232 cells are found in the core. TGA data showed from 200.26°C to 297.20°C that a sample contained 0.7128mg(3.637x10⁻⁶mol of Au atoms) of Au NPs or 1.177x10⁻¹⁰ mol of Au NPs. The mass of ligand (0.178mg, 6.69x10⁻⁷mols) can then be used to determine the ligand:NP ratio of 5681.0 ligands: 1 NP. If we consider the second portion of the TGA curve, from 297.53°C to 500.32°C, the total mass Au (0.626mg, 3.19x10⁻⁶mol of Au atoms, 1.034x10⁻¹⁰ mols) and the total mass of ligand (0.265mg, 9.94x10⁻⁷mols) making the ligand ratio that of 9613.0 ligands: 1NP. Overall the ligand to gold ratio for each size shown below is 1:3 respectively.
Table 5: Potential Nanoparticle Sizes from DLS, TEM, SEM and the composition determined from TGA data
To examine the stability of the nanoparticles, a pH titration of of 11-(dimethylamino)undecane-1-thiol hydrochloride-coated water soluble Au NP in 0.025M NaCl and 0.1M NaCl was
completed with corresponding zeta potential measurements.
Size Composition
10nm Au30891Lig9613
6nm Au
7197Lig2267
3nm Au834Lig260
2nm Au
246Lig77
31 Figure 25: Titration of 11-(dimethylamino)undecane-1-thiol hydrochloride coated Au NP with 0.2M HCL/NaOH in
0.025M NaCl (dark circles) and 0.1M NaCl (open circles)
It was demonstrated that as the pH increases the zeta potential decreases until the amino groups are no longer positively charged and the nanoparticles are no longer stablized by
repulsion and aggregate. A different trend of salt concentration and pKa is also demonstrated in titrations of Au NP than in that of the titration of HMI nitroxide. Au NP titration in the
pressence of 0.025M NaCl has a pKa= 8.82, while those in 0.1M NaCl solution have a lower pKa=7.33. This affect can be contributed the screening of the nanopartcile by salt ions. In the top right of the graph, it can be seen that with an increase in salt concentration, more positive ligand caitons are screened and therefore a reduction in the zeta potential is present. Fewer OH -ions are needed to reach the half protentation point in the high concentration of salt as well. Finally, on the left side of the graph we can see that the ligand charge is neutral and the gold core exhibits a negative charge, but slightly less negative in higher salt concentrations due to
screening of the surface charges of the Au nanoparticle.
S-10-oxo-10-(2-(1-oxyl-2,2,5,5-tetramethyl-2,5-dihydro-1H-imidazol-4-ylamino)ethylamino)decyl ethanethioate modified Au NPs (8)-
32 below and ligand exchange was allowed to occur overnight.37 The modified Au NPs were
purified to remove excess ligand and X-band CW-EPR was then taken, determining ligand attachment was successful.
Scheme 8: Attachment of S-10-oxo-10-(2-(1-oxyl-2,2,5,5-tetramethyl-2,5-dihydro-1H-imidazol-4-ylamino)ethylamino)decyl ethanethioate ligands to Au NPs through ligand exchange
12-(Acetylthio)dodecanol-1-oxyl-2,2,5,5-tetramethyl-2,5-dihydro-1H-pyrrole-3-carboxylate modified Au NPs
(9)-Theoretically, 12-(Acetylthio)dodecanol-1-oxyl-2,2,5,5-tetramethyl-2,5-dihydro-1H-pyrrole-3-carboxylate (5) modified Au NPs would be synthesized as shown in the scheme below and following previous methods of ligand exchange.37 However due to time constraints the ligand was stored for future attachment and use in Au NP experiments.
33 Scheme 9: Theoretical Synthesis of 12-(Acetylthio)dodecanol-1-oxyl-2,2,5,5-tetramethyl-2,5-dihydro-1H-pyrrole-3-carboxylate modified Au NPs
2.3 Site Directed Spin Labeling of Single Stranded Deoxyribonucleic Acid:
34 Table 6: Primary and complimentary strand sequences of DNA used in Experiments
Table 7: Average distance between spin labels in each DNA strand from calculation methods, and measured distances with and without nanoparticles
Name
Average Distance Between Spin Labels
Calculated Calculated using NASNOX Measured Measured w/ Au NP
NUCS_2_20 6.1nm 6.2nm ± 0.47 5.8nm 5.6nm
NUCS_2_30 9.5nm 9.6nm ± 0.46 N/A 5.9nm
NUCS_T_2_20 6.1nm 6.3nm ± 0.46 6.2nm 6.0nm
Several different labeling schemes were developed using two different nitroxide molecules, 1-Oxyl-2,2,5,5-tetramethyl-3(methanesulfonyloxymethyl) pyrroline and 3-Iodomethyl-1-oxyl-2,2,5,5-tetramethylpyrroline, illustrated in Scheme 10.16
Scheme 10: A) Structure of 1-Oxyl-2,2,5,5-tetramethyl-3(methanesulfonyloxymethyl) pyrroline B) Structure of 3-Iodomethyl-1-oxyl-2,2,5,5-tetramethylpyrroline
Initially, a modified literature procedure for labeling was attempted using 1-Oxyl-2,2,5,5-tetramethyl-3(methanesulfonyloxymethyl) pyrroline suggesting elimination of the conversion step into an iodo-derivative due to the resonance-stabilized methanesulfonyl group serving as an
Name Strand
NUCS_2_20 NUCS_C
/5’Phos/-TT*C TAC CAA AAG TGT ATT TG*G AAA CTG CTC-/3’Phos/
/5’Phos/-GAG CAG TTT CCA AAT ACA CTT TTG GTA GAA-/3’Phos/
NUCS_2_30 NUCS_C
/5’Phos/-TT*C TAC CAA AAG TGT ATT TGG AAA CTG CTC*-/3’Phos/
/5’Phos/-GAG CAG TTT CCA AAT ACA CTT TTG GTA GAA-/3’Phos/
NUCS_T_2_20 NUCS_T_C
/5’Phos/-CC*A AAA GTG TAT TTG GGA AC*-/3’Phos/
/5’Phos/-GTT TCC AAA TAC ACT TTT GG-/3’Phos/
35 equally good leaving group as iodine.16 NUCS_2_20 in tris buffer was combined with an excess 0.1M solution of 1-Oxyl-2,2,5,5-tetramethyl-3(methanesulfonyloxymethyl) pyrroline in ethyl acetate over a period of 48 hours at room temperature. To separate excess free label and the labeled DNA, HPLC was employed. A reverse phase HPLC method was developed using a C-4 column (Phenomenex Jupiter, 250x 4.60 mm) and triethylammonium acetate buffer solutions.42 Based on literature data, it was hypothesized that the free nitroxide spin label because of its hydrophilic nature would elute with a low retention time.43 This was confirmed by running free 1-Oxyl-2,2,5,5-tetramethyl-3(methanesulfonyloxymethyl) pyrroline label through the column. With the nitroxide serving as a reference, labeled single stranded NUCS_2_20 was injected into the column. The chromatogram in Figure 27 shows three HPLC peaks of free label, labeled single stranded NUCS_2_20 and unlabeled NUCS_2_20 with 8.2min, 9.94min, and 10.83min retention time, respectively, and the corresponding fractions were collected separately. However, upon examination, only the first peak, corresponding to free label was EPR active, suggesting that the second peak consisted only of unlabeled DNA and not a combination of labeled and unlabeled. It was concluded that the labeling method would also need further modifications.
A second HPLC method was developed using anion exchange column (DNAPac™ PA-100, Analytical, 4 x 250mm).16 A sample of DT18 was then used to approximate the elution time of
36 an unlabeled DNA strand, however the elution time was much earlier (Figure 28, 2.2min,
12.2%B) than expected (15-20 minutes, 83%B-100%B). Labeled DNA, which has fewer charges, would theoretically appear between the free label and unlabeled DNA peaks, therefore separation with a shallower gradient of 2%B per minute from 25%B to 100%B was attempted before injection of the labeled single stranded NUCS_2_20 sample. With the new gradient conditions, as seen below, both DT18 (Figure 29, 17.85 min, 81.25%B) and free nitroxide (Figure 30, 0.954min, 11.69%B) elute at reasonable times based on their charge. With a gradient method, twice shallower at 1%B per minute, the elution of unlabeled single stranded
NUCS_2_20 can also be observed in Figure 31.
Figure 28: HPLC Chromatogram of purification of standard oligonucleotide DT18 using Anion Exchange Chromatography with gradient method 1
37 Figure 30: HPLC Chromatogram of free 1-Oxyl-2,2,5,5-tetramethyl-3(methanesulfonyloxymethyl) pyrroline using Anion Exchange Chromatography with gradient method 2
Figure 31: HPLC Chromatogram of purification of unlabeled single stranded NUCS_2_20 using Anion Exchange Chromatography with gradient method 3
With the potential for successful purification using HPLC the labeling method was then examined. After careful consideration of the labeling method, it was determined that while the pH=8 of the labeling buffer protected the integrity of the nitroxide, it had potential to deprotonate the phosphate groups (pKa= 7.2) of the DNA backbone and therefore more than the
phosphorothioate labeling sites (pKa= 5.4) had potential to be labeled, creating a molecule with significantly reduced negative charge, which would elute with the solvent front. The difference in the pKa is attributed to the larger size and polarizability of the sulfur atom in phosphorothioate which allows for a decrease in charge density in comparison to the oxygen molecule in
38 by reacting 1-Oxyl-2,2,5,5-tetramethyl-3(methanesulfonyloxymethyl) pyrroline with NaI.16 3-Iodomethyl-1-oxyl-2,2,5,5-tetramethylpyrroline (0.25M) was added to NUCS_2_20 and was allowed to react at room temperature for 48hours. The attachment of this label to DNA should be highly effective due to I- being a weak base, and therefore an excellent leaving group. With these modifications to the labeling procedure, single stranded labeled NUCS_2_20 was
successfully constructed, and in the chromatogram, Figure 32, with elution of the free nitroxide as expected at the beginning of the spectra 1min, 1.6%B and elution of the single stranded labeled EPR active NUCS_2_20 at 15-18min, 25.0-29.8%B. The single stranded NUCS_2_20 sample portion is represented by the two overlapping peaks, the first which is labeled
NUCS_2_20 and the second is unlabeled oligonucleotide. A steeper gradient condition of 2%B per minute within the elution window of NUCS_2_20 was developed to resolve the overlapping peaks, but proved unsuccessful. However, this optimization of the method allowed for a shorter run time of 12.98min, 25.96% with the same results. The unlabeled oligonucleotide was
considered insignificant because it would not affect any of the future EPR experiments. Circular dichroism was then run on the single stranded labeled NUCS_2_20 resulting the in the spectrum, in Figure 34, with features between 225-295nm corresponding to the monomeric nucleotides correlating to literature data.12,45,46 The spectrum shows a right handed stacking formation, similar to B-DNA, with a maxima centered at approximately 275nm and a minima at
approximately 240nm.47 This formation can be contributed to the hydrophobic interactions, and asymmetric sugar preferring a right-handed helicity. The absence of a peak beginning at the edge of our spectrum at 190nm suggests that there is no complexing between adenine and thymine residues which has been shown to indicated double strand formation.48
39 Figure 32: Anion exchange HPLC chromatogram of labeled single stranded NUCS_2_20
Figure 33: Anion exchange HPLC chromatogram of labeled single stranded NUCS_2_20 with a 2% concentration gradient
40 The single stranded labeled NUCS_2_20 portion was then lyophilized and the
complementary strand, NUCS_C, was combined and annealed following a standard literature procedure.16 The double stranded labeled NUCS_2_20 sample was then combined with 20 v/v% glycerol for a DEER spectroscopy sample. While the sample had strong signal when measured on X-Band (9.5Hz), there were only a few spin pairs detected, most likely because of low double labeling efficiency. A new sample of labeled NUCS_2_20 was prepared using an increased temperature of 37°C. The labeled NUCS_2_20 was then annealed to the complimentary strand before purification in attempts to increase the stability of the molecule. As show in Figure 35, double stranded labeled NUCS_2_20 elutes at a slightly later time of 17.8min, 35.6%B. The circular dichroism spectrum of double stranded labeled NUCS_2_20 shows a right-handed B-DNA formation and the coupling of all the bases with a positive band centered at approximately 275nm and a negative band centered at approximately 240nm.47 A large peak is visible in the 190nm range which suggests the complexing of adenine and thymine nucleotides.48 The
decrease in intensity can be attributed to the bases being positioned further away from each other in a more defined structure, decreasing the electronic transitions. The disappearance of the peak around 210nm also suggests that a coil to helix transition has occurred.49
41 Figure 36: Circular dichroism spectrum of labeled double stranded NUCS_2_20
2.3.1 4-Pulse DEER Spectroscopy of Nitroxide Labeled Oligonucleotides-
Interspin distances in the spin-labeled double stranded DNA samples were determined using DEER Spectroscopy. Each raw DEER data set was analyzed using two different
42 stranded DNA before labeling to increase accessibility of the labeling site; however, this method was unsuccessful as well. It was anticipated that in the presence of positively charged
nanoparticles, with a decreased distance between the nitroxides, the concentration of spin pairs would be sufficient for DEER detection.
Figure 37: NUCS_T_2_20 DEER echo modulation trace (left) and the distance distribution obtained from the raw data fitting (solid red line) using Tikhonov regularization method (right).
Figure 38: NUCS_T_2_20 DEER echo modulation trace (left) and the distance distribution obtained from the raw data fitting (solid red line) using Gaussian distribution method (right).
Time, s
0 2 4 6 8
F( t) ( a. u. ) 0.70 0.75 0.80 0.85 0.90 0.95 1.00 1.05
Time, s
0 2 4 6 8
F( t) ( a. u. ) 0.70 0.75 0.80 0.85 0.90 0.95 1.00 1.05 Distance, nm
43 Figure 39: NUCS_2_20 DEER echo modulation trace (left) and the distance distribution obtained from the raw data fitting (solid red line) using Tikhonov regularization method (right).
Figure 40: DEER echo modulation trace (left) and the distance distribution obtained from the raw data fitting (solid red line) using Gaussian distribution method (right).
2.3.2 4-Pulse DEER spectroscopy of nitroxide labeled oligonucleotides in the presence of Au
NP-To elucidate the effect of positively-charged ligand-protected AuNPs on the
conformational state of the double stranded DNA, the DNA samples containing AuNPs (see above) were prepared for DEER measurements. DEER measurement requires deep freezing of the sample, so the aqueous samples are typically doped with certain amount (~ 25-30 v/v%) of
Time, s
0 2 4 6 8
F(t) (a.u.) 0.70 0.75 0.80 0.85 0.90 0.95 1.00 1.05
Time, s
0 2 4 6 8
F( t) ( a. u. ) 0.70 0.75 0.80 0.85 0.90 0.95 1.00 1.05 Distance, nm
2 4 6 8 10
44 glass-forming agents, e.g., glycerol. To make sure that glycerol does not cause nanoparticles’ aggregation, the X-band EPR spectra were measured from the DNA- AuNPs sample before and after the addition of glycerol. As shown below in the three spectra for the three DNA strands the high field component decreased illustrating that although the all spectra fall into the fast motion regime, with each addition of glycerol the rotation of the nitroxide label in DNA becomes more restricted because of the increased viscosity of the solution. Besides, the absence of the slow-motion or rigid-limit spectral components also reveals that the addition of glycerol does not cause aggregation of the nanoparticles. The CD spectra of double stranded DNA in the presence of Au NPs, while still exhibiting B-DNA conformation, has decreased intensity at 275nm and increase intensity at 295. From literature data, similarly to that of DNA in the presence of an amine terminated cationic ligand the ellipticity of the DNA is distorted and with a continued increase in concentration of Au NPs the peaks contributed to B-DNA would become
negligible.50–52
45 Figure 42: Effect of glycerol and Au NPs on the X-Band EPR spectrum of NUCS_T_2_20
46 Table 8:Number Statistics of Dynamic Light Scattering for size measurement of 11-(dimethylamino)undecane-1-thiol hydrochloride-coated water soluble Au NP in the presence of 20% glycerol
Figure 44: DLS analysis graphs generated by number% statistics in Table 5 of freshly prepared 11-(dimethylamino)undecane-1-thiol hydrochloride-coated water soluble Au NP in the presence of 20% glycerol
Figure 45: CD spectrum of labeled single stranded NUCS_2_20 (green), labeled double stranded NUCS_2_20 (red), labeled double stranded NUC_2_20 in the presence of 11-(dimethylamino)undecane-1-thiol hydrochloride
47 An average interspin distance in the spin-labeled NUCS_2_30 in the presence of Au NP and 20 v/v% glycerol was measured to be 5.9nm, which is significantly smaller than the estimated distance of 9.5nm between the corresponding nucleotides (
48 technique would be sensitive enough to be able to distinguish between the smooth and kinked bending scenarios. For this reason, we chose truncated NUCS_T_2_20 for this experiment. However, the DEER measurements of Au NPs-NUCS_T_2_20 in the presence of 0.1 M NaCl did not show any change in the average interspin distance and the distance distribution widened. One of the reasons for this could be a flash freezing of the solution during the DEER sample preparation. This could cause a salt crystallization as a result of the solution vitrification. Another reason is that the electrostatic interaction between Au NPs and DNA could be so strong that it completely overwhelms the stabilizing effect of salt on the DNA double helix.53 And, finally, but not lastly, with this nanoparticle size, there was a chance that these two bending models did not cause any significant changes in the DNAs’ inter-terminus distance.
49
Figure 47: NUCS_2_20 DEER echo modulation trace (left) and the distance distribution obtained from the raw data fitting of the DEER echo modulation using Tikhonov regularization method (right) in comparison to the sample without nanoparticles (red).
50 Figure 49: NUCS_T_2_20 DEER echo modulation trace (left) and the distance distribution obtained from the raw data fitting of the DEER echo modulation using Tikhonov regularization method (right) in the presence of 0.1M NaCl (black) compared to that without salt (red).
2.4 Conclusions:
1. The effect of a solution ionic strength on the pKa values of pH-sensitive nitroxide broadly employed in the biophysical EPR studies was elucidated. Within the 0.1 M to 2.0 M ionic strength range, the pKa of the nitroxide was found to change significantly from pKa
4.58 to pKa 5.34. The nitrogen hyperfine coupling constants, Aiso, of the
non-protonated and non-protonated forms of the nitroxide were found to be essentially the same no matter what was the ionic strength of a solution. Thus, it was concluded that the changes in pKa of the nitroxide were not the result of the change in the dielectric properties of a solution, but the result of the enhanced stabilization of the protonated form of the nitroxide. The ionic strength-correction was shown to be absolutely necessary for accurate determination of the pH in solutions using the pH electrode.
2. A series of ligands was synthesized for gold nanoparticle surface decoration. A cationic ligand (1) suitable for forming stable, small and water soluble Au NP (7) for investigating the dynamics and conformation of DNA was synthesized. Ligands (5) and (6) were synthesized through DCC mediated coupling and coated onto Au NP through ligand exchange reactions. Ligand (6) is a nitroxide modified thioacetate serving as excellent pH sensitive EPR probes. When attached to Au NP (8) it would be useful in continued studies into the electrostatic interactions within the ligand shell layer. Ligand (5), which is also a nitroxide modified thioacetate, is not intrinsically sensitive to the pH of solution but would be valuable in studying the dynamics of self-assembled monolayers. This ligand was not attached to Au NP, although attachment is theoretically illustrated forming