ABSTRACT:
SCHICK, THOMAS. An Investigation of the Relationship Between a Type of Spatial Ability and Two Types of Reading Errors, Symbol Reversals and Letter Interchanges. (Under the direction of Dr. James W. Kalat and Dr. Samuel Snyder.)A substantial percentage of the population suffers from the effects of reading difficulties. These reading difficulties are caused by a wide array of proximate factors, some cognitive in nature, others emotional. This thesis examines whether some
proximate factors, which contribute to reading difficulties, may be caused by underlying attributes which coincidentally also may provide strength in other areas of endeavor. One such proximate factor is interchanging letters, reading the word saw when was is
A Thesis Equivalent
An Investigation of the Relationship Between a Type of Spatial Ability and
Two Types of Reading Errors, Symbol Reversals and Letter Interchanges
By
Thomas Schick [email protected]
A Thesis Equivalent submitted to the Graduate Faculty of North Carolina State University in partial fulfillment of the requirements for the Degree of
Master of Science
Department of Psychology North Carolina State University
Raleigh, North Carolina April 2003
Approved by:
_________________ __________________
Dr. James W. Kalat Dr. Samuel Snyder
_________________
Biography
Tom Schick immigrated to New York from Czechoslovakia in February 1939 at one year of age avoiding Hitler’s regime by only three weeks. After graduating from Hofstra University in 1959, he worked for IBM for nearly thirty- five successful and productive years receiving several awards including multiple patent disclosures. He has been happily married to Anne Sheehan Schick since 1973, having two beautiful children, Sarah, now age 27, and Jonathan now age 25. Mr. Schick received an MA in Liberal Studies in 1993 from Duke University. Before retiring from IBM he started tutor-mentoring children identified as disabled though most of them appeared to be not cognitively disabled but disabled by the “baggage” they carried. Upon retiring, from IBM, he continued the tutor- mentoring activity, and then initiated related education, this time at North Carolina State University, receiving an MS in Psychology in 2003.
Acknowledgements
I would like to acknowledge the assistance and encouragement received from a number of people. Specifically, thanks are due Dr. Lynne Baker-Ward whose insights in child psychology were intellectually challenging, and whose support helped me persevere. Dr. Donald L. Bitzer inspired me in a number of important ways. He also helped in writing the programs to test and measure results which contributed significantly to the success of the study. Dr. Slater E. Newman’s probing and sometimes penetrating comments
Table of Contents
List of Tables ... v
Introduction: ... 1
Overview:... 1
Some additional thoughts:... 6
Hypotheses:... 10
Method: ... 11
Participants:... 11
Tests:... 11
Test 1 (reversals):... 11
Tests 2 and 3... 13
Test 4 (spatial relations):... 15
Privacy and encouragement... 16
Results:... 17
Scoring: ... 17
Spatial Relations:... 18
Tests of Hypotheses:... 19
Correlations between Reversals and Interchanges:... 20
Types of Reversal (Test 1) and Interchange (Tests 2 and Test 3) Errors: ... 21
Discussion and Conclusions: ... 29
References... 35
Appendix A: Details Describing Test 1 ... 37
Appendix B: Details Describing Test 2 ... 39
Appendix C: Details Describing Test 3 ... 40
Appendix D: Test 4, A Mental Rotation Test of Spatial Relations ... 42
Appendix E: Tools... 46
Appendix F: Process ... 48
Appendix G: Instructions to Participants... 50
List of Tables
Table 1. Overall Data for Reversals (Test 1) and Interchanges (Test 2 and Test 3)... 18
Table 2. Mean Spatial Relations Scores For This Study and Prior Research (Voyer et al., 1995)... 18
Table 3. Correlations Between Spatial Relations and Reversals (Test 1), and Spatial Relations and Interchanges (Test 2 and 3) ... 20
Table 4. Correlations Between Reversals (Test 1) and Interchanges (Test 2 and 3) ... 21
Table 5. Test 1 Reversal Error Rate of Repeated Appearances of Letters and Symbols in the Successive Order as They Occurred in the Test Process ... 23
Table 6. Test 2 Interchange Unlike Errors ... 25
Table 7. Test 2 Interchange Like Errors ... 25
Table 8. Test 3 Interchange Errors... 26
Table 9. Age, Year, Major Course of Study, and Test Scores for Female Participants.. 27
Introduction:
Overview:
Reading difficulties adversely affect the lives of millions of people of all ages. About ten percent of the student population of the United States is labeled as being “learning disabled” (Hallahan and Kauffman, 1994), although the actual number of those with learning difficulties is three or four times greater1. Reading difficulties, experienced by the majority of these individuals, derive from a wide array of proximate factors. These include emotional stress, limited interest, inadequate teaching, physical disabilities such as sightedness, graphic distinctiveness, symbol or letter reversals, letter interchanges, weakness in phonics, temporal considerations, weakness in phonological awareness, the English language itself, and also basic cognitive characteristics. This list is intended to place the problem in perspective. What are the underlying causes of these proximate factors and do they coincidentally also provide strengths in other areas? This thesis focuses on two of these factors to determine their correlation with a strength in spatial abilities.
Recent studies (e.g., Felton, 1993) suggest that phonological awareness is a significant predictor of reading difficulties. The authors of these studies, however, do not indicate to what degree this is due to inadequate teaching, the English language itself, or to some cognitive limitation. In contrast, earlier studies (e.g., Orton, 1925) concluded that letter or symbol reversals and interchanges are the most significant proximate cause of
1
reading difficulties. This thesis focuses on these aspects of the problem and examines their relationship to spatial abilities.
Over the years various cognitive characteristics have been studied to determine the cause of letter and symbol reversals. Many of these including left/right orientation (Wechsler and Hagin, 1964), mixed dominance, for example being left handed while the right eye is dominant (Treischman, 1968), and limitations in perception (Robinson and Higgins, 1967) have not withstood close scrutiny. Since reversals appear to involve rotation in space, it seems reasonable to study the relationship between the frequency of reversals and performance on a test of spatial abilities that measures rotation in space. This relationship is examined in the study proposed here.
There may be a common underlying attribute causing reversals as well as spatial abilities. If so, the characteristic of reading difficulty resulting from the proximate cause of reversals may be a consequence of an underlying cause of both reversals and spatial abilities. Hence, this reading difficulty may not suggest a disability at all but rather a factor that results in a temporary reading difficulty along with a strength in spatial ability which could be important in several professions.
The direct motivation for this study is to gain a better understanding of the causes of reading difficulties; specifically, to determine whether the underlying attributes of some characteristics associated with reading difficulties are coincidentally also
behavior in general. Reversing letters, reading a b when a d is indicated is surely one such characteristic that contributes to a difficulty in reading. Its underlying attribute may also be associated with another cognitive characteristic, spatial relations, a useful capability, it is believed, for many professions including architecture, computer science, and
mathematics.
Others who have made related observations include, E. J. Gibson, J. J. Gibson, A.D. Pick, and M. A. Osser (1962), Eig (1974), Merritt (1972) and, Bannatyne (1972). While these researchers commented about the relationship between spatial abilities and reversals, they have not suggested, as is hypothesized in this thesis, that the stronger the spatial abilities the greater the likelihood that letter reversals will occur, that interchanges will occur, or that there may be a common attribute underlying both reversals and also a strength in spatial ability thereby placing an apparent difficulty in reading in a different perspective.
individual error rates. As will be seen in the results of this experimentation, nearly all people occasionally make these errors.
Gibson et al (1962) proposed that, during the early years, much of a child’s experience is wit h solid objects. “Solid objects, [they observed], have invariant qualities and distinctive features, and a 4-yr.-old has learned what he needs to distinguish many of these, perhaps at the same time he has begun to distinguish the invariants which permit constancy of shape and size as he moves about in space.” They proposed further that if “habits formed for object-discrimination are used when the child begins to make graphic discriminations, confusions due to rotation are to be expected” (Gibson et al, 1962, p.904). During the next four years the child learns, however, “… that transformations of rotation and reversal are significant for distinguishing graphic forms (i.e., the difference between ... d and b, p and b)” (Gibson et al, 1962, p.905). However, at age eight not all children are reversal-error free. What is it that differentiates these children from those who are reversal error- free? It is the purpose of this study to obtain information to help examine this question.
Note that Gibson et al (1962) experimented with letter-like symbols. None of the symbols used were letters. Their participants examined a set of symbols, reviewed one at a time, and compared them with a set of symbols placed directly in front of them.
between a b and a d may be slower in developing for some because of a greater strength in spatial relations; that is, the difficulty in learning the difference between b and d may be increased by strength in spatial relations. The present study evaluates this hypothesis by determining the relationship between frequency of symbol reversals and performance on a test of spatial relations.
There are several types of letter interchanges. These include reading full- word letter interchanges such as was for saw, partial- word letter interchanges such as left when
felt is indicated, or calm for clam, and non-word letter interchanges such as envelope and
evenlope, bark and brak, and palm and plam. Although, as indicated, there are several ways in which interchanges can be classified, each of which may be attributable to a different process, no attempt has been made to differentiate these in the present study. Thus, a single score for interchanges is determined for each participant on each of the two relevant tests. This study examines the relationship between the participants’ interchange scores and their correspond ing scores in spatial relations.
As is demonstrated by the experimental data of this study, interchanges occur relatively rarely across more than two letters. While interchange of two letters may be related to a strength in spatial relations, letter seque nce interchanges may relate to a characteristic in addition to one associated with both interchanges and individual letter reversals.
Underlying factors responsible for letter reversals may differ from those
Initial testing was done with college students for several reasons. The literature suggests, as indicated above, that reversals diminish with age to age eight and to a lesser degree beyond. Therefore, one endpoint to be tested is adults, especially college students. They will have had enough time and enough education to have learned that letter
orientation is important when recognizing that a b is different from a d. A positive correlation found between reversals and performance in spatial relations with college students, a select part of the spectrum, may suggest that a correlation, at least as large, would be observed with a younger population, one that has not had as much time and education to learn of their difference. Another important experiment would be to test children from the ages of four to eight. Furthermore, it was expected to be relatively easy to carry out the study with college students because of their ava ilability.
Some additional thoughts:
Children have different learning characteristics. Some of these differences which might appear to be weaknesses in some areas, may, as is being examined, also be
associated with abilities in other areas. There is a wide spectrum of reading difficulties. The person who reverses letters, sees a b when a d is indicated, and thus loses the meaning of a sentence has a real reading difficulty. People who are troubled with
unknown words, have a reading difficulty. The specific difficulties are many and need to be individually identified. A doctor treating a patient with walking difficulties
distinguishes between a person with a sprained ankle and one who has a fractured tibia. Likewise, each individual with one or more factors contributing to difficulty in reading might, more appropriately, be treated according to specific identifiable problem(s). One who is troubled by family disruptions needs to be treated differently from one who reverses letters. It can not be overemphasized that different methods should be used, as appropriate, to address each different type of reading difficulty.
Studies have shown that reading disabilities are inherited (e.g., Hermann, 1959; Zerbin- Rubin, 1967; Bakwin, 1973), yet what specifically is inherited is not clear. At least one aspect of reading difficulties relating perhaps to one’s spatial abilities may well be inherited.
between a b and a d is learned. If seeing the difference between a b and a d were innate then reversals possibly would be more consistent, and for those individuals where it was not consistent one might legitimately claim there to be a cognitive disability.
There is ample evidence to demonstrate a spectrum of capabilities for object constancy. Several IQ tests contain a subsection measuring strength in spatial relations. Because most children under the age of four do not distinguish between a b and d due to innate spatial abilities, they need to learn the distinction. Significantly, the degree of difficulty in learning the difference between b and d may be aggravated by a strength in spatial relations. This experiment studies the correlation between frequency of symbol reversals and strength in spatial relations.
Interestingly, females score lower than males in spatial relations tests (e.g. Voyer, Voyer,and Bryden, 1995). A correlation between spatial relations and reversals may contribute to explaining why females are identified with reading difficulties far less often than males. The feminization of the classroom may also contribute to an understanding of these statistics. Ignoring this observation, it is hypothesized, in this study, that those with increased tendency to reverse b and d, regardless of gender, would tend to have increased strength in spatial relations.
This study also examines the relationship between letter interchanges, reading left
when felt is indicated, and strength in spatial relations, perhaps a different type of spatial relations. A correlation between spatial abilities and either frequency of reversals or interchanges was expected to at least suggest support of the hypothesis related below.
disabilities”, as the terminology suggests, biases treatment from the outset. These
Hypotheses:
The characteristic of letter - or symbol - reversing, reading a b when a d is indicated, while surely being a hindrance in reading, may be a symptom of a fundamental underlying capability that provides strength in other areas. Furthermore, letter interchanging, reading on when no is indicated, is likewise not only a hindrance in reading, but may suggest a strength in other areas. Specifically, these symptoms may suggest a strength in spatial relations, a strength in object constancy - being able to see objects moved/rotated in space, as they would be in different views. There is a spectrum of capabilities for object constancy. One is born with an ability for object constancy. On the other hand, one needs to learn to see the difference between a b and a d. The degree of difficulty in learning that a b and d are different may be accentuated by a strength in spatial relations.
Succinctly stated, it is hypothesized that there is a positive correlation between frequency of symbol reversals (e.g. letters or symbols), and a strength in spatial relations. This study was designed to test this hypothesis. The second hypothesis tested is that there is a positive correlation between frequency of letter interchanges within a group of letters and a strength in spatial relations.
Method:
Participants:
The participants were 68 North Carolina State University students enrolled in the introductory course in psychology. Each participated to fulfill a course requirement. Specifically, 32 females and 36 males participated. Of those, 31 females and 34 males were determined to be valid participants. Three participants were dropped from the analysis because they were clearly uncooperative. One was too tired to participate, and the other two marked answers at random merely to complete the test.
Tests:
Four tests were administered to all participants, the first three dealing with reversals and interchanges and the last with spatial relations. Each is described more fully below. A computer was used to administer the first three tests.
Test 1 (reversals):
This test consists of five mini- tests. In each of these the participants were shown, on a computer screen, four specific letters called the “base group”, for example N, c, X, and b,
shown individually in the second group that matched one of the four base letters initially shown, that is, N, c, X, b. They were asked to press the space bar if the letter shown individually, in the second group, matched one of the four base letters, and to press the “enter” key if the letter did not match. The base group of letters was shown for two seconds and the individual letters in the second group were shown at the rate of one per second. Actually, each letter was shown every .8 seconds but this may have been somewhat extended because of the idiosyncrasies of the system including
communication-line interference and shared-processing power considerations. The variances were trivial, less than .1 or .2 seconds. A pilot test was used to determine the duration of display of these symbols. Two seconds resulted in few errors while half a second resulted in too many errors. One second was chosen because it was deemed appropriate to press these participants who were adults in college to increase error rates. If this experiment is performed with children no time constraints will be set.
The three letters, c, b, and N, were used because they may be easily spatially rotated and confused with other letters such as d, p, and q or non- letters such as a c with the opening to the left or N with the diagonal extending from the bottom of the left upright to the top of the right upright. The fourth letter, X, was used because it cannot be confused with any other letter even when spatially rotated. Other such letters used were
O, and I. It was viewed important that one of these three letters, X, O, or I, be included in the base set of letters.
preceded by a practice test. In the practice session the participant saw a different base group, comprised of the letters p, I, q, A. A detailed description of each mini-test is provided in Appendix A. Several preliminary sessions were used to determine a reasonable duration for character display.
Tests 2 and 3
While Test 1 was int ended to determine the frequency of individual letter reversals, such as reading b for d, Tests 2 and 3 were intended to determine the frequency of letter interchanges in a group of letters such as brak for bark, or saw for was, or left for felt, or
evenlop for envelop. Two different tests were designed to determine frequency of
interchanges. Each test may require somewhat different processes. Whereas, in Test 2 the participant was expected to remember the base group of letters for about ten seconds, across a series of groups of letters, in Test 3 the participant needed only to remember the base group of letters for less than one second. Test 2 was designed to show participants a group of three characters, the base group, followed by twelve groups of three characters where the participant was required to indicate which group(s) in the series of groups matched the base group. Another test, Test 3, was designed to show the participant three, four or five characters followed, a half second later, by another group of three, four or five characters. The participants were asked to indicate whether the second group was identical to the first. This was done for fifty pairs of groups.
Test 2:
and was asked, one at a time, to indicate whether any of these matched the base group. So for example, the participant was shown the group, l e f. S/he then was shown a set of groups, specifically, each of the following groups of letters individually,
f l e, j l f, t m n, l f e, f e l, l e f, p q t, b m f, l e f, t f e, l f e, and t e f. The participant was to indicate, as each group was shown individually, whether or not it matched the base group.
The base group was shown for two seconds followed by two seconds of blank screen. Each comparison group was shown for one second. One way in which this test differs from the first test is that the base group was to be compared with twelve other groups, each of which was displayed in succession. Each base group and the twelve groups that followed to be compared against the base group was called a mini-test. Each mini-test was shown in succession with a break of several seconds between mini-tests. The participant followed the same procedure as in Test 1 indicating whether there was a match between the base group and the currently-shown group by depressing the space bar, and a mismatch by depressing the ent er key. The frequency of display was the same as in Test 1, one every second. More details of this test are contained in Appendix B.
Test 3:
potentially matching group of characters. This was repeated for a series of 50 potentially matching pairs of groups of characters. Some of the groups of letters were words and some were non-words. Examples of words included, form versus from, lap versus pal, and saw versus was. Examples of non-words included some mentioned above plus plam
versus palm, evenversus enve, and barkversus brak. Appendix C contains a list of the groups shown.
Test 4 (spatial relations):
There are several spatial relation tests available. The specific spatial relations testing material used was the Michael Peters (1995) revised Vandenberg and Kruse Mental Rotations Test, a paper and pencil test of spatial relations. Appendix D contains a copy of the spatial-abilities test used. The participant compared a target figure with four vertically-rotated stimulus figures, two of which, when rotated, matched the target figure. The participant indicated which two stimulus figures matched the target figure by placing an X across the two matching figures.
Privacy and encouragement
Each participant may have possibly been somewhat reluctant to cooperate fully in the testing process because s/he may have felt the test results wo uld somehow be
Results:
This section first contains a description of the scoring of all the tests followed by analysis of the results. The analysis includes an examination of the following:
1) Correlation between reversals (Test 1 scores) and spatial abilities (Test 4 scores)
2) Correlation between interchanges (Test 2 as well as Test 3 scores) and spatial abilities (Test 4 scores)
3) Correlation between reversals (Test 1) and interchanges (Test 2 as well as Test 3),
4) Frequency of reversals, and 5) Frequency of interchanges
Scoring:
The scoring of data collected was the same for all three tests of the experiment. Specifically, the information collected included, 1) the sequence of groups of characters, 2) six response categories including four indicating whether or not the participant
indicated correctly or incorrectly for each match, or mismatch, and also two indicating timeout, 3) the speed of response measured in multiples of 100 ms, in addition to 4) the identification of the participant. Statistics were gathered on performance. Each
The analyses are separated according to gender because the spatial abilities are disparate. The p-value of .05 was used to determine statistical significance.
Table 1 indicates the results for Tests 1, 2 and 3. The size of the sample (N), total number of possible errors (E), mean frequency of errors (u), and the standard deviation of frequency of errors are indicated.
Table 1. Overall Data for Reversals (Test 1) and Interchanges (Test 2 and Test 3)
Male Female
N E u s.d. | N E u s.d. Test 1 34 100 5.53 5.46 | 31 100 5.45 5.18 Test 2 34 108 2.03 3.18 | 31 108 1.55 2.03
Test 3 34 50 1.18 1.77 | 30 50 1.30 1.49
Spatial Relations:
The spatial-relations test used in the study contained 24 questions. The results shown indicate the mean number of correct answers. Table 2 presents the means indicated in the literature (Voyer et al,1995) for the spatial relations testing along with corresponding means obtained in the present study:
Table 2. Mean Spatial Relations Scores For This Study and Prior Research (Voyer et al., 1995)
Male Female
The mean scores from this experiment, about 15 for males and 10 for females, are in line with the findings in the literature for the spatial-relations test chosen. Many other experiments (e.g. Voyer et al, 1995) using the rotational-spatial- relations test show a ratio of performance of 3 to 2 between males and females. This indicates that spatial relations as measured by this test are consistent with the data as reported in the literature, and lends credibility to the thesis experimental process for testing spatial relations.
Additionally, analysis comparing the results of the first and second half of the spatial-relations testing showed a correlation of .76 and .55 for females and males respectively. Additional analysis comparing the results of the odd and even halves of the spatial relations testing showed a correlation of .82 for both females and males. These analyses were performed for two reasons, 1) to determine the reliability of the spatial- relations test, (since there appears to be none reported in the literature as acknowledged via personal communication with the author) and also, 2) to determine the credible limits reasonably expected for other data collected. The correlations found for data relating spatial abilities with reversals and interchanges may be considered more substantial than the correlations shown in Table 3 given the limitations of .82 for females and males.
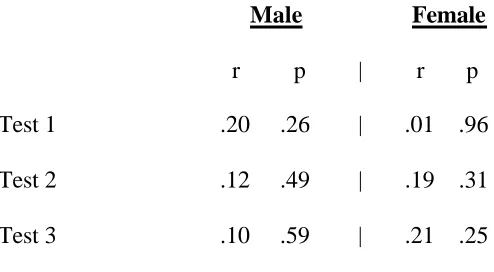
Tests of Hypotheses:
The two initial motivating hypotheses for this study are 1) that there is a positive correlation between spatial relations and reversals, and 2) that there is a positive
correlation between spatial relations and interchanges. The detailed data analysis
the correlation between spatial abilities and interchanges as indicated by the interchange data of Tests 2 and 3. Additionally, the table shows the correlation between spatial abilities and the sum of reversals and interchange frequencies as indicated by the results of Test 1, Test 2, and Test 3. The corresponding p-values indicate the respective level of significance for the correlation. Note that none of the correlations are statistically significant at the confidence level of p = .05.
Table 3. Correlations Between Spatial Relations and Reversals (Test 1), and Spatial Relations and Interchanges (Test 2 and 3)
Male Female r p | r p Test 1 .20 .26 | .01 .96 Test 2 .12 .49 | .19 .31 Test 3 .10 .59 | .21 .25
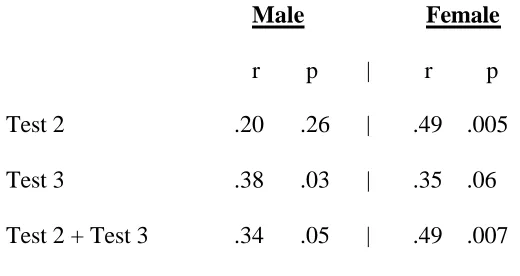
Correlations between Reversals and Interchanges:
Table 4. Correlations Between Reversals (Test 1) and Interchanges (Test 2 and 3) Male Female
r p | r p Test 2 .20 .26 | .49 .005 Test 3 .38 .03 | .35 .06 Test 2 + Test 3 .34 .05 | .49 .007
These data indicate that reversals and interchanges are highly correlated across the population even when the population consists of adults enrolled in college.
The correlation between the two interchange tests (Tests 2 and Tests 3) is .14 and .49 for males and females respectively with the corresponding p-values being .43, which is not statistically significant, and .006 which is statistically significant. From this one may conclude that at least for the females, Test 2 and Test 3 may be measuring a common factor. It is not clear why there is a disparity between males and females.
Types of Reversal (Test 1) and Interchange (Tests 2 and Test 3) Errors:
Additional results from this study which are presented in this section are summarized here. The evidence indicates that adults made many more reversal and interchange errors than is widely expected, especially among college students. For example, the letters b and d were reversed about 10% of the time. The word calm was confused for the word clam by 45% of the male and 32% of the female participants, respectively. The words form and from were confused 10% of the time. The words on
respectively. The words bar and bra were confused 24% and 23% of the time for males and females respectively. These and many more examples are highlighted in the details shown below.
The frequency of reversals was shown to be greater than the literature indicates. While Gibson et al. and others suggest that reversals diminish to 5% at age eight and suggest less than that latter, reversal errors for the college students in this study were substantially higher than 5% percent (See Table 5). The several instances shown for the letters and symbols reflect the repeated appearances of those letters and symbols in the successive order as they occurred in the test process.
Table 5. Test 1 Reversal Error Rate of Repeated Appearances of Letters and Symbols in the Successive Order as They Occurred in the Test Process Items Presented Male Female
N-Reversed 29% 26%
15 23
15 13
21 16
15 13
15 19
c-Reversed 09 13
06 06
12 10
06 06
J-Reversed 12 13
09 10
12 13
06 13
18 19
12 10
12 10
L-Reversed 09 32
15 32
21 29
26 23
c 15 03
06 06
p 12 06
09 10
26 23
26 26
06 10
q 12 19
09 13
10 00
06 03
06 10
06 06
10 10
d 15 16
12 06
06 03
b 15 00
12 10
In this study the average rate of reversals was found to be a rather substantial 12.78% and 13.15% for males and females respectively. The corresponding SDs were 6.1 and 8.3. A confound worth indicating was highlighted by one participant who mentioned at the end of the test that she was not sure that N and its reversal were not to be viewed the same. Testing with children this awareness would need to be explicitly highlighted. However, even when disregarding the reversed symbols, that is N-reversed, L-reversed, J-reversed, and c-reversed, the averages are 11.5% and 9.5% for males and females respectively. The corresponding SDs were 5.9 and 7.1. These numbers are surprisingly high when compared with Gibson et al’s (1962) average of 5% at age eight and predictably lower with aging. These averages are interesting especially because the participants here were not taken from the general population but were college-age and college-educated students. Note these later statistics do not reflect reading characteristics when reading in context but the reading of individual letters. In Gibson et al’s (1962) experimentation the letter- like forms were also presented without reading context.
Table 6. Test 2 Interchange Unlike Errors Items Presented Male Female
On versus no 29 % 13 %
Bar versus bra 24 23
Cla versus cal 21 10
Lef versus lfe 9 6
Similarly, many like comparisons were confused as being dislike. The most substantial proportion of like match interchanges (Test 2) are indicated in Table 7:
Table 7. Test 2 Interchange Like Errors Items Presented Male Female
Lef 12 % 19 %
Saw 9 10
On 15 16
Cla 15 13
Bra 18 7
Nve 35 19
Pla 18 7
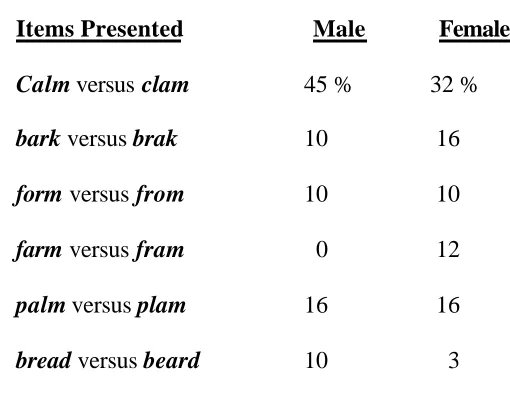
Table 8. Test 3 Interchange Errors
Items Presented Male Female
Calm versus clam 45 % 32 %
bark versus brak 10 16
form versus from 10 10
farm versus fram 0 12
palm versus plam 16 16
bread versus beard 10 3
As may be seen, there is a large rate of interchange of letters.
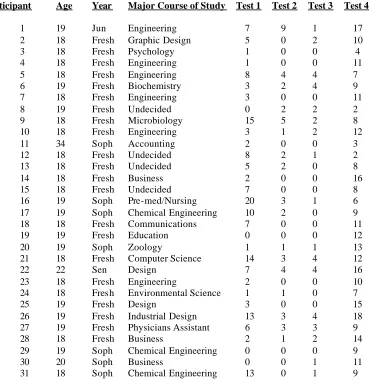
Table 9. Age, Year, Major Course of Study, and Test Scores for Female Participants
Participant Age Year Major Course of Study Test 1 Test 2 Test 3 Test 4
1 19 Jun Engineering 7 9 1 17
2 18 Fresh Graphic Design 5 0 2 10
3 18 Fresh Psychology 1 0 0 4
4 18 Fresh Engineering 1 0 0 11
5 18 Fresh Engineering 8 4 4 7
6 19 Fresh Biochemistry 3 2 4 9
7 18 Fresh Engineering 3 0 0 11
8 19 Fresh Undecided 0 2 2 2
9 18 Fresh Microbiology 15 5 2 8
10 18 Fresh Engineering 3 1 2 12
11 34 Soph Accounting 2 0 0 3
12 18 Fresh Undecided 8 2 1 2
13 18 Fresh Undecided 5 2 0 8
14 18 Fresh Business 2 0 0 16
15 18 Fresh Undecided 7 0 0 8
16 19 Soph Pre-med/Nursing 20 3 1 6
17 19 Soph Chemical Engineering 10 2 0 9
18 18 Fresh Communications 7 0 0 11
19 19 Fresh Education 0 0 0 12
20 19 Soph Zoology 1 1 1 13
21 18 Fresh Computer Science 14 3 4 12
22 22 Sen Design 7 4 4 16
23 18 Fresh Engineering 2 0 0 10
24 18 Fresh Environmental Science 1 1 0 7
25 19 Fresh Design 3 0 0 15
26 19 Fresh Industrial Design 13 3 4 18
27 19 Fresh Physicians Assistant 6 3 3 9
28 18 Fresh Business 2 1 2 14
29 19 Soph Chemical Engineering 0 0 0 9
30 20 Soph Business 0 0 1 11
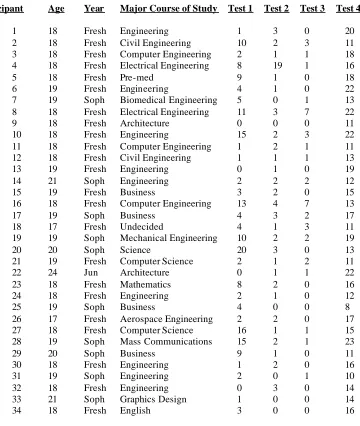
Table 10. Age, Year, Major Course of Study, and Test Scores for Male Participants
Participant Age Year Major Course of Study Test 1 Test 2 Test 3 Test 4
1 18 Fresh Engineering 1 3 0 20
2 18 Fresh Civil Engineering 10 2 3 11
3 18 Fresh Computer Engineering 2 1 1 18 4 18 Fresh Electrical Engineering 8 19 1 16
5 18 Fresh Pre-med 9 1 0 18
6 19 Fresh Engineering 4 1 0 22
7 19 Soph Biomedical Engineering 5 0 1 13 8 18 Fresh Electrical Engineering 11 3 7 22
9 18 Fresh Architecture 0 0 0 11
10 18 Fresh Engineering 15 2 3 22
11 18 Fresh Computer Engineering 1 2 1 11
12 18 Fresh Civil Engineering 1 1 1 13
13 19 Fresh Engineering 0 1 0 19
14 21 Soph Engineering 2 2 2 12
15 19 Fresh Business 3 2 0 15
16 18 Fresh Computer Engineering 13 4 7 13
17 19 Soph Business 4 3 2 17
18 17 Fresh Undecided 4 1 3 11
19 19 Soph Mechanical Engineering 10 2 2 19
20 20 Soph Science 20 3 0 13
21 19 Fresh Computer Science 2 1 2 11
22 24 Jun Architecture 0 1 1 22
23 18 Fresh Mathematics 8 2 0 16
24 18 Fresh Engineering 2 1 0 12
25 19 Soph Business 4 0 0 8
26 17 Fresh Aerospace Engineering 2 2 0 17
27 18 Fresh Computer Science 16 1 1 15
28 19 Soph Mass Communications 15 2 1 23
29 20 Soph Business 9 1 0 11
30 18 Fresh Engineering 1 2 0 16
31 19 Soph Engineering 2 0 1 10
32 18 Fresh Engineering 0 3 0 14
33 21 Soph Graphics Design 1 0 0 14
Discussion and Conclusions:
Several findings may be reported as a result of this experimentation including frequency of reversals, frequency of interchanges, the correlation between reversals and interchanges, and, at least for this sample, the correlation between spatial abilities and reversals as well as the correlation between spatial abilities and interchanges.
The findings of this study indicate that even individuals in their college years reverse symbols and interchange letters with substantial frequency. While it is expected that young children interchange letters with a relatively high frequency, it was expected that the corresponding frequencies would have diminished considerably more by college age and certainly for college students than the results show. Surely, one would expect college students to distinguish more clearly between the words bar and bra than the data indicate. The frequency of reversals at the college age was similarly surprising;
substantially greater than the earlier literature would suggest.
Also, it was shown that there is a statistically significant correlation between reversals and interchanges indicating that those who reverse symbols also interchange letters. These findings not only have strong correlations but also strong p-values indicating they are statistically significant. These results appear strong for college students but may be much stronger for young children before reading has had time to develop. It, therefore, appears appropriate to provide this test to young school-age children.
indicate that the correlation found between spatial relations and frequency of interchanges was not statistically significant.
To summarize, the strong correlations of reversals and interchanges are
statistically-significant findings. Also, the frequency of reversals and interchanges have been revealed to be substantial. However, the study does not provide statistically significant evidence for a positive correlation between spatial relations and either interchanges or reversals. Collectively, all of the findings of this analysis, mentioned above, indicate further stud y with a larger sample is needed. Because of the information gathered, and because of the high rate of reversals found in earlier studies among young children, the hypothesis is more pertinent to the earliest reading ages. Therefore, it would be worthwhile to perform further testing with a younger sample, children at the ages of five to seven, when reading is initially taught.
A larger sample may or may not present a higher correlation, but it will get a more accurate estimate of the true correlational value. Also, when reflecting on the reliability of the spatial-abilities test, as shown by the correlation of the two halves of spatial abilities scores as indicated above, the correlations shown here become somewhat stronger. Given the evidence for this sample, and given the rationale for the hypothesis, further testing is needed.
Some might say, it is likely that context improves reading accuracy; that these numbers reflect an out-of-context examination. The intent of this study was to remove the confound of contextual reading. So, while I would certainly agree and hope that these statistics would be better for individuals when reading contextual information, the intent was to determine reading difficulties before context enters the equation.
Symbol reversals have been researched for decades. The work of Lockhead and Crist (1980) regarding symbol distinctiveness is reported indicating that a partial solution has been demonstrated. They demonstrated that one of the causes of reading difficulties relates to issues with fonts such that the words now and how appear similar. As indicated by Lockhead and Crist (1980), these could perhaps be corrected with clearer or different font definitions. Lockhead and Crist (1980) also suggest that letter reversals, such as d
and b, could be corrected with font changes such that, for example, b’s may have a flag so that they cannot be reversed; that is, a short slanted line extending from the top of the
b to the left. This solution to the problem could correct some aspects of reading
difficulties yet leave the potential strength for spatial relations unaffected. The Lockhead suggestions were documented in an article twenty years ago with clear evidence
Data for this experiment were gathered testing college students. These results relate to a select section of the population, those who have devoted many years to
develop reading skills and thus might be expected to kno w the difference between a b and its reversal, as well as the difference between words such as calm and clam. Therefore, though the number of years and amount of formal education experienced by each individual confound the results, the error results are relatively high. Also, college
students do not represent a random sample of the general population, but a select subset. Thus, in spite of this apparent confound, the experimentation presents both surprising and interesting results.
Male participants ranged in age from seventeen to twenty- four with an average age of 18.7. Female participants ranged in age from eighteen to thirty- four with an
average age of 19.1. This is well above the ages most relevant for these hypotheses, but it was thought that even here some supportive indication would surface.
Much has been written recently suggesting that a weakness in phonological processing is the major cause of reading difficulties. Is it phonological processing or a multitude of other factors that cause reading difficulties? To what extent do reversals and interchanges contribute to reading difficulties? Is it an underlying factor of reversals or interchanges, and is that factor distinct from that of phonological processing? Are these merely first-order proximate causes? Have we just started on the trail of proximate causes in developing the chain of proximate causes leading to an understanding of the ultimate cause(s) of reading difficulties? Are reading difficulties caused by a large set of
proximate chains of causes collectively resulting in the variations of reading difficulties? Is there a need to analyze not only the chain of proximate causes but also the myriad of interrelationships among chains of proximate causes? Are variations of these questions pertinent across cognitive psychology? Ecological sciences have developed with a clear orientation studying not only proximate chains of causes but their important
interrelationships as well. Surely, reading difficulties are caused by a multitude of factors from emotional issues to the English language itself. While this thesis focused on the impact of reversals and interchanges on reading, its underlying, unwritten objective was to further the cognitive sciences.
This study and one proposed to follow with young school-age children examining the relationship between a strength in spatial relations and both reversing letters and interchanging letters may well highlight that some reading characteristics such as reversals and interchanges suggest strengths not just disabilities. The results of these studies, thus, may lead to the development of more appropriate educational treatment of young students who demonstrate these characteristics than is the case now. Specifically, treatment should highlight each individual’s potential strengths, not merely reflect reading difficulties. Furthermore, it is hoped that these findings will affect not only the handling of students with apparently limiting reading characteristics but other subtypes of reading characteristics as well, and even learning characteristics in general. This should, in turn, encourage individuals to recognize the strengths of their learning characteristics, pursue these strengths and, importantly, prevent self-confidence depression - perhaps even increase self-confidence. Individuals should not merely be allowed, but encouraged to learn in a manner appropriate to their orientation. The underlying factor resulting in the apparent difficulty may coincidentally also underlie another characteristic, such as
References
Bannatyne, A. (1972). Mirror- images and reversals. Academic Therapy, 8, 87-92 Chapman, J. W. (1988). Learning disabled children’s self-concepts. Review of Educational Research. Fall 1988,Vol.58 No.3. 347-371
Chapman, J. W. (1988). Cognitive-motivational characteristics and academic
achievement of learning disabled children: A longitudinal study. Journal of Educational Psychology. 1988,Vol.80 No.3. 357-365
Davidson, H. P. (1934). A study of reversals in young children. Department of Child Guidance: Bedford Hills, N.Y.
Davidson, H. P. (1934). A study of the confusing letters b, d, p, q. Department of the Board Of Education: Rochester, N.Y.
Eig, J. B. (1974). An exploratory study of orientation effects upon normal and
dysfunctional children’s figure-completion ability at two grade levels. A Dissertation, Univ. of Maryland, Order No. 75-18,091, 129 pages
Felton, R. H. (1993). Effects of instruction on the decoding skills of children with phonological-processing problems. Journal of Learning Disabilities. Vol.26. No.9. 583-589.
Gibson, E. J., Gibson, J. J., Pick, A. D. & Osser, H. A. (1962). A developmental study of the discrimination of letter- like forms. Journal of Comparative and Physiological
Psychology. 55, 897-906.
Hallahan, D. P. & Kauffman, J. M. (1994). Exceptional Children: Introduction to Special Education. Needham Heights, Ma: Simon and Schuster
Ilg, F. L., & Ames, L. B. (1950). Developmental trends in reading behavior. Journal of Genetic Psychology 76, 291-312
Keogh, B. K., Sears, S., & Royal, N. (1988). Slingerland Screening and Instructional Approaches for Children At-Risk for School. In Masland
Licht, B. G. (1983). Cognitive- motivational factors that contribute to the achievement of learning-disabled children. Journal of Learning Disabilities. Vol.16 (8). 483-490
Lockhead, G. R., & Crist, W. B. (1980). Making letters distinctive. Journal of Educational Psychology.72, No.4, 483-493.
Masland, R. L., Masland, M. W. (1988). Prevention of Reading Failure. Parkton, Md: York Press, Inc.
Merritt, J. E. (1972). What is Reading Readiness? In J.F. Reid (Ed), Reading: Problems and Practices. London: Ward Lock Educational
Orton, S. T. (1925). “Word blindness” in school children. Archives of Neurology and Psychiatry 14, 581-615
Peters, M., Chisholm, P., & Laeng, B. (1995). Spatial ability, student gender, and academic performance. Journal of Engineering Education, Jan.1995, 69-73.
Peters, M., Laeng, B., Latham, K., Jackson, M., Zaiyouna, R., & Ric hardson, C. (1995). A redrawn Vandenberg and Kuse mental rotations test: Different versions and factors that affect performance. Brain and Cognition 28, 39-58
Robinson, J. S., & Higgins, K. E. (1967). The young child’s ability to see a difference between mirror- image forms. Perceptual and Motor Skills, 25, 893-897
Trieschmann, R. B. (1968). Undifferentiated handedness and perceptual development in children with reading problems. Perceptual and Motor Skills, 27, 1123-1134
Voyer, D., Voyer, S., & Bryden, M. P. (1995). Magnitude of sex differences in spatial abilities: A meta-analysis and consideration of critical variables. Psychological Bulletin, Vol.117, No.2, 250-270
Appendix A: Details Describing Test 1
The letters shown in each mini- test of Test 1 include
a base group for mini- test 1 consisting of L q O d shown together for two seconds followed by twent y individual letters namely L, L(reversed) p, b, q, d, O, etc.
a base group for mini- test 2 consisting of I p J b shown together for two seconds followed by twenty individual letters namely J, J(reversed) p, b, q, d, I, etc.
a base group for mini- test 3 consisting of N b J O shown together for two seconds followed by twenty individual letters namely N, N(reversed), J, J(reversed), p, b, q, d, O, etc
a base group for mini- test 4 consisting of J c q I shown together for two seconds followed by twenty individual letters namely J, J(reversed), c, c(reversed), p, b, q, d, I,
etc
a base group for mini- test 5 consisting of N c X b shown together for two seconds followed by twenty individual letters namely N, N(reversed), c, c(reversed), p, b, q, d, X, etc
q, h, p, L, b, O, d, reversed-L, L, reversed-c, q, b, reversed-L, d, L, d, p, reversed-L, b,
reversed-L,
and
q, reversed-J, p, c, I, f, d, k, J, q, b, reversed-J, c, q, J, d, reversed-J, c, J, d, and
reversed-J, q, J, N, reversed-J, reversed-N, p, q, b, reversed-N, reversed-J, N, q,
reversed-N, m, b, reversed-J, J, O, N, and
q, f, p, reversed-J, a, d, p, m, q, reversed-c, d, c, reversed-J, reversed-c, d, reversed-c, b, J, I, q,
and
c, reversed-c, m, b, reversed-N, d, s, p, reversed-N, c, X, b, c, q, d, N, reversed-c,
Appendix B: Details Describing Test 2
In Test 2 the participant saw a base group of three letters on the screen for two seconds and then a series of twelve groups of three letters each. These groups of three letters were seen at the rate of one group per second. The following are the specific base groups of three letters followed by the groups of three letters examined. The participant determined whether each group individually matched the base group;
b r a versus m k g, p r a, r a b, b a r, b r a, g h i, b a r, p t n, b r a, h d o, d r a, b a r s a w versus f g p, q v p, w a s, d v n, s a w, a j l, e l c, a w s, z o l, s a w, r t g, w a s n v e versus f k l, w e t, v e n, n v e, d p r, e v n, k f o, j c p, n v e, s p u, t p o, v e n o n versus t o, f o, o m, o u, n o, o t, o n, r o, o n, r o, u o, n o
Appendix C: Details Describing Test 3
The following is a list of groups of letters shown as part of Test 3. The first word or group of letters was shown for an instant followed by the second word or group of letters. Each pair of words was shown within a second, followed by the next pair shown within the next second, for a total of fifty pairs of words.
Appendix D: Test 4, A Mental Rotation Test of Spatial Relations
Appendix E: Tools
A program was written for this experiment, specifically to test symbol reversals and interchanges. It is based on NovaNet. The program provides some instructions along with oral instructions given by the experimenter. It uniquely identifies each individual
participant.
For Test 1 the program;
Displays four base symbols on the screen Base symbols are L q O d
Location; middle of the screen,
12 pitch, with two blanks as separators
Provides a practice session with a different set of base symbols namely p, I, q, A. The experimenter orally presents instructions of the experiment.
The system does not wait for responses between screens. Even if there is no response, it will keep going.
The program creates a record for each participant including; Specific sequence of characters that the participant saw
Indication whether each response was correct, false, or no answer Time to respond for each symbol is indicated in multiples of 100 ms. This informatio n permits calculation of different character response times. Similarly for experiment Test 2;
The system displays three base symbols on the screen Base symbols, for example are l e f
12 pitch, with two blanks as separators The participant is provided with a practice session for Test 2. In Test 2 as in Test 1, the experimenter provides instructions. Similarly for Test 3;
Displays three, four, or five base symbols on the screen
Followed by a corresponding group of three, four, or five base symbols Base symbols, for example are form, followed by from
Location; middle of the screen, 12 pitch,
Provides a practice session.
In Test 3, as in Tests 1 and 2, the experimenter provides instructions. The system indicates – “Press the return key when ready to start the experiment.”
Consistently for all the three first tests of the experiment, the system will not wait for a response between screens. The program creates a record for each participant for all three tests including;
Specific sequence of characters that the participant saw
Appendix F: Process
The program guides the participant through a series of activities, namely; 1) Identifying the participant
Includes pseudonym, (gender and age were manually provided) 2) Overview presentation
The participant was given a brief oral overview of what to expect and how the results would be used.
3) Reading
The program displays textual material. The participant sees, for example in Test 1, a group of four characters and then a series of individual characters at the rate of one every second. S/he is asked to indicate whether each character shown matches one of the four base group characters shown. S/he is to respond by depressing the space bar indicating that the current character matches one of the base four characters, or depressing the enter key when the currently-shown character does not match any of the four base characters. Statistics are gathered as the activity progresses. This includes time to respond, number of symbols missed (not responded to quickly enough), an analysis of letters
misrecognized, for example frequency of d’s, mirror images versus rotation on the horizontal axis or vertical axis, and others as they prove useful.
as quickly as possible whether the current group matches the base group by depressing the space bar, or if it does not match by depressing the enter key. The process is similar to the test described above. The measures taken are the same as those taken for Test 1. 5) Examining spatial-relations graphics.
A spatial-relations paper test was used; one relating to reversals. Specifically, in each mental-rotation-spatial abilities test the participant saw a base object followed by a series of four objects, two of which were rotated in space and to be recognized as the same as the base object while the other two were rotated but not the same as the base object. The participant was asked to identify the two objects unlike and the two like the base object. 6) Partial debriefing and thanking
The participant was thanked for participating and given a brief summary of how his or her participation had been useful.
7) Full debriefing
The participant was invited to a subsequent full debriefing, perhaps weeks after the completion of all the testing, explaining the full purpose of the experiment - to determine the correlation between frequency of symbol reversals, symbol interchanges and
Appendix G: Instructions to Participants
Participants were introduced to the specifics of the experimental system. They were given instruction on the use of the system, and shown what to expect and how to react. They were allowed some time to practice with the total experimental system. They were given enough time to ask any questions before the actual experiment began because, they were told that any questions during the course of the experiment must be limited to system idiosyncrasies.
The oral instructions were as follows;
“Because these instructions must be identically presented to each participant, I will read them to you.
You will be given four tests. The first three tests will take about two minutes each. A computer will be used for these tests. I will give you instructions before you begin each test. The fourth test is a paper-and-pencil test concerning spatial relations. It will have separate written instructions.
If at any time, for any reason whatever, you cannot finish the experiment, you may leave without penalty.
If you have a drink or gum, please set it aside until we are finished so that it will not distract you during the experiment.
1) You will be shown a base set of four letters on the screen.
2) The system will then present 20 characters, one at a time. You are to indicate, as fast as you can, as each is presented, whether each matches one of the base four letters. These will be presented at the rate of about one per second. At the end of each mini-test you will be asked to press the return key, when ready, to continue with the next mini- test.
In other words, in mini- test one you will be shown a base set of four letters on the screen followed by 20 individual characters shown about one every second. You will then, immediately upon pressing the return key, be given mini-test two in which you will be shown four different base letters followed by another 20 characters. Similarly, you will be given mini-test three, four, and five collectively comprising Test 1.
3) You are to indicate, as fast as you can, by pressing the space bar, that the character currently displayed matches one of the four base characters. Press the return key to indicate that the currently-displayed character does not match any of the four base characters. Again, depress the space bar to indicate a match, the return key to indicate a mismatch. Position a finger of your left hand on the space bar and a finger of your right hand on the enter key now so that you do not have to look at the keyboard during the experiment. This will be consistent throughout the entire experiment.
5) The purpose of this part of the experiment is to determine yo ur speed in recognizing matches to the base four characters. Relax, and do your best.
6) You will now be given the opportunity to practice before beginning the real test. Please position your hands and press the enter key to start the practice session when you are ready”
After the practice session the participant will be told
“7) If you have any questions, please ask them now because once we begin there can be no questions or answers because these would affect the timing of the experiment. Do you have any questions?
8) When you are ready, press the return key to begin.” That is the end of the instructions for Test 1 of the experiment. After completing Test 1 the participant was told
“You have now completed Test 1. Test 2 consists of several mini- tests
1) You will be shown a base group of three letters on the screen.
2) The system will then present groups of three characters, one at a time. You are to indicate, as fast as you can, as each group is presented, whether it matches the base group of three letters, in order and type. These groups will be presented at the rate of about one per second. In each mini-test one or more groups will match the base group.
3) Again, depress the space bar to indicate a match, the return key to indicate a mismatch.
5) This process will be repeated for a number of mini-tests, displaying a base group of three letters followed by a number of groups of three letters shown one at time.
6) You will now be given the opportunity to practice before beginning the real test. Please position your hands now and press the enter key to start the practice session when you are ready.
7) The purpose of this second test of the experiment is to determine your speed in recognizing matches to the base three characters. Relax, and do your best.”
After the practice session the participant was told
“8) If you have any questions, please ask them now because once we begin there can be no questions or answers because these would affect the timing of the experiment. Do you have any questions?
9) When you are ready, press the return key to begin.” That is the end of the instructions for Test 2 of the experiment. After comp leting Test 2 the participant was told;
“You have now completed Test 2. In Test 3
1) You will be shown a base group of three, four or five letters on the screen.
groups of letters to be compared. These pairs of groups will be presented at the rate of about one per second.
3) Again, depress the space bar to indicate a match, the return key to indicate a mismatch.
4) If you fail to respond before the next group is displayed, do not worry. Continue by processing the next group as quickly as possible.
5) The purpose of this third test of the experiment is to determine your speed in recognizing matches to the base characters. Relax, and do your best.
6) You will now be given the opportunity to practice before beginning the real test. Please position your hands now and press the enter key to start the practice session when ready”
After the practice session the participant was told
“7) If you have any questions, please ask them now because once we begin there can be no questions or answers because these would affect the timing of the experiment. Do you have any questions?
9) When you are ready, press the return key to begin.”
Upon completion of Test 3 the participant was given Test 4 which has its own written instructions and practice session. Instructions were read to each participant. Additionally, participants were allowed to review the written instructions, and were given the
Several verbal questions were asked;
Do you reverse letters? For example, see a b when a d, p, or q is indicated? If so how often?
Did you reverse letters when you were younger? If so how often?
Do you interchange letters? For example see was when saw is indicated? How often? Did you interchange letters when you were younger? How often?
Please indicate your gender. Please indicate your major. Please indicate your age.
Appendix H: Debriefing
The following was related to participants. “Before you leave, there are two things I would like you to know. First, the purpose of this experiment is to determine whether there is a relationship between spatial abilities and certain reading characteristics.
Specifically, whether reversing letters or interchanging letters correlate with performa nce on a test in spatial relations.
Secondly, and this is important, please do not say anything about this experiment to anyone. The reason is this: we are going to be running this experiment for several months, and it may be that someone you know would serve as a participant. As you might expect, if anyone knows beforehand what the experiment is about, it could bias the
results. We would appreciate, then, your not telling anyone about this experiment. One other thing. We are not interested in individual performance. Be assured, your performance in this experiment will not affect your performance in NC State University at any time.
Finally, you will be invited to view the results and receive a more detailed debriefing after the experimentation is completed.