Abstract
Sudhakaran, Sunil. Effect of personality type on performance of an overhead task. (Under the direction of Dr. Mirka)
Individual factors are becoming increasingly more prevalent in studies that
explore occupational musculoskeletal injury/illness. Empirical and theoretical
evidence supports further research into the role of individual differences in
psychosocial attributes in the occupational exposure, especially the injury outcome
process and potential mechanisms that may be at work. The goal of the current work
was to understand whether certain individuals may place themselves at risk by taking
infrequent breaks (i.e. working through pain or fatigue) if they are given the freedom
to decide the work pace and work-rest schedule. The hypothesis is that individuals
with certain personality characteristics like type A maybe at higher risk due to their
choice of less frequent breaks and a fast paced approach to work just to get the job
done as compared to type B personality. This hypothesis is based on the inherent
time-urgency characteristic of type A individuals.
Sixteen subjects (8 of each personality type) were asked to perform a 40 cycle
overhead assembly work involving running nuts onto bolts located on an overhead
board. The whole 40 cycle session was self paced and subjects had the freedom to
take as many breaks as they wanted and these breaks could be as long as they wanted.
The results showed that there was no significant effect of personality type on the task
performance variables- total cycle time, total break time, average break time, average
results were not consistent with the theory which supported the fast working of type
As based on their time-urgency characteristic. Although no previous studies have
looked at an overhead assembly task, the results of this study were consistent with
other recent studies in our laboratory showing no performance effects of personality
Effect of personality type on performance of an overhead task
By
Sunil Sudhakaran
A thesis submitted to the Graduate Faculty of North Carolina State University in partial fulfillment of the requirements for the Degree of Master of Science
INDUSTRIAL ENGINEERING Raleigh, North Carolina
2003
APPROVED BY:
_____________________ ______________________
Dr. Nelson Couch, PhD Dr. Hester Lipscomb, PhD
_________________________ Dr. Gary A. Mirka, PhD
Dedication
I had never imagined myself graduating with a master’s degree from the United States
of America when I started my academic pursuit. But today when I look back at all
those years of effort and determination, I see that the values and the confidence
induced in me by my family, especially my parents, was very influential in where I
have reached today. I have realized slowly but surely, especially during the past two
years that one really needs the support and love of one’s family to sail through these
trying times. For all that my parents have gone through for my education and their
relentless support for me to pursue higher studies; I hereby dedicate my thesis work to
my parents- Sudhakaran and Chandramathy. I hope that by earning a masters degree
in an area that always interested me but could not pursue in India, I have reached my
educational potential and in a way fulfilled all my parent’s dreams and aspirations. I
am sure that this dedication in no way reflects the true appreciation and love I have
for my parents for all that they have done for me. I hope that I have made them proud
Biography
Sunil Sudhakaran is the second of the two sons to Sudhakaran and Chandramathy. His
parents moved to Mumbai, India in the late 1960s from the small southern beautiful
Indian state of Kerela. They now live in Mumbai with their first son Sudhir and his
family. After completing his four year diploma in Production engineering, Sunil got
admitted to one of the finest engineering institution in Mumbai, Veermata Jijabai
Technological Institute (V.J.T.I.). After earning his bachelor degree in Production
engineering from V.J.T.I in 1999, he worked for one year for a tractor manufacturing
company, primarily doing materials management and vendor development. He then
worked for a small valve manufacturing company as a product engineer, designing
plastic parts and injection molding dies. He decided to pursue his masters in Industrial
Engineering from North Carolina State University with specialization in physical
ergonomics which seemed to be his area of interest. While working towards his
masters starting fall 2001, he had the privilege to work with Dr. Sommerich for 2
semesters on the computer usage study she was involved with. During the summer of
2002, he gained great insights in the practical application of physical ergonomics
while working for BMW manufacturing Corp. at Spartanburg, South Carolina. The
following 2 semesters he was honored to work with Dr. Mirka at NCSU ergo
Acknowledgements
One of the things you realize while working on your thesis is that it is almost
impossible to do it unless you are really motivated and interested. You also need the
right guidance and help to find the topic you find most interesting. I found that
without my advisor and my role model - Dr. Gary Mirka, I could have never
completed this thesis. I would really like to thank him from the bottom of my heart for
all the optimism and patience he has shown during this whole time. He has shown
immense confidence in my ideas (which have even surprised me occasionally) and I
have also learned a lot more than just ergonomics theories from him. I would also like
to thanks the other committee members, Dr. Nelson Couch and Dr. Hester Lipscomb
for their support and help. I would like to thank my friend and senior colleague Naomi
Glasscock who has shared important findings from her study. I would also like to
thank my fellow students and friends, Karen Noack, David Brandenburg, and
Gwansoeb Shin for their friendship and support. Finally I would like to thank my
family especially my parents, my brother Sudhir and my sister-in-law Jeena for their
Table of Contents
List of Figures………..vii
List of Tables………...viii
1.0 Introduction to ergonomics... 1
1.1 Musculoskeletal Disorders ... 3
1.1.1 Back disorders ... 3
1.1.2 Upper extremity disorders (Hand, wrist and shoulder) ... 4
1.2 Epidemiology for MSD... 5
1.2.1 Incident rates... 5
1.2.2 Cost to the industry... 5
1.2.3 Epidemiology for shoulder MSDs... 6
1.3 The shoulder... 8
1.3.1 Anatomy of the shoulder ... 8
1.3.2 Biomechanics of the shoulder... 12
1.3.3 Shoulder disorders ... 13
1.4 Physical risk factors ... 15
1.4.1 Overhead work and fatigue ... 19
1.5 MSD and non-physical risk factors... 21
1.5.1 General non-physical risk factors... 21
1.5.2 Type A personality ... 23
1.5.3 Personality and workstyle: ... 25
1.5.4 Contribution to injury/illness... 26
1.6 Specific aim of this study ... 27
1.6.1 Hypotheses... 28
2. Methods... 29
2.1 Participants ... 29
2.2 Experimental design... 30
2.2.1 Independent variables ... 30
2.2.2 Dependent variables ... 30
2.2.3 Experimental design model ... 32
2.3 Instruments ... 32
2.3.1 Survey... 32
2.3.2 Experimental Apparatus ... 33
2.4 Experimental procedures... 35
2.4.1 Phase I: Prescreening... 35
2.4.2 Phase II: Overhead assembly task ... 35
2.4.3 Introduction and training ... 37
2.5 Data processing ... 39
2.6 Statistical Data Analysis... 40
2.6.1 ANOVA Assumptions... 40
2.6.2 ANOVA... 41
3. Results... 41
3.1 Testing ANOVA assumptions... 41
3.2 ANOVA results ... 42
3.3 Individual work pattern ... 43
4.0 Discussion... 46
4.1 Limitations... 50
4.2 Future research ... 52
5.0 Conclusion ... 53
References... 54
Appendix A: Jenkins Activity Survey... 64
Appendix B: Informed consent form Phase I... 72
Appendix C: Informed consent form Phase II... 74
Appendix D: Visual Analogue Scale (VAS)... 76
Appendix E: Normal plots of residuals... 77
List of Figures
Figure 1 Shoulder anatomy... 8
Figure 2 Setup of the apparatus ... 34
Figure 3 Wooden board ... 34
Figure 4 Trays for nuts and bolts ... 35
Figure 5 Height adjustment posture... 36
Figure 6 Working overhead posture ... 39
List of Tables
Table 1 Anthropometric data ... 30
Table 2 Normality & Homogeneity tests ... 41
Table 3 ANOVA results for the whole model (all 16 subjects)... 42
1.0 Introduction to ergonomics
Although the science and practice of ergonomics go back to the early 1900s, it
is only in its seventh decade of identifiable professional existence. Professional
ergonomists now work on a wide variety of systems, ranging from simple hand tools
to highly complex equipment, software and interfaces. Professor Brian Shackel, the
International Ergonomics Association (IEA) historian, has followed the focus of
ergonomics from the 1950s to the 1990s and how it has shifted from military
ergonomics (in early 1950s) to computer and cognitive ergonomics (in late 1990s),
and their application to industrial systems (Hendrick, 1993). Derived from the Greek
ergon (work) and nomos (laws) to denote the science of work, ergonomics is a study
of human-machine systems and is now applied to almost all aspects of human
behavior.
Ergonomics (or human factors) is the scientific discipline concerned with the
understanding of the interactions among humans and other elements of a system. It is
the profession that applies human knowledge collected through research to design
complex systems so as to ensure human well being and optimize overall system
performance.
Ergonomics is a science concerned with developing knowledge about human
behavior, their limitations, and other characteristics which helps to design system
interfaces. As a practice, ergonomics applies this knowledge of human-system
life in general. Within the discipline, there are various domains of specialization
which represent different areas, namely physical, cognitive and organizational
ergonomics.
Cognitive ergonomics deals more with mental processes, such as perception,
memory, reasoning, and motor response, and how they affect interactions among
humans and other components of a system. The areas within cognitive ergonomics
include mental workload, decision-making, skilled performance, human-computer
interaction, and training. Organizational ergonomics deals with the optimization of
sociotechnical systems, including their organizational structures, policies, and
processes. The topics covered under this area include work design, design of
working times, teamwork, participatory design, community ergonomics,
cooperative work, organizational culture, telework, and quality management.
Physical ergonomics deals more with human anatomical, anthropometric,
physiological and biomechanical characteristics and how these interact with each
other to represent physical activity. The areas within physical ergonomics which
are studied include working postures, materials handling, repetitive movements,
work-related musculoskeletal disorders, workplace layout, safety and health. The
prevention of work related illness/injury is a primary focus in this discipline and
issues related to this topic form the foundation of the current study which is
1.1 Musculoskeletal Disorders
The U. S. Department of Labor defines a musculoskeletal disorder (MSD) as
an injury or disorder of the muscles, nerves, tendons, joints, cartilage, and spinal discs
and typically does not include injuries or disorders caused by slips, trips, falls, or
similar accidents. The two basic types of injuries are acute injuries and chronic
injuries. Acute injuries are usually the result of a single, traumatic event
(macrotrauma). Acute injury usually occurs due to the result of a single load
exceeding the tolerance of a tissue or a body part. Common examples include wrist
fractures, ankle sprains, shoulder dislocations, and muscle strains. Chronic injuries on
the other hand are more subtle and usually occur over time. They are the result of
repetitive microtrauma to the tendons, bones and joints. Cumulative Trauma
Disorders (CTDs) are chronic injuries, which occur due to repetitive, submaximal
loads on a tissue or body part over a prolonged period of time. CTD is a collective
term for disorders characterized by discomfort, impairment, disability or persistent
pain of soft tissues. It can be caused or aggravated by repetitive motions including
vibrations, static and/or awkward postures, and forceful movements at work.
Common examples of CTDs include tennis elbow (lateral epicondylitis), carpal tunnel
syndrome and swimmer’s shoulder (rotator cuff tendinitis and impingement).
1.1.1 Back disorders
Back pain is one of the most common and significant musculoskeletal
Administration in their 1999 annual report reported that over 1 million workers are
affected by lower back pain. Back pain was also ranked second as the leading cause of
days away from work. According to the same report, low back disorders in the United
States costs more than $100 billion each year. An average claim of low back injury
costs $8,300, which is almost twice the average cost of all other types of claims
combined together.
The National Institute of Occupational Safety and Health (NIOSH) in 1998
summarized over 40 recent studies related to low-back musculoskeletal injuries to
find the various work related risk factors that contribute to lower back disorders.
According to the NIOSH report, the most significant risk factors associated with
lower-back injuries were job activities that required heavy lifting, and jobs that
exposed workers to whole body vibration. Awkward postures and heavy physical
work were also identified as risk factors in the report.
1.1.2 Upper extremity disorders (Hand, wrist and shoulder)
Work related MSDs for the upper extremity have been found to be right behind
lower back injuries for the number of lost days in the US according to OSHA’s annual
report in 1999. The disorders typically involved are hand, wrist and elbow problems
are non-specific hand and wrist pain followed by tendinitis, ganglion cysts, and carpal
tunnel syndrome. Research has found forcefulness, adverse posture, repetition or
continuous activity and duration of exposure as the major risk factors associated with
shoulder joint, a detailed description of anatomy, biomechanics, types of shoulder
disorders and their associated risk factors will be presented in subsequent sections.
1.2 Epidemiology for MSD
1.2.1 Incident rates
In the report by Department of Labor Bureau of Labor Statistics in 2000, over
577,800 musculoskeletal disorders cases were reported involving days away from
work. The report also states that although both total injuries and illnesses with days
away from work and MSDs have decreased since 1992, MSDs continue to account for
more than one in three of the total lost work time cases (Lost-work time injuries and
illnesses: characteristics and resulting time away from work, 2000, United States
Department of Labor Bureau of Labor Statistics)
1.2.2 Cost to the industry
Costs for work-related musculoskeletal disorders are difficult to estimate due
to various factors involved. Webster and Snook (1994) analyzed 1989 insurance
claims data from 45 states, looking only at upper extremity disorders and specifically
as cumulative trauma disorders. They estimated that the total compensable cost for
upper extremity disorders in the U.S. was $563 million in 1989. The National Institute
of Occupational Safety and Health (NIOSH) has estimated that the annual worker’s
compensation costs for neck and upper extremity disorders are over $2 billion, plus
$90 million in direct costs (NIOSH, 1996). In a study in Australia estimating the cost
leading cause of health system expenditures, with an estimated total expenditure of
$3,002 million in 1993–94. In similar study in Britain looking at workplace accidents
and work-related ill health (1996), the costs associated with musculoskeletal disorders
affecting the lower back were between £315 million and £335 million.
1.2.3 Epidemiology for shoulder MSDs
Upper extremity musculoskeletal injuries or disorders pose a significant
concern to today’s industry, both in terms of cost and suffering. The information or
knowledge of risk factors for shoulder disorders is based on epidemiological studies
in the field and experimental studies in the laboratory. Epidemiological studies have
typically investigated the associations between physical factors such as load, duration
etc and clinically defined shoulder disorders such as shoulder tendinitis. Herberts et
al. (1984) in their study of employees at a shipping company found that the welders,
primarily doing manual labor, had a prevalence of 18.3% for supraspinatus tendonitis
as compared to 2% for clerks doing office work. Grocery store checkers (15%) were
reported to have a higher prevalence of rotator cuff tendinitis than non checkers (4%)
in the health hazard evaluation report by Baron et al. (1990). Prevalence of humeral
tendinitis was found to be 9.2% among assembly line packers as compared to 3.8%
among shop assistants in a cross-sectional study by Luopajarvi et al. (1979). Wells et
al. (1983) in their cross sectional study found a significant prevalence of shoulder
study in a forest industry company, found that physically heavy work load and mental
overload were associated with severe shoulder pain.
Apart from these epidemiological studies, only rarely have we seen direct
measurements been used to estimate exposure or outcome. This implies that the
information we have so far on physical load factors are crude and may even have bias
(because of its subjective nature). The severity of upper extremity disorders is
influenced not only by biomechanical factors, but also by other work organizational
factors, the worker’s perception of the work environment, and individual factors
(Bradley & Rempel, 1996). The etiology of the cumulative trauma disorders is
complex and may include various factors from the occupational work, workplace, and
worker as well as non-occupational factors. Occupational tasks that require high
force, high repetition and awkward postures increase the chances of getting injured,
1.3 The shoulder
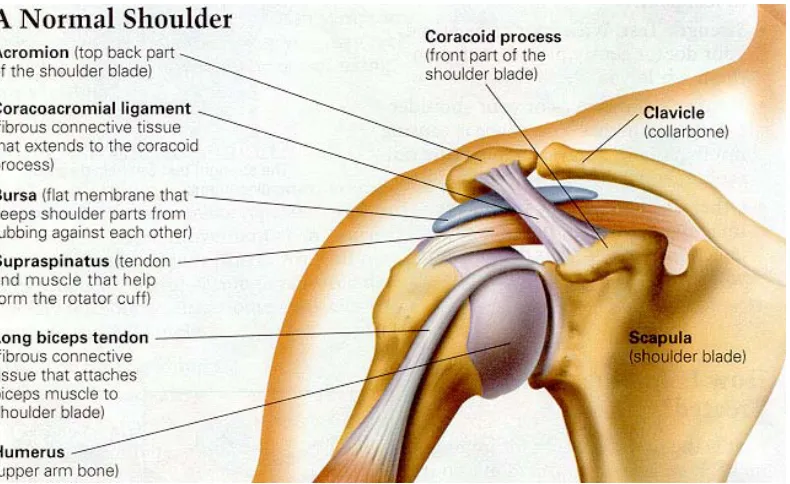
1.3.1 Anatomy of the shoulder
Figure 1 Shoulder anatomy
Adapted with permission from http://www.ortho-md.com
The shoulder is a complex system of bones, muscles, tendons, and ligament
that attach the upper extremity to the torso. The primary function of the shoulder is to
direct and support the hand activities.
1.3.1.1 Bones
The three bones involved in the shoulder are the scapula, the humerus, and the
clavicle. The clavicle is attached to the acromion in the upper lateral aspect of the
shoulder, and the other end attaches to the sternum. The scapula covers part of the
the acromioclavicular joint. Each of the above joints can act individually but total
shoulder movement is the sum of the movement of the movement contributed by all
the above joints (Inman & Lucas, 1957).
The sternoclavicular joint: It is the joint where the clavicle articulates with
respect to the manubrium of sternum. The sternoclavicular joint displays three degrees
of freedom whose movement axes are in the sagittal plane and frontal planes as well
as along the bone axis of the clavicle. The elevation of the clavicle is limited by the
lower portion of the sternoclavicular joint and the costoclavicular ligament (Inman &
Lucas, 1957, Kent, 1971).
The acromioclavicular joint: This is an articulation between the acromial end
of the clavicle and the acromion of the scapula and surrounded by a fibrous capsule.
The joint receives its stability and integrity from various ligaments rather than mating
surfaces of the bones. Although not well defined, the acromioclavicular joint can have
three degrees of freedom motion and types of movements are usually defined with
respect to the scapula (Inman & Lucas, 1957, Kent, 1971).
The Glenohumeral joint: This is a ball and socket joint between the glenoid
fossa of the scapula and the head of the humerus. The contact area between the two
articulating surfaces is small because the glenoid cavity has a much smaller surface
area as compared to the humerus head. A joint capsule consisting mainly of the
glenohumeral ligaments provides a loose sleeve around the joint. It is at this joint that
1.3.1.2 Muscles
The stability and mobility of the shoulder are maintained by three major groups
of muscles as listed below (Ali, 1979):
• The scapulohumeral group (those passing from the scapula to the humerus)
which consist of the supraspinatus, infraspinatus, teres minor, subscapularis,
deltoid and teres major.
• The axioscapular group (those passing from the torso to the scapula) which
consist of the trapezius, rhomboids, serratus anterior, and levator scapulae.
• The axiohumeral group (those passing from the torso to the humerus) consist of
pectoralis major, pectoralis minor and lattissimus dorsi.
The muscles acting on the humerus to elevate the arm are the biceps brachii,
the supraspinatus, the deltoid and the short rotator cuff consisting of the infraspinatus,
the teres minor and the subscapularis (Inman & Lucas, 1957, Peat, 1986).
Biceps brachii: this is the least important of the elevator groups and acts as an
abductor only under certain conditions. In its normal position it can exert practically
no effective force to abduct the arm. However if the humerus is externally rotated 90
degrees, then it can act as a pulley mechanism to abduct the arm (Inman & Lucas,
1957).
The supraspinatus: this muscle is similar in its pulley mechanism as is the biceps. It
originates above the spine of the scapula with its tendinous insertion on the greater
during abduction have shown that it contracts progressively throughout the entire
phase of abduction with maximal activity at 100 degrees of abduction (Inman &
Lucas, 1957).
The deltoid and the rotator cuff: The deltoid and its association with the rotator cuff is
the most important mechanism for arm abduction. The direction of the deltoid’s pull
on the humerus is upward and outward. The contraction of the deltoid does not cause
the arm to swing out into abduction but only results in the humeral head being forced
against the acromion. If the action of the deltoid is combined with the short rotator
muscles (subscapularis, infraspinatus and teres minor), abduction is easily
accomplished. The rotation is produced through the forces acting in two opposite
directions. The upward and downward pulls of the deltoid and the short rotators,
respectively, cancel out each other and allow for free rotation when the two sets of
muscles act through the force couple mechanism. Both these muscle groups have been
found to be acting continuously throughout the motion of abduction. They reach
maximal activity between 120 and 140 degrees of abduction (Inman & Lucas, 1957).
The second group of muscles necessary for elevation of the arm are those that
act on the scapula to produce the 60 degrees of outward motion of the scapula needed
to complete the full range of humeral abduction. Outward rotation of the scapula is
accomplished by two muscles: the trapezius and the serratus anterior. Because the
scapula is fixed to the clavicle at the anterior edge of the acromion, the scapula must
scapula outward, while the lower trapezius pulls downward on the lower scapular
spine, continuing the rotation. Finally the serratus anterior, by pulling forward on the
scapula, gives additional force for the movement (Kent, 1971).
1.3.1.3 Nerves and blood vessels:
The nerves and blood vessels that run into the arm and hand start at the side
of the neck. They exit from the side of the spine through small openings between
each vertebra called foramen. As they leave the spine, the nerves are referred to as
nerve roots. The individual spinal nerve roots then begin to join together to form
the nerves that will run into the arm and hand. The nerves travel between two
muscles in the neck (the scalene muscles), over the top of the rib cage, under the
collar bone (clavicle), through the armpit (axilla) and down the arm to the hand.
The subclavian blood vessels have a similar route from the torso to the hand
through the shoulder.
The nerves and vessels come together in the shoulder region to form a
neurovascular bundle. This neurovascular bundle consists of the nerves (brachial
plexus) and blood vessels (subclavian vessels) which pass from the cervical area
towards the armpit.
1.3.2 Biomechanics of the shoulder
The elevation of the arm consist primarily of two phases – first the movement
on the scapula again (Dvir & Berme, 1978). All of these above said motions occur
almost simultaneously and this synchronous motion of the scapula and humeral
components of shoulder is called the scapulohumeral rhythm. Kent (1971) state that
the scapulohumeral rhythm proceeds as follows: After an original period of
stabilization, each 15 degrees of abduction of the arm consists of 10 degrees of
abduction at the glenohumeral joint and 5 degrees outward rotation of the scapula.
These movements occur simultaneously producing a smooth rhythmic motion. Thus
in 180 degrees elevation of the arm, 120 degrees occur at the glenohumeral joint, and
60 degrees through outward rotation of the scapula. The total of 60 degrees of
scapular rotation is achieved through 30 degrees elevation of the clavicle at the
sternoclavicular joint and remaining 30 degrees at the acromioclavicular joint. Axial
rotation of 50 degrees of the clavicle along its axis is an important factor in this
mechanism.
1.3.3 Shoulder disorders
1.3.3.1 Thoracic outlet syndrome (TOS)
Thoracic outlet syndrome (TOS) is a disorder that affects the nerves in the
brachial plexus (nerves that pass into the arms from the neck) and various nerves and
blood vessels between the neck muscles and axilla (armpit). In the thoracic outlet
syndrome, the nerves and vessels of the neurovascular bundle are compressed at the
thoracic outlet area. Symptoms of TOS include pain, weakness, numbness and
wrist. Elevated arm postures, work requiring pulling the shoulders down (carrying
load on shoulder) and poor postures are some of the risk factors associated with TOS.
Sommerich et al. (1993) stated that while working with an overhead posture, the
pectoralis minor muscle or the scalene muscles of the neck may pinch the nerves and
blood vessels which are beneath these muscles.
1.3.3.2 Occupational muscle pain
Hagberg (1987) defines occupational muscle pain or tension neck or
myofascial syndrome as the pain in the shoulder area with tenderness to the lower part
of the trapezius muscle. There may a variety of possible mechanism leading to
occupational muscle pain such as mechanical trauma, fatigue, metabolic alterations
and myofascial pain (Edwards, 1988). Edwards (1988) suggested in his study of the
pathology of occupational muscle pain that pain during work may be associated with
impaired muscle energy metabolism or fatigue. This impaired muscle energy
metabolism or fatigue may be due to the lack of blood flow to the shoulder and neck
region. Research has shown that the intramuscular pressure shows a linear increase
with increasing abduction or flexion angle (Sigholm et al., 1984). In the supraspinatus
region, a flexion or abduction angle of more than 30 degrees is enough to raise the
intramuscular pressure above the level where muscle blood flow is impeded
(Viikari-Juntura, 1996). This impairment of the blood flow may produce local ischemia and
1.3.3.3 Shoulder impingement syndrome
Shoulder impingement syndrome is caused by compression of the tendons of
the rotator cuff between the acromion process (a part of the shoulder blade) and the
head of the humerus. As the humerus is rotated while elevating the arm, it tends to
pinch the tendons of the rotator cuff between the humerus head and the acromion.
This could lead to tearing the rotator cuff tendons and pain. Some of the common risk
factors for shoulder impingement syndrome are prolonged work at or above shoulder
level, static positions or postures especially prolonged abduction of the arm.
1.4 Physical risk factors
Based on epidemiological and experimental evidence, the following work-related
physical risk factors for shoulder disorders have been identified:
1. Heavy physical work: Many studies have shown an association between heavy
physical work and shoulder injury/pain. One study by Stenlund et al. (1992),
which investigated workers with exposure to heavy physical work from 10 to
28 years observed an increase risk due to cumulative exposure to manual work.
Heavy physical work generally involves manual handling of heavy loads,
non-neutral trunk postures, and elevated postures of the arm.
2. Manual handling: Manual handling activities generate high loads on all
shoulder structures. Many studies which looked at the rotator cuff muscles and
the deltoid have found a increase risk of cumulative trauma due to manual
3. Elevated postures of arm: According to Eira Viikari-Juntura (1992), there is
some epidemiological evidence that supports the association between elevated
arm postures and shoulder pain (Bjelle et al., 1979; Sakakibara et al., 1995) as
well as supraspinatus tendinitis (Herberts et al., 1981). The occupations
investigated in these studies were orchard farmers and shipyard welders. Other
studies have shown that the activity of the shoulder muscles increases with
increasing elevation of the arm (Sigholm et al., 1984). A flexion angle of ≥30◦
without any hand load increases the intramuscular pressure level to the extent
of blood circulation disturbances (Sigholm et al. 1984). After long hours of
extensive shoulder exercise the neuromuscular recovery may be incomplete for
hours (Mathiassen, 1993). Elevate arm postures may also be associated with
mechanical irritation of the rotator cuff tendons.
The results from one study done on welders showed that suspending the arm
may reduce the shoulder muscle load but the intramuscular pressure of the
supraspinatus remains at a level where the blood flow to the shoulder muscles
is still compromised (Jarvholm et al., 1991).
4. Non-neutral trunk postures: Viikari-Juntura (1992) states that Schuldt et al.
(1987) investigated the myoelectrical activity of the neck and shoulder muscles
in different postures doing simulated soldering work in the laboratory. They
found that sitting with the spine slightly tilted backward and the cervical spine
the whole spine flexed was associated with the highest activity. These findings
suggest that non-neutral trunk postures may influence the shoulder muscles and
their risk in more than one way.
5. Static postures: This is defined as tasks which require workers to sustain
positions for long periods of time. One field study done by Herberts et al.
(1984) on shipyard welders with an earlier onset of supraspinatus tendinitis,
and comparing with plate workers in the same company found that the
prevalence of supraspinatus tendinitis was similar in the two groups. The
average age for welders was 6 years less than that of the plate workers. While
both the jobs were classified and rated in high physical workload by the
workers, welding was described as more of a static job as compared to plate
workers who had a more dynamic task.
Another study by Burt et al. (1990) looked at upper extremity CTDs at a major
newspaper company. They found an 11% prevalence of shoulder symptoms in
their study. These symptoms were associated with the percentage of time spent
typing at computer terminals which means static postures for extended periods
of time.
6. Repetitive work: This had been one of the prime risk factor for MSDs of the
upper extremities. Sommerich et al. (1993) state that Hagberg and Wegman
(1987) who summarized the results of various epidemiological studies on
disorders found the odds ratio to be 4.0 for having exposed to repetitive arm
movements. Cash register operators and assembly line workers and packers
were classified as being exposed to highly repetitive arm movements.
An experimental study done by Putz-Anderson and Galinsky (1993) used
psychophysical approach to investigate the effects of various repetition rates,
forces, tool weights and reach heights on work durations until a subjectively
rated fatigue was reported in repeated flexions of the arm. The repetition rate
was the prime determinant for work duration, followed by force, height of
target and tool weight.
7. Lack of pauses: Sommerich et al. (1993) summarized findings of recent
epidemiological, laboratory and field studies conducted in order to identify
occupational risk factors for cumulative trauma disorders of the shoulder
region. They identified lack of rest pauses as one of the risk factors associated
with shoulder pain. The authors state that Burt et al. (1990) found in their study
of shoulder pain in newspaper employees, that cases on average took fewer
work breaks than non-cases. Kvarnstrom (1983) investigating assembly
workers reported a prevalence ratio of 5.2, as compared to 0.7 for serial
assemblers in the same company doing the same task. The only difference was
that, as a part of the assembly process, serial assemblers also collected parts
and read instructions which allowed their muscles to relax. The assembly line
cycle. In some studies, rest pauses, even in the form of small or micro breaks,
was found to be important. Kilbom and Persson (1987) followed two groups of
female employees who performed short cycle tasks. They found that the
percentage of the work cycle which the workers spent resting (micro-breaks)
was inversely related to the occurrence of tendinitis and myofacial syndrome in
the second year of employment. It is interesting to note that this data did not
appear in the first year of follow-up.
8. Vibration: An exposure-response relationship between cumulative exposure to
vibration and shoulder tendinitis have been observed in a study done by
Stenlund et al. (1993). The assessment of cumulative exposure took into
consideration the hours that each vibrating tool had been used.
9. Draft: Only some epidemiological evidence exits for the association of air
velocities and shoulder or neck pain. The behavior of shoulder muscles was
studied in an experiment with different air velocities in an office environment
(Tola et al., 1988). The myoelectrical activity changes suggests an increased
recruitment of motor units in some muscles and a cooling effect due to
increases air velocity in other muscle regions.
1.4.1 Overhead work and fatigue
Out of all the physical risk factors identified above, an overhead work posture
is most important risk factor relevant to this study. It is very important to understand
during overhead work. Also the fact that fatigue can be one of the most detrimental
factors for taking breaks during overhead static postures makes the following
discussion imperative.
When a skeletal muscle fails to maintain a required force of contraction it is
fatigued. In Bjelle et. Al (1979) study of industrial workers, it was found that work
positions demanding elevated arm in manual work were a significant factor in
noninflammatory prolonged shoulder-neck disorders. One study by Hagberg (1981)
determined which muscles in the elevated arm position are likely to develop
electromyographic signs of muscle fatigue and how fast these signs develop. He
found that the supraspinatus muscle was the first to show signs of electromyographic
fatigue and started within a fraction of a minute in the arm elevated position. He states
that the reason for the supraspinatus muscle to be the first to show signs of fatigue is
not only the fact that it is the most important stabilizer but also due to constant
traction on its tendon. This traction may cause an impairment of the nutrition and
circulation of the tendon which highly accelerates the fatiguing process. The upper
trapezius also showed signs of fatigue during the first 5 minutes in the elevated arm
position.
During static contractions, such as in overhead work, intramuscular pressure is
reported to increase in proportion to the force of contraction. This increase in
intramuscular pressure may be of such magnitude as to impair or impede or even
in turn cause muscle fatigue and thus limit the time for which the contraction can be
maintained.
1.5 MSD and non-physical risk factors
1.5.1 General non-physical risk factors
In addition to the physical and task related factors which were discussed
earlier, risk of developing MSD/CTD has also been shown to increase due to certain
personal factors such as age, gender, personality etc. But these individual risk factors
may contribute indirectly to the etiology of MSDs rather than contributing directly to
the risk of developing MSD/CTD. In other words, individual factors like behavior,
work pattern etc may manifest themselves and cause the individual to behave in a
certain way such that they exhibit physical work characteristics which have been
previous identified as physical risk factors for MSDs. Lack of social support and
outcome of cumulative trauma disorder has been shown to have a positive relationship
in many studies (Moon & Sauter, 1996). A comprehensive and systematic review of
the literature to identify the most important psychosocial factor by Ariens et al. (2001)
suggest that there is some evidence that there is a positive relationship between neck
pain and high quantitative job demands, poor social support, low job control, low skill
discretion and low job satisfaction. They also found in conclusive evidence of
relationship between neck pain and poor supervisor support, conflicts at work, low job
security and limited rest break opportunities. Ariens et al. (2001) state that Bergqvist
relationship between “limited rest break opportunities” and neck pain. A review of
literature on psychosocial factors effecting neck and shoulder disorders by Bongers et
al. (1993), reported a positive relationship between psychosocial variables such as
monotonous work, time pressure and high work load. They also state that combination
of lack of social support and physical load at work increase the prevalence of neck or
shoulder symptoms.
The way that psychosocial factors contribute to the occupational injury is still
ambiguous. Most of the previous studies focused primarily on the psychosocial work
factors like work load, job satisfaction, and social support. It seems very plausible that
some or most of these psychosocial factors may be affected or related to various
individual trait characteristics such as personality type, coping style, etc. The
approach that each person takes to perform a task may be influenced by a number of
individual factors such as personality, work-style, etc. These individual trait
characteristics have been studied and investigated quite frequently in the past. But the
results of findings have been very often ambiguous and contradictory.
A number of questions regarding these individual factors still remain
unanswered. How does each of these individual factors contribute to the injury
process? And do any of the individual factors (like personality traits) have any
indirect influence on any of the physical factor identified to be potential risk factors
for MSDs? The specific characteristic explored in the current study is personality type
1.5.2 Type A personality
Type A behavior is defined by Friedman & Rosenman (1974) as a behavior
that can be observed in any person who is constantly struggling to achieve more and
more in less and less time, and in order to achieve more, even go to the extent of
opposing others. These people or individuals were also referred to this type of
behavior as “coronary-prone behavior pattern” when this concept was introduced in
the late 1950s. Competitiveness, ambition, high performance standards, hurried motor
and speech patterns, aggressiveness, time urgency, and impatience are some of the
characteristics of a typical type A individual (Dembroski et.al, 1979; Gastorf, 1981;
Hart & Jamieson, 1983, Jenkins et.al., 1967; Jenkins et.al., 1971; Lambert et.al., 1987;
Price, 1982).
Some researchers have found that type A individuals experience more frequent
tense, hyperactive movements, vigorous voice and psychomotor mannerisms,
restlessness, alertness, a general appearance of tension and restless motor
mannerisms. (Sparacino,1979; Dembroski et al., 1979; Jenkins et al., 1971; Jamal,
1985; Jenkins et al., 1967). Bingham and Hailey (1989) state that Gastrof (1980)
found that type A’s arrived for appointments much earlier than the scheduled time as
compared to type B’s. Yarold and Grimm (1982) found that Type A’s completed
questionnaires more quickly than type B’s. All these social interactions can all be
interpreted as being the result of type As being impatient and/or being in a hurry
The implications of personality type on work related musculoskeletal disorders
has also been considered in various studies. Malchaire et al. (2001) reviewed and
summarized all epidemiological studies done in the past 15 years relating to various
risk factors associated with musculoskeletal disorders or complaints of the neck and
upper limbs. They found a few studies (Bru et al., 1993; Flodmark & Aase, 1992;
Salminen et al., 1991) where there was a greater incidence of neck-shoulder disorders
for type A personality individuals. These studies indicate a positive association
between neck-shoulder disorder and personality type and there is a definite need for
more investigation in the relationship between neck-shoulder disorder and personality
type. Since it can be assumed that personality type remains stable over time (as
compared to other psychosocial factors), understanding the possible contribution of
personality type on the occupational injury-proneness can be very beneficial and
insightful.
The theory that type A individuals negatively impact their social support can
be supported by the study done by Burke (1984), in which he concludes that although
type A individuals invest more of themselves in their jobs, they are not necessarily
more satisfied with their jobs and may be even at the risk of personal and social
alienation and disappointment. He also suggests that type A men may have less
satisfying and successful marriages and have few intimate friendships. This type of
social behavior and interaction can be attributed to some of the type A characteristics
there was a potential biomechanical pathway associated with psychosocial stress and
that, certain individual factors like gender and personality traits may actually increase
the stress effect. One of the other findings of this study was the fact that personality
traits may be responsible for spine loading differences due to stress. Different
personality types responded to psychosocial stress in very different ways. Because
people having different personality traits respond differently to psychosocial stress, a
physical task or job may be more stressful to one personality type than another, thus
increasing the lower back disorder risk. All these findings collectively suggest that
there might be some complex relationship between stress and personality type, and
how individual factors influence one’s risk of developing MSDs.
1.5.3 Personality and workstyle:
Based on the discussion in the earlier section about type A behavior pattern,
type A individuals are likely to approach their work very differently in terms of
postures, technique, movement, etc. Jamal (1985) state that type A’s, in their general
approach to work, put more effort in their work activities than do type B’s. Jamal also
state from Glass (1977) that type A’s prefer to be in control of their environment,
which brings out type A behavioral characteristics that make people stress-prone (eg.,
time urgency, hostility towards slowness). All these findings and more indicate that
personality type may essentially affect workstyle and since workstyle determines how
you behave or perform a task (work-related risk factors), it might indirectly influence
1.5.4 Contribution to injury/illness
A lot of work has been done during the last 40 years looking at various
characteristics of type A personality behavior. The primary focus of most of these
studies was to discuss or investigate the association between type A personality and
coronary heart disease. And these studies have indicated that type A’s are more likely
to have heart attacks (Burke, 1984). Fields et al (1990) investigated and followed
forty runners to determine whether personality type makes them more prone to
injuries. They found that athletes who scored high on the type A Self Rating
Inventory (TASRI) (Blumenthal et al., 1985) had significantly more injuries and
multiple injuries than the type B’s. Gill, Henderson and Pargman (1995) suggest that
type A athletes may be at high risk of chronic injuries since they may ignore
symptoms of stress or injury that interfere with their performance.
More pertinent to the current work are studies that have considered
musculoskeletal effects significant to personality type. Glasscock et al. (1999) found
that personality type A individuals exhibit increased muscular antagonism as
compared to type B individuals. They suggest that this antagonist activity in type As
may be present to ensure that they perform the task to perfection. They also suggest
based on their results that since personality type has a direct affect on muscle
coactivation, it could directly impact the biomechanical loading of the tissues. This
linkage suggests that personality type may have a direct impact on the likelihood of
(2000) found in their study that personality and other individual traits may also play a
role in an individual’s susceptibility to MSD risk factors. In other words, they
potentially influence the biomechanical response to psychosocial stress which further
elevates the risk for developing MSDs. They found that some personality traits under
stressful conditions were responsible for increased spine loading, which increases
lower back disorder risk. Wickstrom et al. (1989) and Salminen et al. (1991) based on
their studies have suggested a positive relationships between type A behavior and
experience of back pain and neck/shoulder discomfort. Bongers et al. (1993) in their
review of studies done also state that some studies indicate a positive relationship
between type A behavior and back pain (Flodmark & Aase, 1992; Hagg et al., 1990).
1.6 Specific aim of this study
The time-urgency component of the type A behavior pattern may be very
critical in influencing how many breaks they take and their duration, while doing
occupational tasks. In other words, type As may not take enough breaks as compared
to type Bs while performing a job, demanding awkward and static postures, heavy
work, etc. This characteristic can be very detrimental, especially while carrying out
task requiring breaks to relax the muscles. The importance of taking appropriate rest
pauses and their influence on the risk of developing MSDs have been discussed in the
earlier section. Thus type A individuals can contribute to the pathology of MSD by
indirectly influencing the risk factors which are associated with it (MSDs). No studies
(due to static posture) and their approach to such a task given the freedom for taking
breaks or rest pauses. The effect of personality type on the general approach to this
kind of work and its influence on task performance and rest-work schedule will be the
primary focus of this study.
1.6.1 Hypotheses
Hypothesis 1: Type As will work faster than type Bs under painful conditions
The foundational literature regarding personality type would indicate that type As
would work faster than type Bs in general. But no studies have tried to look at their
work pattern or speed under painful condition. The hypothesis here is that even under
painful condition type As will continue to outperform type Bs in terms of speed. The
dependent variable important here is the average cycle time for completing a task.
The null hypothesis is that there is no difference in the average cycle time between the
type A and type B subjects and the alternative hypothesis is that the type B subjects
will have a longer cycle time.
Hypothesis 2: Type As will take fewer breaks than type Bs.
The time urgency characteristic of type As will make them take fewer breaks. In other
words, just to get the overall task done as soon as possible, type As will take fewer
breaks. The dependent variable important here is the number of breaks taken during
the work activity. The null hypothesis is that there is no difference in the number of
breaks between the type A and type B subjects and the alternative hypothesis is that
Hypothesis 3: Type As will take longer breaks than type Bs.
Since type As may take fewer breaks they would need longer rest pauses to get to a
steady pain level so that they can continue their task. Type Bs on the other hand will
take regular breaks thus keeping the duration of the breaks shorter as compared to
type As. The dependent variable important here average duration of the breaks. The
null hypothesis is that there is no difference in the average break time between the
type A and type B subjects and the alternative hypothesis is that the type B subjects
will have a shorter break time.
2. Methods
2.1 Participants
Males between the age of 18 and 26 were contacted through the use of fliers,
word of mouth and from classes/labs in the Department of Industrial Engineering
other departments across the campus. All interested candidates were prescreened by
the Jenkins Activity Survey (JAS) (please refer Appendix A and “survey” section for
details). A total of 25 male students took the JAS, from which 16 were selected for the
second phase of the study. Type As and type Bs were equally recruited (8 each) for
the 2nd phase. Second phase subjects were required to have no surgery or problems in
their neck and shoulder regions in the past or present. They also were required to have
no major physical disability especially motor skills or discomfort before doing the
experiment. Before starting either phase they were informed that they will be given a
the study they were required to sign a informed consent form, shown in Appendix B
& C. Some basic anthropometric data that were collected during the 2nd phase of the
study are listed below:
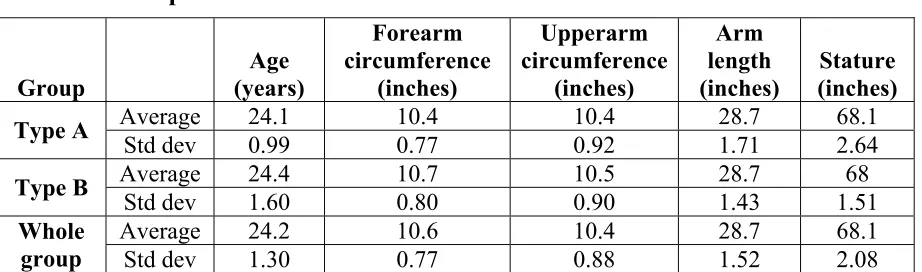
Table 1 Anthropometric data
Group Age (years) Forearm circumference (inches) Upperarm circumference (inches) Arm length (inches) Stature (inches)
Average 24.1 10.4 10.4 28.7 68.1
Type A
Std dev 0.99 0.77 0.92 1.71 2.64
Average 24.4 10.7 10.5 28.7 68
Type B
Std dev 1.60 0.80 0.90 1.43 1.51
Average 24.2 10.6 10.4 28.7 68.1
Whole
group Std dev 1.30 0.77 0.88 1.52 2.08
In addition to the anthropometric information listed in the above table, subjects
were asked about their exercise routine and if they considered themselves as someone
who is involved in active sports or works out in the gym at least 3 times a week.
2.2 Experimental design
2.2.1 Independent variables
Personality type was the independent variable for this study. This variable
consisted of two levels: type A and type B.
2.2.2 Dependent variables
Various dependent variables that were recorded/collected during the study are listed
below:
1. Total cycle time (in seconds): total time from the start of the session to the very
2. Total break time (in seconds): sum of all break times (time from the instant the
subject puts his hand all the way down after the end of a cycle to the instant
when he starts the next cycle) each subject took as a part of the total cycle
time. ∑ Break time
3. Average cycle time (in seconds): the average of the actual cycle time (Time
from the instant the subject starts a cycle to the instant when he ends the same
cycle) spent doing the task. (∑ Cycle time)/40
4. Average break time (in seconds): the average of the actual breaks each subject
took during the whole session based on number of breaks.
∑ Break time # of breaks
5. # of breaks: total number of breaks each subject took while performing the 40
cycles.
6. Average break for 39(in seconds): the average of the actual breaks each subject
took during the whole session based on total # of breaks he could have taken
(39). (∑ Break time)/39
7. Average pain scale at breaks (0 to 10): the average of the VAS pain scale
whenever the subject took a break. (∑
VAS reading before breaks)/# of breaks
8. Average pain scale (0 to 10): The average pain reported by each subject at the
The anthropometric data and exercise routine (yes or no) also served as covariates in
the exploratory analysis.
2.2.3 Experimental design model
The current study used the following statistical model:
Yij = µ + τi + εij; (i = 1-2, j = 1-16)
This model is a fixed effects model with τ being a fixed variable of personality type, 1
(A) or 2 (B).
2.3 Instruments
2.3.1 Survey
Personality type was assessed and determined using the modified student
version of the Jenkins Activity Survey (JAS) (Glasscock, PC; Jenkins et al., 1979).
The JAS is forced response survey containing 52 questions about behavioral
tendencies (see appendix A). The original survey was modified by Glasscock (1999
and Personal Communication) to include both the working class as well as the student
population. There are different scores which are generated using the JAS, but only
type A score was used for prescreening the participants for the second phase of the
study.
The scoring of personality type is on a scale, which goes from 0 percentile
representing the most type B to 100 percentile which is the most type A. The subjects
were selected from two extremes of the scoring scale in order to increase the
have scored less than 35 on the JAS percentile scale. The type A group consisted of
subjects who scored more than 65 on the JAS percentile scale.
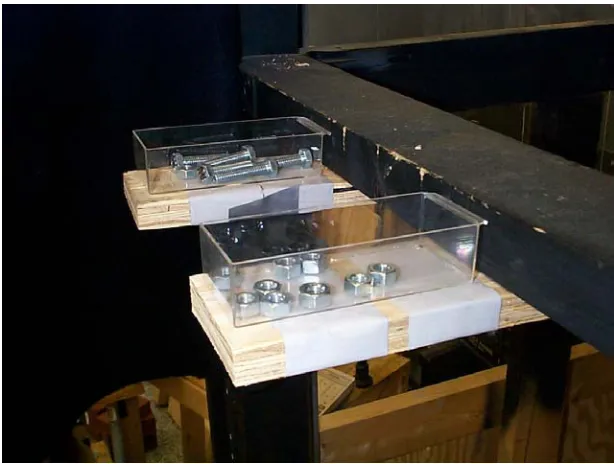
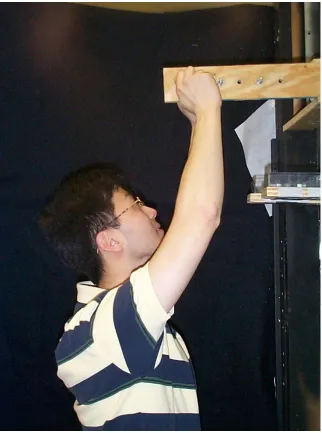
2.3.2 Experimental Apparatus
The 2nd phase task was an overhead assembly task consisting of screwing and
unscrewing three nuts onto bolts affixed to a wooden board. As shown in the Figure2,
the wooden board (Figure3) was mounted on a height adjustable wooden frame. The
setup also had two trays of bolts and nuts, right beside the wooden board, in case the
subjects dropped them while doing the task (please refer Figure 2 & 4). The wooden
frame also had a Visual Analog Scale (VAS) (refer appendix D) displayed close to the
wooden board for the subjects. The position of the VAS was adjusted for each subject
so that they can read it clearly while doing the task and without changing the neck
posture.
Stop watch was used to record the timings for the various dependent variables
listed in the previous section. All the subjects were video taped while performing the
task and this video data was used to analyze the break pattern and other time related
Figure 2 Setup of the apparatus
Figure 4 Trays for nuts and bolts 2.4 Experimental procedures
2.4.1 Phase I: Prescreening
Subjects who have communicated their interest in participating in the study were
asked to complete the Jenkins Activity Survey (JAS) (see Appendix A). Before filling
the survey they were instructed on how to fill out the survey and they had to sign the
informed consent form. Any questions regarding the survey were answered at this
point.
2.4.2 Phase II: Overhead assembly task
Upon arrival into the laboratory, the purpose of the experiment (Assessing work style
during an overhead work task) was briefly explained to the participants. The real
purpose and scope of the study were never disclosed to the subjects since it might
informed consent form. Those who wish to continue signed the informed consent
form (refer appendix C) and provided it to the investigator. Participants who wished
to retain a copy of the unsigned consent form were provided a copy to take with them.
Anthropometric measurements were then taken using anthropometer. The subjects
were then asked about their exercise routine and whether they would describe
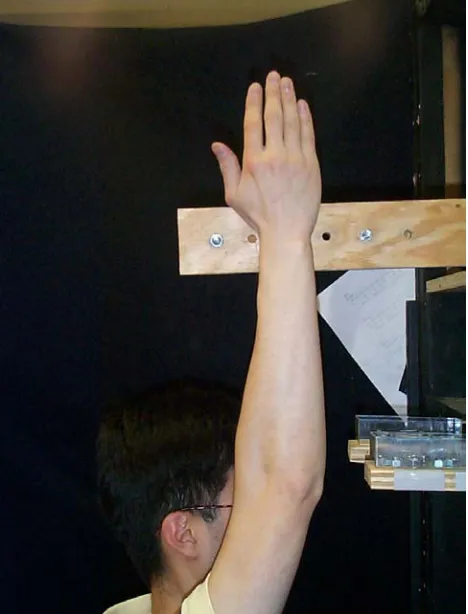
themselves as someone who goes to the gym regularly or plays sports. The height of
the board was adjusted by asking the subject to extend his arms directly overhead and
aligning the wooden board’s upper edge with the subject’s wrist (refer Figure 5).
2.4.3 Introduction and training
Introductory Script:
Today, you will be asked to a task that is similar to those seen throughout industry. It is important that you approach the task as you would if you were actually asked to perform the task in the workplace. You will be given specific instructions prior to beginning the task.
Task training: Prior to the actual data collection phase, subjects were introduced to
the tasks that they would be performing and asked to maintain a standard technique
throughout the experiment. The experimenter demonstrated the task to them and
introduced the VAS (refer appendix D) to the subjects. They were then asked to do 2
practice cycles to get used to the task and encouraged to any ask question regarding
the task.
Procedure script:
smaller breaks you take the sooner you will get done with the 40 cycles and will be relieved. I will give you a count down of the cycles remaining to complete the session after each cycle.
2.4.4 Description of the Assembly task
The task was an overhead assembly task (see Figure6) of screwing bolts onto a
wooden board. The height of the board was setup for each individual based on his
anthropometry as explained above. Subjects were instructed about the technique to be
used and were also be given a few practice trials before the actual task. They were
told to keep a consistent work technique throughout the session. Subjects were asked
to perform this task as if they are doing it for an 8 hr shift and they were told that they
could leave as soon as they finished the 40 cycles. One cycle represents unscrewing
bolts, screwing them in the next hole on the board, unscrewing them again and putting
them back in its original or initial position/hole. Data was collected after every
completed cycle during the task regarding their discomfort ratings on a Visual Analog
Figure 6 Working overhead posture 2.5 Data processing
Phase I:
All responses to the JAS questionnaire were entered into an excel spreadsheet and
text file. They were then processed by a computer data processing program to
database and depending on whether they qualified or not, subjects were contacted and
invited to participate in the second phase.
Phase II:
All dependent variables for each subject were entered into an excel spreadsheet.
These were then complied together into a text file with all relevant information. This
was then processed by SAS for ANOVA results.
2.6 Statistical Data Analysis
2.6.1 ANOVA Assumptions
Before analyzing the data, it is assumed that the residuals from the statistical model
are normally distributed (normality) and they have equal variances (homogeneity).
Also the independence or randomness of the data was assumed by random subject
selection and recruiting them as they responded to the JAS on a first-come-first-serve
basis.
The normality of the residuals was tested using the Shapiro-Wilk test and a graphical
assessment of the distribution of residuals. The homogeneity of the variances was
tested using the graphical assessment by plotting residuals versus the fitted value and
also Bartlett test (p ≤ 0.05). Test results of both of the assumptions of ANOVA are
2.6.2 ANOVA
ANOVA procedures were used to assess the impact personality type had on the
performance characteristics. An effect was said to be significant if the p value was
less than 0.05.
3. Results
3.1 Testing ANOVA assumptions
The normality of the data was tested by looking at the distribution of the residuals of
the responses (Table 2). Two of the residual responses had a p value of less than 0.05
which meant that the normality assumption of ANOVA was in question (refer table 2
for details).
Table 2 Normality & Homogeneity tests
Responses Shapiro-Wilk W Test Bartlett
W Prob<W F ratio Prob>F
Residual total cycle time 0.891196 0.059 0.5804 0.4462 Residual avg. cycle time 0.845292 0.011 3.7392 0.0532
Residual breaks 0.914584 0.14 1.2558 0.2624
Residual avg. break time 0.645152 <.0001 11.44 0.0007 Residual avg. break for 39 0.937947 0.322 0.0324 0.8571 Residual total break time 0.937959 0.322 0.0325 0.8568 Residual avg. pain scale 0.968454 0.7824 1.0978 0.2948 Residual avg. pain scale at breaks 0.907583 0.108 0.0738 0.7859
Looking at the residual average cycle time and the residual average break time
distribution (refer appendix E), one can see that both the distributions are skewed
because of one data point. Montgomery (1984) notes that moderate departures from
this assumption in the fixed effects analysis of variance and the procedure is quite
robust in this regard. Therefore the normality assumption was found not to be
violated in this dependent variable.
The graphical assessment of the homogeneity assumption for the residual
average break time which was found to be suspect using the Bartlett test, showed no
systematic trend in these variances (Appendix F) Since the plot does not show any
obvious pattern or trend, the homogeneity of variances assumption is upheld
(Montgomery, 1984).
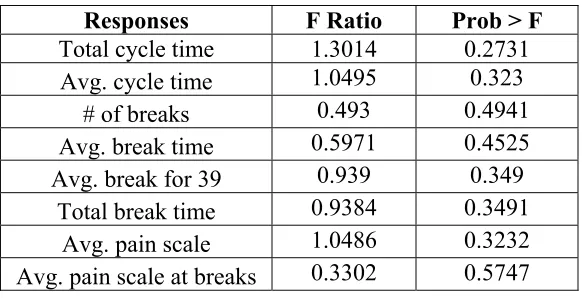
3.2 ANOVA results
After testing the ANOVA assumptions for normality and homogeneity, the ANOVA
was conducted for the whole model. The results of this analysis found that there was
no significance effect of personality type on task performance (refer table 3). The
means and the standard deviations for each of the dependent variables are also listed
in Table 4.
Table 3 ANOVA results for the whole model (all 16 subjects)
Responses F Ratio Prob > F Total cycle time 1.3014 0.2731
Avg. cycle time 1.0495 0.323
# of breaks 0.493 0.4941
Avg. break time 0.5971 0.4525
Avg. break for 39 0.939 0.349
Total break time 0.9384 0.3491
Avg. pain scale 1.0486 0.3232
Table 4 Means and std. deviation for all dependent variables
Responses Means Std Dev.
Type A Type B Type A Type B
Total cycle time (sec) 3175.63 3175.63 792.73 587.12
Avg. cycle time (sec) 58.50 53.38 12.86 5.82
# of breaks 28.13 23.88 9.23 14.42
Avg. break time (sec) 30.73 48.80 14.10 64.62
Avg. break for 39 (sec) 21.43 16.42 9.96 10.69
Total break time (sec) 835.63 640.38 388.64 417.08
Avg. pain scale 5.85 4.88 2.22 1.47
Avg. pain scale at breaks 6.32 5.63 2.55 2.29
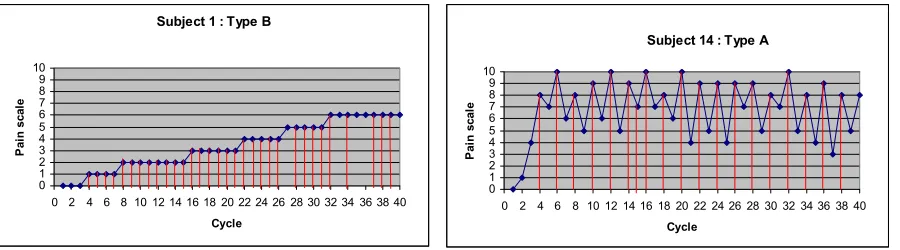
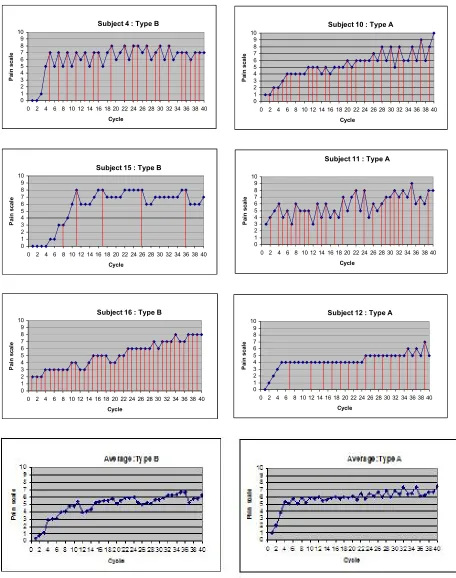
3.3 Individual work pattern
In an effort to better understand the relationship between individuals and their break
pattern and the influence of reported pain on breaks, the following graphs of each
subject are presented. These graphs have reported pain scale as the y value and the
cycle on the x axis. All the red lines running vertically indicate when each subject
took a break during the session. Thus the graphs depict the work-break pattern of each
individual with reference to the pain level they reported after each cycle.
Subject 1 : Type B
0 1 2 3 4 5 6 7 8 9 10
0 2 4 6 8 10 12 14 16 18 20 22 24 26 28 30 32 34 36 38 40
Cycle P ain s ca le
Subject 14 : Type A
0 1 2 3 4 5 6 7 8 9 10
0 2 4 6 8 10 12 14 16 18 20 22 24 26 28 30 32 34 36 38 40
Subject 2 : Type B 0 1 2 3 4 5 6 7 8 9 10
0 2 4 6 8 10 12 14 16 18 20 22 24 26 28 30 32 34 36 38 40
Cycle P ai n s cal e
Subject 5 : Type A
0 1 2 3 4 5 6 7 8 9 10
0 2 4 6 8 10 12 14 16 18 20 22 24 26 28 30 32 34 36 38 40
Cycle P ai n sc al e
Subject 3 : Type B
0 1 2 3 4 5 6 7 8 9 10
0 2 4 6 8 10 12 14 16 18 20 22 24 26 28 30 32 34 36 38 40
Cycle P ai n scal e
Subject 7 : Type A
0 1 2 3 4 5 6 7 8 9 10
0 2 4 6 8 10 12 14 16 18 20 22 24 26 28 30 32 34 36 38 40
Cycle P ai n sc al e
Subject 6 : Type B
0 1 2 3 4 5 6 7 8 9 10
0 2 4 6 8 10 12 14 16 18 20 22 24 26 28 30 32 34 36 38 40
Cycle P ai n scal e
Subject 8 : Type A
0 1 2 3 4 5 6 7 8 9 10
0 2 4 6 8 10 12 14 16 18 20 22 24 26 28 30 32 34 36 38 40
Cycle P ai n scal e
Subject 9 : Type A
0 1 2 3 4 5 6 7 8 9 10
0 2 4 6 8 10 12 14 16 18 20 22 24 26 28 30 32 34 36 38 40
Cycle P ai n scal e
Subject 13 : Type B
0 1 2 3 4 5 6 7 8 9 10
0 2 4 6 8 10 12 14 16 18 20 22 24 26 28 30 32 34 36 38 40