ABSTRACT
XU, XU. The Effect of Obesity on Trunk Kinematics and Ground Reaction Forces during Lifting. (Under the direction of Dr. Gary A. Mirka and Dr. Simon M. Hsiang.)
The prevalence of obesity is increasing worldwide. In fact, in the United States,
obesity has been recognized as an epidemic. Obesity has been shown to increase the risk of
physical injury and illness. Among these physical disorders, low back pain (LBP) is one of
the most common phenomena in both obese and non-obese individuals. However, the
relationship between obesity and LBP is not fully developed and the causal link between
them is insufficient. The objective of this research was to evaluate the differences between
people of normal weight and obese people in measures of trunk kinematics and ground
reaction force during a lifting task. The main hypothesis of this study was that obese people
would have a higher mean value and a higher variability of these measures than of normal
weight people.
Two subjects groups were used in this research and each group had six subjects.
Group I is the normal weight subject group (BMI<25), and Group II is the obese subject
group (BMI>30). In the experiment, the subjects were asked to perform a lifting task under
two levels of load (10% and 25% of maximum lifting capacity) and two levels of starting
asymmetric angle (0° and 45°). The Lumbar Motion Monitor was used to collect the trunk
kinematics data and two force plates were used to collect the ground reaction force and
moment data. To test the variability, Modified Levene’s test was employed. MANOVA and
ANOVA were used to assess the effects of BMI, load, and angle on these measures. The
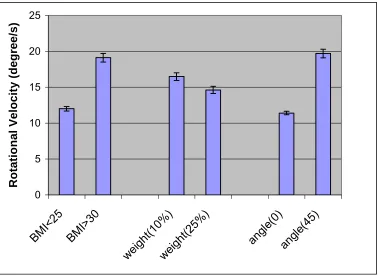
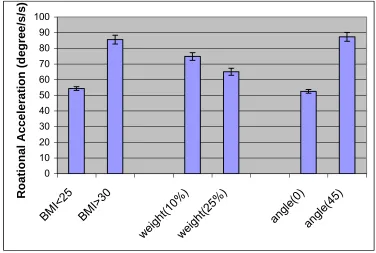
results showed that BMI is a significant effect for mean value on several kinematics
parameters. From BMI<25 to BMI>30, the rotational velocity increased by 59.2%; the
acceleration increased by 50.5% (all statistically significant at the p<0.05 level). However,
the results did not support the hypothesis that BMI would affect variability in these measures.
This study provides quantitative data describing lifting task performance for obese
people, and has shown that obese people have higher sagittal velocity, sagittal acceleration,
rotational velocity, and rotational acceleration during lifting task, which may lead to higher
forces on spine, compared to people with normal weight. The results indicated that the
regular safety evaluation of lifting job based on normal people may not be appropriate for
obese people since they have different lifting pattern, which may increase the risk of injury.
The data presented in this work are particularly important as the general workforce continues
The Effect of Obesity on Trunk Kinematics and Ground Reaction Forces
during Lifting
by
Xu Xu
A thesis submitted to the Graduate Faculty of North Carolina State University
in partial fulfillment of the requirements for the Degree of
Master of Science
INDUSTRIAL AND SYSTEMS ENGINEERING
Raleigh, North Carolina
2006
APPROVED BY:
___________________________ ____________________________ David Dickey, PhD Simon Hsiang, PhD (Co-chair of Advisory Committee)
_________________________________ Gary Mirka, PhD
BIOGRAPHY
Xu Xu was born in 1983 and grew up in Beijing, China. He grew up with his parents,
Xuezeng Wu and Aixue Zhang. Xu Xu graduated from Tsinghua University in 2004 with a
degree of Bachelor of Science. He came to the United States and started his graduate studies
in the Department of Industrial and Systems Engineering in North Carolina State University.
Table of Contents
LIST OF FIGURES...v
LIST OF TABLES...vi
1 INTRODUCTION...1
1.1 ERGONOMICS...1
1.2 PHYSICAL ERGONOMICS AND LOW BACK PAIN (LBP)...1
1.2.1 Anatomy of the Low Back / Spine and Low Back Disorders...2
1.2.2 Physical Risk Factors ...4
1.2.3 Personal Risk Factors...6
1.3 BODY MASS INDEX (BMI) ...7
1.3.1 Increased Body Mass Index of People in the Workforce ...8
1.3.2 The Relationship between Body Mass Index (BMI) and LBP ...11
1.4 BIOMECHANICAL VARIABILITY...14
1.4.1 Inter-individual variability ...15
1.4.2 Intra-individual variability ...16
1.5 COORDINATION BETWEEN TRUNK BEND AND EXTERNAL MOMENT...18
1.6 OBJECTIVE AND HYPOTHESES...23
2 METHOD ...25
2.1 SUBJECTS...25
2.2 APPARATUS...26
2.2.1 Lumbar Motion Monitor ...26
2.2.2 Force Plate ...27
2.2.3 Asymmetric Reference Frame...28
2.2.4 Box...29
2.2.5 Platform ...29
2.3 EXPERIMENTAL DESIGN...30
2.3.1 Independent Variables ...30
2.3.2 Dependent Variables ...30
2.4 PROCEDURE...31
2.5 DATA PROCESSING...35
2.5.1 Lumbar Motion Monitor ...35
2.5.2 Force Plate ...35
2.5.3 Intra-Subject Variability ...36
2.5.4 Inter-Subject Variability ...37
2.5.5 Maximum and Minimum Relative Phase Angle of Sagittal Trunk Bend and External Moment in the Sagittal Plane...38
2.6 STATISTICAL ANALYSIS...39
2.6.1 Checking Assumptions of the Analysis of Variance ...39
2.6.2 Statistical Model ...40
2.6.3 Analysis Process ...42
3 RESULTS ...42
3.1 MEAN VALUES...43
3.1.1 Trunk Kinematics...43
3.1.2 Ground Reaction Force ...47
3.2 INTRA-SUBJECT VARIABILITY...50
3.2.1 Trunk Kinematics...51
3.2.2 Ground Reaction Force ...52
3.3 INTER-SUBJECT VARIABILITY...54
3.3.1 Trunk Kinematics...55
3.4 COORDINATION BETWEEN SAGITTAL TRUNK BEND AND EXTERNAL MOMENT IN THE SAGITTAL
PLANE ...58
4 DISCUSSION ...62
5 CONCLUSIONS ...70
6 REFERENCE...71
7 APPENDICES ...75
7.1 APPENDIX A. ANOVA ASSUMPTION...76
List of Figures
FIGURE 1 SAGITTAL TRUNK BEND ANGLE AND EXTERNAL MOMENT IN THE SAGITTAL PLANE DURING A SINGLE
LIFTING TRIAL AS A FUNCTION OF TIME...19
FIGURE 2 NORMALIZED EXTERNAL MOMENT IN THE SAGITTAL PLANE PLOTTED AS A FUNCTION OF NORMALIZED SAGITTAL TRUNK BEND ANGLE...20
FIGURE 3 SAGITTAL TRUNK BEND DURING ONE LIFTING TRIAL PLOTTED ON ANGULAR POSITION VS. ANGULAR VELOCITY PHASE PLANE...22
FIGURE 4 PHASE PLANE OF EXTERNAL MOMENT IN THE SAGITTAL PLANE VS. DERIVATIVE OF EXTERNAL MOMENT IN THE SAGITTAL PLANE...22
FIGURE 5 THE RELATIVE PHASE ANGLE BETWEEN SAGITTAL TRUNK BEND AND EXTERNAL MOMENT IN THE SAGITTAL PLANE...23
FIGURE 6 BOX PLOT OF THE BMI IN NORMAL GROUP AND OBESE GROUP...26
FIGURE 7 LUMBAR MOTION MONITOR...27
FIGURE 8 FORCE PLATES...28
FIGURE 9 THE SUBJECT STOOD IN THE ASYMMETRIC REFERENCE FRAME (ARF) AND PUSHED AGAINST THE PADDED ROLLER...28
FIGURE 10 SET-UP OF PLATFORM...29
FIGURE 11 SAGITTALLY SYMMETRIC LIFT STARTING POSITION...33
FIGURE 12 45° LIFT STARTING POSITION...33
FIGURE 13 ENDING POSITION OF ALL LIFTS...34
FIGURE 14 EFFECTS OF BMI, WEIGHT, AND ANGLE ON THE MEAN VALUE OF THE PEAK ROTATIONAL VELOCITY..44
FIGURE 15 EFFECTS OF BMI, WEIGHT, AND ANGLE ON THE MEAN VALUE OF THE PEAK ROTATIONAL ACCELERATION...45
FIGURE 16 EFFECTS OF BMI, WEIGHT, AND ANGLE ON THE MEAN VALUE OF THE PEAK SAGITTAL VELOCITY...46
FIGURE 17 EFFECTS OF BMI AND WEIGHT ON THE MEAN VALUE OF THE PEAK ROTATIONAL ACCELERATION...47
FIGURE 18 EFFECTS OF WEIGHT AND ANGLE ON THE MEAN VALUE OF THE PEAK LATERAL FORCE...48
FIGURE 19 EFFECTS OF WEIGHT AND ANGLE ON THE MEAN VALUE OF THE PEAK ANTERIOR FORCE...49
FIGURE 20 EFFECTS OF WEIGHT AND ANGLE ON THE MEAN VALUE OF THE VERTICAL FORCE...50
FIGURE 21 EFFECT OF INTERACTION OF WEIGHT*ANGLE ON THE INTRA-SUBJECT VARIABILITY OF THE ROTATIONAL VELOCITY...52
FIGURE 22 EFFECT OF ANGLE ON THE INTRA-SUBJECT VARIABILITY OF THE LATERAL FORCE...53
FIGURE 23 EFFECT OF ANGLE ON THE INTRA-SUBJECT VARIABILITY OF THE VERTICAL FORCE...54
FIGURE 24 EFFECT OF ANGLE ON THE INTER-SUBJECT VARIABILITY OF THE LATERAL FORCE...56
FIGURE 25 EFFECT OF ANGLE ON THE INTER-SUBJECT VARIABILITY OF THE ANTERIOR FORCE...57
FIGURE 26 EFFECT OF ANGLE ON THE INTER-SUBJECT VARIABILITY OF THE VERTICAL FORCE...58
FIGURE 27 EFFECT OF BMI ON THE MAXIMUM RELATIVE PHASE ANGLE...59
FIGURE 28 EFFECT OF WEIGHT ON THE MAXIMUM RELATIVE PHASE ANGLE...60
FIGURE 29 EFFECT OF ANGLE ON THE MINIMUM RELATIVE PHASE ANGLE...61
FIGURE 30 THE NORMAL QUANTILE PLOT OF THE RESIDUALS FOR THE MEAN VALUE OF THE PEAK SAGITTAL VELOCITY...76
FIGURE 31 THE SCATTER PLOT OF THE RESIDUALS TO TEST THE INDEPENDENCE BETWEEN TRIALS FOR THE MEAN VALUE OF THE PEAK SAGITTAL VELOCITY...77
FIGURE 32 THE SCATTER PLOT OF THE RESIDUALS VERSUS PREDICTED VALUES FOR THE MEAN VALUE OF THE PEAK SAGITTAL VELOCITY...77
FIGURE 33 THE NORMAL QUANTILE PLOT OF THE RESIDUALS FOR THE INTRA-SUBJECT VARIABILITY OF THE PEAK SAGITTAL VELOCITY...78
FIGURE 34 SCATTER PLOT OF THE RESIDUALS TO TEST THE INDEPENDENCE BETWEEN TRIALS FOR THE INTRA-SUBJECT VARIABILITY OF THE PEAK SAGITTAL VELOCIT...79
FIGURE 35 THE SCATTER PLOT OF THE RESIDUALS VERSUS PREDICTED VALUES FOR THE INTRA-SUBJECT VARIABILITY OF THE PEAK SAGITTAL VELOCITY...80
List of Tables
TABLE 1 BODY MASS INDEX...8 TABLE 2 ANTHROPOMETRIC DATA OF THE SUBJECTS...25 TABLE 3 BMI VALUES OF NORMAL WEIGHT GROUP AND OBESE GROUP...25 TABLE 4 MANOVA AND ANOVA RESULTS RELATIVE TO THE MEAN VALUES OF PEAK KINEMATICS PARAMETERS
...43 TABLE 5 MANOVA AND ANOVA RESULTS RELATIVE TO THE MEAN VALUES OF PEAK GROUND REACTION
FORCES...47 TABLE 6 MANOVA AND ANOVA RESULTS RELATIVE TO THE INTRA-SUBJECT VARIABILITY OF THE PEAK
KINEMATICS PARAMETERS...51 TABLE 7 MANOVA AND ANOVA RESULTS RELATIVE TO THE INTRA-SUBJECT VARIABILITY OF THE GROUND
REACTION FORCES...52 TABLE 8 ANOVA RESULTS RELATIVE TO INTER-SUBJECT VARIABILITY OF THE PEAK GROUND REACTION FORCES
...55 TABLE 9 MANOVA AND ANOVA RESULTS ON THE RELATIVE PHASE PLOT ANGLE...59 TABLE 10 DEGREES OF FREEDOMS OF SOURCES IN THE MODEL FOR THE MEAN VALUE, THE INTRA-SUBJECT
1
Introduction
1.1 Ergonomics
Ergonomics is a branch of science and engineering that is concerned with the
achievement of optimal relationships between workers and their work environment, with the
goal of designing the job environment to fit people. Ergonomists assess the human
capabilities and limitations (physical and cognitive) and then attempt to develop work
environments that do not exceed these limitations. Many disciplines could contribute to the
development of ergonomics including industrial engineers, industrial psychologists,
occupational medicine physicians, industrial hygienists, and safety engineers.
There are three main domains within the broad discipline of ergonomics:
organizational ergonomics, cognitive ergonomics, and physical ergonomics. Organizational
ergonomics is the study of the optimization of the organization and process of social systems.
Cognitive ergonomics is the study of human behavior and attributes such as decision-making
processes and human perception. Physical ergonomics is the study of physical aspects of the
workplace and human biomechanical/ physiological capabilities. The current research
focuses on this area of physical ergonomics.
1.2 Physical Ergonomics and Low Back Pain (LBP)
Physical ergonomics is concerned with human anatomical, anthropometric,
physiological and biomechanical characteristics. Physical ergonomics principles can be
applied in virtually any work environment. In the study of physical ergonomics,
compensation and lost work days. In 2002, there were 1.4 million cases of occupational
injuries and illnesses categorized as musculoskeletal injuries, and about 76% were related to
trunk and upper extremities. Back disorders account for 27% of all nonfatal occupational
injuries and illnesses in the days away from work (BLS 2002). The estimated cost of MSDs
was about 13 billion in 1996, and low back pain (LBP) cost about $8000 for each case in
1989 (Bernard 1997).
Low back pain is a frequent phenomenon found in many occupational categories.
Lifetime prevalence has been estimated at about 70% (Andersson 1981). It is one of the most
costly problems of modern society, with an estimated cost of $8.8 billion in the U.S. in 1995
(Murphy and Volinn 1999). It is also known that back pain affects 65% of the population in
Switzerland annually (Jeanneret, Frey et al. 1998). People of all ages are affected by back
pain, but it generally begins between the ages of 20 – 40, and the prevalence peak between
the age of 45 – 60 years, with a slight difference between male and female (Lee, Kratter et al.
2005). Most low back pain results from muscle or ligament strain which generally last from a
few days to a few weeks. However, damage or injury to spinal nerves or vertebral discs also
results low back pain which may persist more than 3 months and is considered chronic.
Although a large number of studies and reviews have focused on the cause of low back pain,
the factors leading to the complex burden of disease remain unclear (Lee, Kratter et al. 2005).
1.2.1 Anatomy of the Low Back / Spine and Low Back Disorders
The spine is a flexible column of irregular bones known as vertebrae. It is the axial
support of the body and extends from the skull to its anchoring point in the pelvis, where it
transmits the weight of upper body to the lower limbs. The spinal cord is protected by the
nerve pairs of the peripheral nervous system, as well as the central nervous system pathway
that controls the movement and function of the body. Motor nerves of the spinal cord are
responsible for controlling movement while sensory nerves entering into the spinal cord are
responsible for communicating sensory information from the periphery to the brain.
Intervertebral discs are located between adjacent verterbrae and are composed of an inner
semifluid nucleus pulposus, which gives the disc elasticity and compressibility, and a rigid
outer ring of the annulus fibrosus, which contains the nucleus pulposus and limits its
expansion. The intervertebral discs absorb shock during body movement and limit the motion
of the vertebra. On the surface of the spine, seven processes project from the vertebral arch.
The spinous process is a posterior projection arising at the junction of the two laminae. The
transverse processes are on the lateral aspects of the vertebral arch. The attachment sites for
muscles and the ligaments are on both spinous process and transverse processes. The
ligaments link the vertebrae to stabilize the vertebral column and the muscles move the
vertebral column. The muscles, tendons, and ligaments could handle the external force put on
the spine during the movement (Marieb 1989).
Two common causes of low back pain are muscle strain and lumbar sprain. Muscle
strain is an injury to either muscle or tendon and can result from twisting or overstretching
the back muscles or tendons. A long-time repetitive movement of the muscles may result the
chronic strain (Bernard 1997). Lumbar sprain is a ligamentous injury that occurs when the
ligaments are stretched beyond the normal range, or contracted suddenly. Usually, the
symptoms of muscle strains and lumbar sprain are similar and can be difficult to differentiate.
In addition to muscle strains and lumbar sprains, damage to spinal discs is another cause of
to the spine and involves rupture of the annulus fibrosus and the protrusion of nucleus
pulposus. When the protrusion presses on or irritate the spinal cord or the nerve root, pain
and numbness can result. Another common disorder is disc degeneration, a.k.a. spine
osteoarthritis. As the discs in the spine dehydrate, they lose their ability to absorb the shock.
The bone and ligament contained in the spine also become less flexible and thicken.
Degeneration of discs is normal, but it can be very painful when the spurs of discs or bone
begin to pinch and press on the nearby nerve roots or spinal cord. In addition, internal disc
disruption within the structure of the disc can result in back pain and even lower limb pain
without the presence of spinal nerve root compression (Marieb 1989).
1.2.2 Physical Risk Factors
There have been many studies investigating the relationship between workplace
factors and LPB. The principal factors include heavy physical work, lifting and forceful
movements, bending and twisting/awkward posture, whole body vibration, and static work
postures (Bernard 1997).
Heavy physical work is defined as work which has high energy demands or that
requires some measure of physical strength (Bernard 1997). A number of studies have shown
that LBP are associated with heavy physical work (Leigh and Sheetz 1989; Burdorf and
Zondervan 1990; Heliovaara, Makela et al. 1991). However, Bernard (1997) states that
exposures were assessed subjectively for the most part of the problem and that may lead to
the misclassification of exposure status and an incorrect estimate of risk. Thus, Bernard
believes that some of the study on heavy work load appeared to implicitly include other
Some previous studies (Punnett, Fine et al. 1991; Marras, Lavender et al. 1995) have
shown that low-back disorder is associated with work-related lifting and forceful movements.
Punnett et al. (1991) studied the relationship between back pain and occupational exposures
in auto assembly workers and found that lifting was associated with back disorder. Marras
(1995) investigated the relationship between LBP and spinal loading during occupational
lifting. The result demonstrated that the maximum moment was significantly different
between low- and high-risk groups. Awkward trunk postures means that the torso deviates
significantly from the neutral upright position. This can occur in the form of deviation in the
sagittal plane (flexion), deviation in the coronal plane (lateral flexion), or deviation in the
transverse plane (twisting). Awkward posture was found to be an important factor in the
development of low back pain (Bernard 1997). Punnett et al. (1991) investigated the
relationship between back pain and occupational exposures in auto assembly jobs and the
result showed that time in non-neutral postures of mild or severe flexion and bending were
strongly associated with LBP. After these researchers examined medical reports, they
realized that such association was more pronounced. Holmstrom et al. (Holmstrom, Lindell
et al. 1992) studied the relationship between low back pain and work task activities by a
cross-sectional study of male construction worker. As a result, stooping and kneeling
postures showed a dose-response relationship with LBP.
Whole body vibration is mechanical energy oscillations which are transferred to the
body through a supporting system such as seat or platform. Bovenzi et al. (Bovenzi and
Zadini 1992) used a cross-sectional study to investigate how vibration influenced bus drivers
while maintenance employees were referred as referents. They stated that increased exposure
(Boshuizen, Bongers et al. 1992) stated that there is no association between total vibration
dose and back pain. Bernard (1997) stated that whole body vibration may cause increased
risk of LBP in conjunction with other work-related factors such as awkward posture.
An isometric position with very little movement and static loading on the muscles is
called static work posture. Kelsey (Kelsey 1975) reported that sedentary work (sitting more
than half the time at work) was associated with disc herniation for the age group 35 years and
older. He also mentioned that disc herniation was associated with the truck drivers who spent
much time sitting while working. Videman et al. (Videman, Nurminen et al. 1990) found that
those with sedentary and heavy work had increased risk of symmetric disc degeneration and
facet joint osteoarthrosis. However, the strength of association between static work postures
and LBP is not easy to estimate since large proportion of estimates did not differ significantly
(Bernard 1997).
1.2.3 Personal Risk Factors
In addition to workplace factors, some personal risk factors such as smoking, gender,
and age have also been found to be related to LBP. In the review of smoking and back pain,
Goldberg (Goldberg, Scott et al. 2000) stated that most epidemiologic articles investigating
the possible link between smoking and nonspecific back pain consistently reported that
smoking is strongly associated with low back pain. Several plausible biological mechanisms
have been used to explain this phenomenon, such as the fact that smoking increases coughing,
which increases intra-discal and intra-abdominal pressure, thus promoting herniation;
smoking diminished the mineral material in the bone, resulting in osteoporosis of vertebral
bodies; or smoking reduces blood flow and the metabolic balance of the discs, thus
between smoking and LBP was not clear, since back pain may lead to increased levels of
smoking.
Age is another factor related to the low back pain. It has been well known that aging
can lead to a decrease in physical capability. As people age, their muscle strength decreases
gradually, and their ability to maintain their balance declines (Wright and Mital 1999; Okada,
Hirakawa et al. 2001). A decrease in muscle strength can lead to an increase in lifting injuries,
as well as slips and falls, while a decline in postural control is an important factor in the
fall-related injuries of the elderly. In the research conducted by Gilgil et al. (Gilgil, Kacar et al.
2005) , the relationship between socio-economico-cultural factors and low back pain was
investigated. The result showed that LBP sufferers were more likely to be older, in
comparison with non-sufferers. Therefore, older individuals need to be very careful during
locomotion.
1.3 Body Mass Index (BMI)
Another potential personal risk factor for low back pain is related to the individual’s
whole body mass. BMI stands for Body Mass Index and indicates weight status in adults. It
is calculated as body weight in kilograms divided by the square of stature in meters. Thus,
BMI is a measure of the weight of a person scaled according to height and is used to assess
how much the body weight departs from the normal level for a person of that stature. The
BMI for human bodies ranks from 15 (starvation) to 40 (morbidly obese). In general, for
adults aged 20 years or older, BMI falls into these categories: underweight, normal,
Table 1 Body Mass Index
BMI Weight Status Obesity Class
Below 18.5 Underweight 18.5-24.9 Normal 25.0-29.9 Overweight
30.0-34.9 Obese I
35.0-39.9 Obese II
40 and Above Morbid Obesity III
1.3.1 Increased Body Mass Index of People in the Workforce
Currently, the prevalence of obesity is increasing at a high rate worldwide in both
developed and developing countries (Laitinen, Nayha et al. 2005). In the United States,
obesity has been recognized as one kind of epidemic, and the numbers of overweight and
obese adults and children are growing (Wellman and Friedberg 2002). The rapid rise of
obesity rates started in the 1980’s. Between 1960 and 1980, obesity rates increased from 12
percent to 15 percent. In the past two decades, obesity rates have doubled (Finkelstein, Ruhm
et al. 2005). National Center for Health Statistics stated that about 65 percent of U.S. adults
were either overweight or obese in 2002 and the obesity rate increased from 15 percent in
1980 to 31 percent in 2002.
Historically, the majority of the population was more likely to suffer from being
underweight than overweight and increased body weight was associated with an affluent
condition. However this point of view has changed since obesity became an epidemic
phenomenon in the latter part of the twentieth century. Increased body weight resulted from a
surplus of consumed calories compared to calories expended (Finkelstein, Ruhm et al. 2005).
Philipson (Philipson and Posner 2003) states that technological changes are responsible for
obesity largely because of the effect of reducing energy expenditure in the workplace. The
1980. In 2000, this fraction fell to 19%. On the other hand, there was an observed trend in
energy intake during this time period. The Centers for Disease Control and Prevention (CDC
2004) indicated that caloric consumption remained basically unchanged between 1971 –
1974 and 1976 – 1980, while the consumption increased 7.3% (179 calories per day) for men
and 23.3% (355 calories per day) for women between 1976 – 1980 and 1999 – 2000. Putnum
(Putnum and Allshouse 1999) also reports that from 1910 to 1985, energy intake remained
roughly constant until it rose by about 12% between 1985 and 2000 primarily because of
increased consumption of carbohydrates, such as grains, sugars and fats. The CDC (CDC
2004) reported that in 1976 – 1980 adult men and women aged 20 – 74 years consumed 1039
and 700 kcal of carbohydrates. In 1999-2000, the consumption increased to 1283 and 969
kcal. Soft drinks have also contributed to increased calories intake. In 1997, the average
American consumed 53 gallons of soft drinks and 17 gallons of fruit juices per year, an
increase of 51% and 40%, respectively, since 1980 (Putnum, Allshouse et al. 2003).
According to Cutler (Cutler, Glaeser et al. 2003), higher snack calories are responsible for
almost all of the rise in energy intake between 1977 – 1978 and 1994 – 1996.
Finkelstein believes that reductions in the price of high-energy food along with an
increased prevalence of marginal cost pricing led to both an increase in food consumption at
each meal and increased consumption between meals (Finkelstein, Ruhm et al. 2005).
Nielsen and Popkin (Nielsen and Popkin 2003) state that growth in portion sizes for the
majority of foods increased over time including French fries and sweetened beverages.
Serving size began to increase in 1970s and continued to increase in the 1980s and 1990s
while obesity rates rose. In the United States, serving sizes are larger than those in Europe. A
increase in the consumption of foods at restaurants where food usually contains more calories
than home-cooked meals. From the investigation (Lakdawalla, Philipson et al. 2005), there is
no significant effect of wages on men’s weight. However higher wages are associated with
lower weight in women. Finkelstein (Finkelstein, Ruhm et al. 2005) also reports that
television contributes to the obesity epidemic because there is a link between viewing
television and an increase in serving size and the percentage calories from fat consumed
while watching television. Children are exposed to about 10 food commercials per hour,
most for fast food, soft drinks and sugar-sweetened cereals which may increase body weight
by a significant amount.
In the U.S. workforce, Hertz et al. (Hertz, Unger et al. 2004) state that the prevalence
of normal weight has significantly decreased between 1988 – 1994 and 1999 – 2000. The
obesity rate for men increased from 19.0% to 26.1%, and the obesity rate for women
increased from 22.2% to 33.3%. The obesity rate also increased as age increased: 26.9% of
workers aged 20 – 39; 31.9% of workers aged 40 – 59; and 34% of worker aged older than
60 had a BMI greater than 30 kg/m2. From 1988 to 2000, the rate of obesity increased more
than 50% among both younger and older workers and about 25% among middle-aged
workers. At present overweight or obese worker account for 59.2%, 67.5% and 77.0% of
younger, middle-aged and older workers, respectively. Obese workers are significantly more
likely than normal-weight workers to report they are limited in some types of work because
of physical, mental, or emotional problems. Among both men and women, work limitations
of those who were classified as obese people were significantly higher than those who are
overweight. These authors also state that the workforce limitations rate of younger obese
work limitation rate of middle-aged obese workers is similar to the rate of older
normal-weight workers (8.0% vs. 8.4%). Hertz et al. also concludes that obesity is on the rise among
members of the workforce. The increase in obesity rate of workforce was 9.0% from 1988 to
2000, which is slightly more than the 7.6% change for the total adult population.
1.3.2 The Relationship between Body Mass Index (BMI) and LBP
The spine is used to support the body weight and external load; when excess weight is
carried, the spine may undergo structural damage due to high force and high moment on the
vertebra and vertebral disc. As a result obesity may make the spine more vulnerable to low
back pain since obese people have high body weight. In addition, the lack of exercise among
obese people could lead to poor flexibility and weak back muscles, which may induce back
injury by the decreased postural control. Therefore, obesity is a potential factor of low back
pain. However, the current research only showed a weak relationship between them.
Leboeuf-Yde (Leboeuf-Yde 2000) did a systematic literature review of 56 journal
articles to investigate the relationship between body weight and low back pain. From his
review, in 21 (32%) of the 65 articles there was statistically significant positive association
between weight or relative weight and LBP. A total of 111 LBP variables had been used in
these 65 studies and 25 variables of these were positively associated with weight or relative
weight. The author concluded that there is not enough evidence to determine whether there
was a causal relationship between body weight and LBP.
Kostova et al. (Kostova and Koleva 2001) conducted a cross-sectional study
investigating the effect of some risks factors on back disorders, including impact of obesity.
This study examined 898 workers and employees who were divided into different groups
BMI in different groups, researchers found a statistically significant link between obesity and
LBP. Obesity and back disorders in men and women over 40 exhibited a similar trend. Their
results also showed believed the risk for developing LBP and back problems due to obesity
may be even more significant in elderly men who tend to gain weight as aged. The authors
also mentioned that although a positive relationship between excess body weight and risk for
back disorders was shown in many studies, the causality between them was still not clear.
Marcus (Marcus 2004) conducted a study that investigated the link between obesity
and the impact of chronic pain. In their investigation, patients were asked to provide and
average pain severity score from 0 (no pain) to 10 (excruciating). And subjects were divided
into 3 weight categories: normal, overweight, and obese. From the patient demographics,
back pain accounted for 20.4% of primary pain in the normal category, 24.8% in the
overweight category, and 25.4% in the obese category. This data showed there was an
increasing trend of back pain as the primary pain while the body weight increased.
Bayramoglu et al. (Bayramoglu, Akman et al. 2001) reports that obesity is directly
and indirectly associated with LBP. In their research, the study group included patients who
had been experiencing low back pain for at least 3 month. The control group included
age-matched subjects not having any known history of low back pain in the past 2 year. The
results indicate that the LBP patients had significantly higher BMI than the control group.
Therefore they conclude that obesity is one etiologic factor in LBP. However they also admit
that inactivity caused by LBP may result in secondary obesity.
On the other hand, some investigations showed that BMI did not have a significant
effect on LBP. Chung-Yol Lee et al. (Lee, Kratter et al. 2005) conducted a cross-sectional
known for 10,306 participants, of whom 6514 participants (63%) had a normal weight (BMI
between 19kg/m2 and 25kg/m2), 513 participants (5%) were obese (BMI>30 kg/m2), 2710
participants (26%) were overweight (BMI between 25kg/m2 and 30kg/m2), and 569
participants (6%) were underweight (BMI<19 kg/m2). Participants were asked to report
whether they suffered from back pain explicitly, not at all, a little, or severely, in the previous
4 weeks. This research found that obese people had worse flexibility, upper body strength,
and abdominal musculature. However, the authors did not found the association between
BMI and back pain.
Sward et al. (Sward, Eriksson et al. 1990) investigated the relationship between
anthropometric characteristics and back pain in athletes. The subjects in their study were
between 16 and 25 years old and consisted of wrestlers, gymnasts, soccer players and tennis
players. To guarantee the homogeneity of the groups, all chosen athletes had trained during
childhood and adolescence. All subjects had been involved in the respective sports since the
age of 10 years or earlier. In the experiment, all the subjects completed a questionnaire
relating to previous or present back pain. Back pain was graded according to the severity:
moderate or severe. If the athlete could continue to train or compete with the pain, it was
regarded as moderate. If the athlete was not able to train because of the pain, it was regarded
as severe. The incidence of back pain among the 116 athletes was: 35.3% reported no
previous or present back pain, whose BMI is 23.0 ± 4.0; 32.8% reported moderate back pain
previously or at present, whose BMI is 22.5 ± 1.6; 31.9% reported severe back pain
previously or at present, whose BMI is 23.0 ± 1.7. After statistical analysis, the researchers
found no significant relationship between BMI and back pain. However, since the athletes
groups can not represent normal people. Therefore the results of this study may change after
expanding the subject groups to a wider range that has a better representation of the actual
workforce.
From a quick review of the researches above, we can see that the current literature
does not reach an agreement on the relationship between obesity and LBP. Some researchers
consider obesity a possible factor of LBP, while others do not. Since there is not a
consistency of opinion regarding the link between obesity and LBP, it’s meaningful to clarify
whether obesity is a factor that influences the lifting pattern, which in turn affects the spinal
load and is a potential factor of LBP.
1.4 Biomechanical Variability
Variability is a natural component of human performance and many statistical
assessment techniques attempt to distinguish the variability associated with the factor
(Marras, Granta et al. 1999). There are two types of variability: inter-individual variability
defined as the variability between individuals, and intra-individual variability defined as the
variability within an individual. It’s clear that with many ways of performing lifting tasks,
technique variability both between and within individuals exists. Since the biomechanical
effects of obesity influence people to varying degrees, it could lead to much variability in
lifting technique. In terms of biomechanical performance and spinal load during lifting task,
such variability may increase the risk of low back disorder (Granata, Marras et al. 1999).
Granata et al (1999) investigated the variability in lifting motions, trunk moments,
and spinal loads associated with repeated lifting. He stated that one task could have an
average compressive load with a narrow distribution of loads resulting in a low probability of
an identical mean spinal load but with a wider distribution, which could result in a high
probability of exertion exceeding spinal tolerance levels. However, since the mean values of
these two tasks are same, the task with the wide distribution might still assessed as a safe one
by traditional interpretation.
1.4.1 Inter-individual variability
Inter-individual variability is quite common in manual material handling jobs which
includes lots of lifting actions. For the same lifting job, different people may use different
lifting techniques. In the research of different lifting techniques, Burgess-Limerick
(Burgess-Limerick 2003) stated that lifting technique can be defined in terms of the posture adopted
just before the load is lifted. Different lifting techniques including stooped posture,
semi-squat posture, and a full semi-squat posture place different parts of the body at risk for
musculoskeletal injuries because of the differences in muscles force requirements and
loading at the joints of the body. For example, the author believed that a stooped lift is more
likely to induce a higher risk for low back injury than a semi-squat lift because of the
posture-specific loads that were developed.
In the research of Granata et al. (1999), the authors tried to quantify the variability in
lifting motions, trunk moments, and spinal loads associated with repeated lifting tasks. The
subjects in this study consisted of experienced manual material handlers and inexperienced
college students. Both groups were asked to perform sagittally symmetric lifts or asymmetric
lifts 60° to the right with 13.6kg or 27.3kg box load from knee height to the upright posture.
The subjects were told to use a preferred lifting velocity or a faster-than-preferred lifting
velocity to lift the box. The experimenter collected EMG data from the erector spinae, rectus
motion data were recorded by electrogoniometers which measured sagittal, lateral and
twisting motions of the lumbar region. The dynamic external loads were collected from a
force plate on which the subjects stood during the experiment. The results showed that
subject-to-subject differences typically accounted for the largest source of variability in trunk
motion, lifting moments, and spinal load. The weight of the load accounted for significant
amount of the variability associated with dynamic sagittal trunk moment and spinal
compression.
Since overweight and obese people may lack in exercise, their flexibility, ability of
balance control and muscle capacity could decrease to some extent (Malina, Beunen et al.
1995; Corbeil, Simoneau et al. 2001). Such deceases in physical/physiological abilities that
obese people undergo can be at different rates, which can lead to greater inter-subject
variability in lifting technique of obese people. We already know that the population with
higher inter-individual variance may be at greater risk for injury because the work tasks
affect individuals differently. In addition, greater inter-individual variance may make it more
difficult to predict injury. Therefore, it is reasonable to investigate the variability of lifting
techniques in obese people and normal weight people.
1.4.2 Intra-individual variability
Since the subject may not use an identical lifting technique for repetitions of a certain
task, intra-variability needs to be considered. Mirka et al. (Mirka and Baker 1996) stated that
since the lifter has the ability to change the lifting technique, variability in this technique or
strategy could lead to variability in the biomechanical stresses experienced by the spine and
the risk of low-back injury. They proposed that the number of most stressful lifting tasks was
analysis and musculoskeletal measurements, there was potential for significant variability
during the repeated performance of some certain tasks. Therefore, the variability of the lifting
biomechanics should be considered as important as the mean value when assessing the risk of
the lifting tasks.
In the investigation of Granata et al. (1999), the trial-to-trial variations account for
12-24% of the trunk moment variability. And such variations in spinal load ranged from 14% in
compression to about 32% in lateral shear load and accounted for 20-67% of the task
acceleration variability. These results showed that identical lifting tasks did not always
produce the same kinetics or kinematics. It is also important to know how workplace factors
influence the variability. Mirka et al. (Mirka and Baker 1996) found that the higher
derivatives of motion were associated with greater variability. After importing the trunk
motion data into the dynamic biomechanical model, they found that the range of peak torques
across the experiment revealed that a torque at two standard deviations above the average is
between 5% and 11% higher than the average of the peak sagittal torques, which indicated
that an average peak torque applied on an average lifting exertion may not fully represent the
type of loading which may occur under the same condition due to changes in the lifting
dynamics chosen by the subject.
During lifting task, obese people need to generate more muscle force to compensate
for their greater trunk weight. With this increase of magnitude of muscle force, the variability
of the muscle contraction may increase (Mirka and Marras 1993). From the simulation,
Corbeil (2001) showed that obese people need greater torque on the ankle joint to counteract
the perturbation. This suggests that when sustaining the postural stress and perturbation,
higher magnitude of muscle force can lead more variability from trial to trial during lifting
performance. Since the same lifting tasks may not yield the same spinal loads on one certain
subject and an increased variability is harmful because of the greater chance of exceeding
tissue tolerance, it is meaningful to investigate the intra-variability of obese people and see
whether such variability similar to the variability seen in people of normal weight.
1.5 Coordination between Trunk Bend and External Moment
A novel way of evaluating the dynamics of a lifting motion is to assess the degree of
coordination between trunk posture and lifting moment. During a lifting task, if the ground
reaction force does not point to the center of gravity (CoG) of body, an external moment is
generated. In a dynamic biomechanical model, this external moment is equal to the change
rate of the angular momentum of the entire body. Since the calculation of the angular
momentum of the trunk in the sagittal plane involves in the kinematics parameters, it would
be interesting to see how such kinematics variables coordinate to the external moment.
Considering that the lifting technique used by obese people may be different from the
technique used by people with normal weight, as a result, the pattern of the coordination
between trunk bend and external moment for obese people and people with normal weight
may be not same.
To describe the process of performing this analysis an example is presented here.
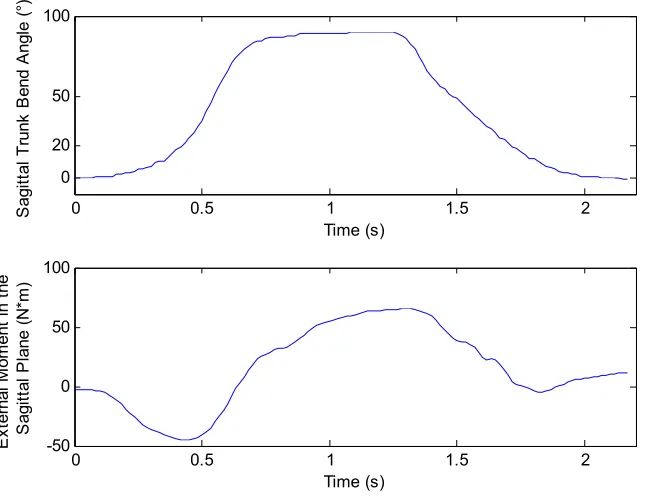
Sagittal bend angle vs. time and external moment in the sagittal plane vs. time plots for an
example lift are shown in Figure 1. As can be seen in this figure, sagittal bend angle and
external moment in the sagittal plane had same pattern on the trend of increase and decrease,
which indicated the coordination between these two measurements. To observe this
(Burgess-Limerick, Abernethy et al. 1993). A normalization procedure was used to plot this
graph. All values were subtracted by the mean value of the trial and then divided by the
standard deviation of the trial. In fact, after being normalized the original data were
transformed to their z-score. In this graph, the positive gradient indicates that the
coordination is in-phase. If the coordination was perfectly synchronous, the locus in this plot
would be a straight line. However, Burgess-Limerick mentioned that when the deviation
from the perfect synchronization is significant, quantification of the coordination from this
graph is difficult since the lag between the two movements could not be observed from it.
0 0.5 1 1.5 2
0 50 100 20 Time (s) S agi tt al T runk B end A ngl e (° )
0 0.5 1 1.5 2
-50 0 50 100 Time (s) E xt er nal M om ent in t he S agi tt al P lane ( N *m )
Figure 2 Normalized external moment in the sagittal plane plotted as a function of normalized sagittal trunk bend angle
As suggested by Burgess-Limerick et al., such in-phase coordination could be
quantified by the relative phase angle between trunk bend and external moment. In the phase
plane analysis, the variables vs. their derivative were plotted as coordinates of the points, and
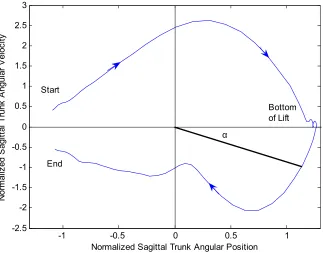
the argument of each point was calculated and called the phase angle. For the lifting task in
this research, the trial started from negative X-axis on the phase planes for both trunk bend
and external moment in the sagittal plane, where the angular position and the external
moment were small and the angular velocity and the derivative of external moment were
about zero (Fig. 3 and 4). Given any point in time during each lift, we could obtain two phase
angles from two phase planes (α and β, in Fig 3 and 4), which represented the instantaneous
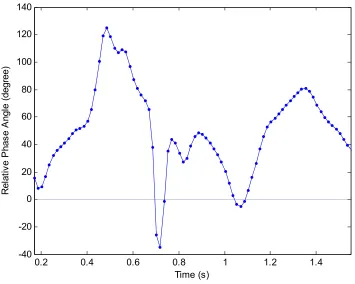
phases. Between two phase plots, there were phase lags which can be represented by the
relative phase angle, i.e. subtracting the phase angle from the other, or β-α. The
positive/negative relative phase showed the leading relation between two variables (Fig. 5).
When the relative phase angle is equal to zero, it means that the two phase planes have the
For each lift there is one maximum relative phase and one minimum relative phase. In
the research conducted by Burgess-Limerick et al. (Burgess-Limerick, Abernethy et al. 1993),
they used the minimum relative phase between a pair of joints to quantify the lifting patterns
and reported that increasing load mass during lifting increased the deviation from
perfectly-in-phase coordination and delayed the time of the minimum relative phase during extension.
In the investigation conducted by Lindbeck et al. (Lindbeck and Kjellberg 2001), they used
both the maximum relative phase and minimum relative phase as the dependent variables to
describe interjoint coordination and the lifting pattern. However, the authors stated that there
should not be any value judgment of relative phase angle in terms of good/bad lifting
techniques since the relative phase only represented the phase lag. In addition, Chaffin
(Chaffin 1999) stated that the lifting pattern had a strong effect on the external moments.
People using various lifting techniques may have different effects on compensating the
moment generated by trunk bend. By the kinematics model, load moments at each joint
would be transferred to the ground, and the different lifting techniques would be represented
to some extent by the external moment given by the ground. Therefore, it is reasonable to
consider the relative phase angle of sagittal trunk bend and external moment as an index to
represent the pattern of lifting. Like the dependent variables chosen in the research conducted
by Lindbeck et al, we used maximum relative phase and minimum relative phase as the
-1 -0.5 0 0.5 1 -2.5 -2 -1.5 -1 -0.5 0 0.5 1 1.5 2 2.5 3
Normalized Sagittal Trunk Angular Position
N orm al iz ed S ag itt al T runk A ngul ar V el oc ity Start End α Bottom of Lift
Figure 3 Sagittal trunk bend during one lifting trial plotted on angular position vs. angular velocity phase plane
-2 -1.5 -1 -0.5 0 0.5 1 1.5
-2 -1.5 -1 -0.5 0 0.5 1 1.5 2
Normalized External Moment in the Sagittal Plane
N orm al iz ed D eri va tiv e of E xt ern al M om ent in t he S agi tt al P lane Start End β
0.2 0.4 0.6 0.8 1 1.2 1.4 -40
-20 0 20 40 60 80 100 120 140
Time (s)
R
el
at
iv
e P
has
e A
ngl
e (
degree)
Figure 5 The Relative phase angle between sagittal trunk bend and external moment in the sagittal plane
1.6 Objective and Hypotheses
The objective of this study was to explore the differences in lifting patterns between
normal weight people (BMI<25) and obese people (BMI>30). The lifting patterns are
evaluated by exploring the mean value, inter- and intra-subject variability of ground reaction
force and trunk kinematics. The coordination between sagittal trunk bend and external
moment was also investigated to evaluate the lifting pattern. It is hypothesized that:
1. The mean values of trunk kinematics and ground reaction forces between
2. The intra- and inter-subject variability of trunk kinematics and ground
reaction forces between normal people and obese people are not the same
during the lifting task.
3. The maximum/minimum values of the relative phase angles of sagittal trunk
bend and external moment are not the same in the lifting task as performed by
2 Method
2.1 Subjects
There were two subject groups in this experiment. One was the normal weight subject
group which was subjects whose BMI is lower than 25. The other one was the obese subject
group which was subjects whose BMI is greater than 30. Twelve volunteers from North
Carolina State University student body and surrounding community participated in this
experiment with six subjects in each group. Each subject was male, had no current or chronic
low back problem, and fit into one of the two groups. Anthropometric data are listed below in
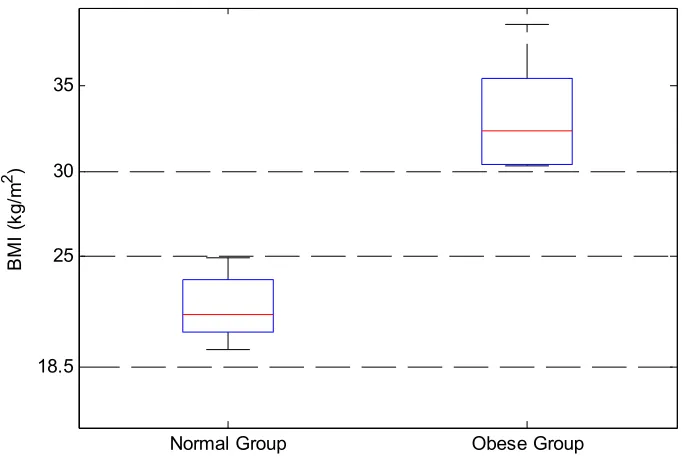
Table 2. The particular BMI values of each group were listed in Table 3, and the quantile
summary was represented by the box plot (Fig. 6).
Table 2 Anthropometric Data of the Subjects
Normal Weight
Max Min Mean STD
Stature (m) 1.830 1.692 1.769 0.050
Weight (kg) 83.462 58.968 68.947 9.017
Shoulder to L5/S1 (m) 0.457 0.410 0.437 0.018
Obese
Max Min Mean STD
Stature (m) 1.900 1.720 1.789 0.077
Weight (kg) 116.122 89.813 106.218 9.718
Shoulder to L5/S1 (m) 0.480 0.410 0.450 0.029
Table 3 BMI values of normal weight group and obese group
Normal Group Obese Group
Subject No. BMI (kg/m2) Subject No. BMI (kg/m2)
1 23.7 3 31.6 2 24.9 7 33.2 4 22.3 8 30.4 5 20.9 9 35.4
6 19.5 10 38.6
Normal Group Obese Group 30
35
18.5 25
BM
I (
kg
/m
2 )
Figure 6 Box plot of the BMI in normal group and obese group
2.2 Apparatus
2.2.1 Lumbar Motion Monitor
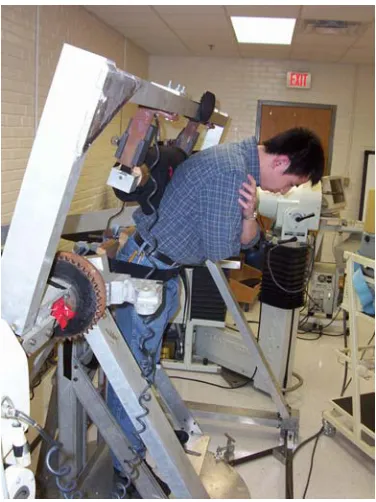
The lumbar motion monitor (LMM) is an exoskeleton of spine with
electrogoniometers which can measure the instantaneous angular position, velocity and
acceleration of the trunk in the sagittal, coronal, and transverse planes. The LMM
(Chattanooga Group Inc., TN) was used to capture the kinematics of trunk motion during
lifting task and positioned in line with the spine and attached by a harness at the thorax and
pelvis (Fig.7). When the subjects lift or do other manual material handling tasks, the
voltages to specific angles. Angular velocity and acceleration are then obtained by
differentiating the angular position as a function of time.
Figure 7 Lumbar Motion Monitor
2.2.2 Force Plate
The ground reaction forces and moments were collected by two force plates (Bertec
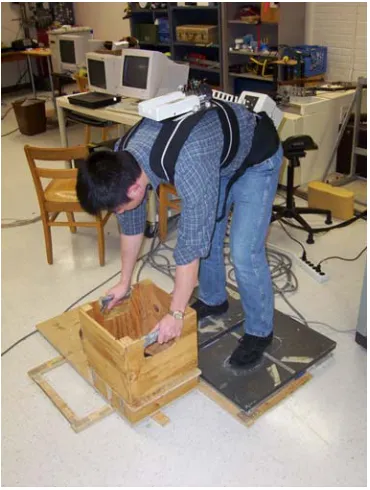
Corporation, Model 4060A) which were set apart by 4cm (Fig. 8). Each force plate has
piezoelectric transducer for measuring 3-dimension forces and moments. The output voltages
yielded by the force plate are proportional to the acting forces and moments. The signal from
Figure 8 Force Plates
2.2.3 Asymmetric Reference Frame
An apparatus called the asymmetric reference frame (ARF) (Mirka and Marras 1993)
was used to measure the participants’ maximum voluntary contractions (MVC) while
stooped in a 45° sagittal bend posture (Fig. 9). This value was used to calculate the load to be
lifted during the experiment.
2.2.4 Box
In this experiment, the weight for lifting was placed in the wooden box length by
width by height of 36cm by 36 cm by 30 cm. The handles of the box were 19 cm from the
bottom side of the box. There was a vertical bar in the middle of the bottom to secure the cast
iron weight in a central location.
2.2.5 Platform
The starting position of the wooden box with load was either directly in front of the
subjects (symmetric position) or 45° off to the right side (asymmetric position). To keep the
moment arm constant across different starting positions, a wooden platform was designed
and built. With this platform, the moment arm from the subject to the box was always 51 cm.
And the platform also insured that the box was lifted from the same position in each trial.
(Fig. 10)
2.3 Experimental Design
2.3.1 Independent Variables
The independent variables in this study were BMI (between-subjects variable), weight
of load (within-subjects variable), and starting position of the load (within-subjects variable).
There were two levels of Body Mass Index – BMI>30 and BMI<25, two levels of weight –
10% and 25% of lifting capacity, two levels of starting position of load - 0° and 45°, where
0° represented a sagittally symmetric lifting and 45° represented the starting position were to
the right side of the subject.
2.3.2 Dependent Variables
The dependent variables in this study were of three types. The first set were related to
the peak values of the trunk kinematics of the lifting process collected by LMM and the peak
ground reaction forces collected by force plates during each concentric lift. The trunk
kinematics variables included the peak rotational velocity, peak rotational acceleration, peak
sagittal velocity and peak sagittal acceleration. The ground reaction force variables were the
peak values of lateral shear, anterior shear, and vertical ground reaction forces on the right
foot, which contained the most pertinent information since the asymmetric lifts were
performed to the right side.
The second set of dependent variables evaluated the variability of the above variables.
The intra-subject variability was obtained by calculating the variance within each subject.
Hence, the intra-subject variability of peak rotational velocity, the intra-subject variability of
rotational acceleration, the intra-subject variability of sagittal velocity, and the intra-subject
intra-subject variability of peak anterior shear, the intra-intra-subject variability of downward force of
the right foot were dependent variables also.
The inter-subject variability was obtained by calculating the variance between
subjects in each group. So the subject variability of peak rotational velocity, the
inter-subject variability of rotational acceleration, the inter-inter-subject variability of sagittal velocity,
and the inter-subject variability of sagittal acceleration; the inter-subject variability of peak
lateral shear, the inter-subject variability of anterior shear, the inter-subject variability of and
downward force of the right foot were dependent variables.
In addition, to assess the coordination between external moment in the sagittal plane
and sagittal trunk bend, the maximum relative phase and the minimum relative phase angles
were calculated as dependent variables.
2.4 Procedure
During initial conversations with potential subjects, eligibility requirements (height,
weight and lack of current or chronic back and upper extremity musculoskeletal problems),
experimental procedures and the informed consent process was described to the subjects. If
the person was willing to participate, an appointment was made.
Upon arrival, the researcher explained and demonstrated the lifting task thoroughly.
The subject was asked to sign the Informed Consent From approved by North Carolina State
University Institutional Review Board. This form included detailed description of this
experiment. Several basic anthropometric measurements were taken including subject height,
weight, and shoulder to L5/S1 length. The subjects were given a five-minute warm-up and
stretching period which focused on the low back to prepare the subject for the task. To
to stand in the asymmetric reference frame and push against a padded roller in a 45° forward
bend trunk angle (Fig. 9) as hard as they could for three seconds. The MVC value (as
measured by the load cell transducers of the ARF) was used to calculate the lifting load in
this experiment. The lumbar motion monitor (LMM) was then placed on the subject's back.
While performing lifting task, the subject stood on the force plates. A five-minute break was
given before the experimental trials commence.
The experimenter demonstrated the box lifting tasks to be performed by the
participant. Before each experiment trial started, the subject was asked to tentatively lift the
box to realize the weight of load. The subject was also told to stand with the midpoint
between the ankles at a specified location to ensure that the load moment arm was 51 cm and
then position of the subject’s feet were marked. Between each trial the subject was allowed to
get off the force plates to take a rest, and was asked to put his feet on the marked position
before the next trail starting. During the experiment, the subject was given a box load that
corresponding to 10% or 25% of their personal capacity (as established during the maximum
contractions in the ARF) to lift starting from a position at floor level (either directly in front
of the subject or off to the right at 45 degrees) to mid-chest height. The end position was
directly in front of the subject (Fig. 11~13). The subject performed a free-style lift using two
hands but their feet were not allowed to move during the lift. There were 4 conditions (2
starting positions X 2 weights) and each of the 4 conditions was performed three times
(4x3=12 trials for total). Six consecutive lifts were performed in each trial and finished in 1
minute (one lift per 10 sec.) and the last 4 lifts of the 6 were monitored by LMM and force
plates. Therefore, there were 4 recorded lifts in each trial. A 1-minute break (standing
experiment was a randomized complete block design. The trunk kinematics parameters were
gathered by LMM and the ground reaction forces were gathered by using the force plate.
Figure 11 Sagittally symmetric lift starting
2.5 Data Processing
The data obtained by LMM and force plates needed to be processed to create the
appropriate dependent variables. This process involved the identification of the peak values,
the conversion to force values (force plate only), the calculation of the measures of intra- and
inter-subject variability, and the calculation of the relative phase angle.
2.5.1 Lumbar Motion Monitor
To process the data obtained from LMM, a Matlab program was written to extract the
time-dependent kinematic parameters from the dataset. The program identified each lifting
cycle and identified the peak values for each of the four dependent variables in the data
collected during concentric portion of each lift. Since the subject tended to move back and
forth when standing straight, it was difficult to define when the subject stood upright. 30
degrees of sagittal bend angle was then set as the end angle of the concentric portion of the
lift in this research. Therefore the concentric portion of the lift was defined as the trunk
movement from the maximum sagittal position (the point where the subjects grabbed the box
and started lifting) to 30 degrees of sagittal bend angle. Such definition of concentric portion
preserved the peak value of all kinematics variables which were the dependent variables of
the current research.
2.5.2 Force Plate
A Matlab program was developed that used the calibration equations to transform the
moment and then extract the peak values of the these measures collected during the
concentric portion of each lift.
Because the magnitude of the lateral, anterior, and vertical ground reaction forces are
highly correlated to the subject’s bodyweight, the ground reaction force data was normalized
to subject’s weight. To normalize the force, all lateral, anterior, and vertical ground reaction
forces were divided by subject’s body weight.
2.5.3 Intra-Subject Variability
To calculate the intra-subject variability of LMM and force plate variables, the
calculations for the modified Levene test was used (Equation 1). Within each subject, the
median was calculated from the 12 lifts for each condition (4 monitored lifts in each trial X 3
repetitions per trial). Since there were 4 conditions, we have 4 median values per dependent
variable for each subject. The individual peak values of rotational velocity, rotational
acceleration, sagittal velocity, and sagittal acceleration; lateral, anterior and vertical ground
reaction force were then subtracted from the median of respective condition, and the absolute
values of the difference were taken as the intra-subject variability. Since there were 12 values
for each dependent variable for each condition and all these values was subtracted by their
common median, the intra-subject dataset also had 12 values for each dependent variable for
each condition for each subject.
ijklm ijklm ijkl
d = y −y (1)
where
j corresponds to weight (j = 1-2)
kcorresponds to BMI (k = 1-2)
l corresponds to subject nested within BMI (l = 1-6)
m corresponds to the repetition (m=1-12)
ijklm
y corresponds to the observation of the mth repetition in a certain condition
ijkl
y corresponds to the median of the certain condition
ijklm
d is the absolute deviation for the mth repetition from the median.
2.5.4 Inter-Subject Variability
Within each subject, the mean of 12 values (4 monitored lifts X 3 repetitions per
condition) for each condition for each dependent variable was calculated. For each subject,
there were 4 means for each dependent variable, corresponding to 4 conditions. These means
were separated into two groups – one for means of the normal weight (BMI<25) subjects and
one for averages of the obese subjects (BMI>30). In this research, each group had six
subject’s data. Within each group, the median of the averages of the same condition was
calculated. Thus the median was calculated from six values because there were six values for
each condition for each dependent variable in each group, and there were two kinds of
median, one for the normal weight group, the other one for the obese group. Then the
averages value for each subject in each group was subtracted by the median of corresponding
group. The inter-subject variability was calculated by taking the absolute value from the
subtraction (Equation 2)
ijkl ijkl ijk
d = y −y (2)
i corresponds to angle (i = 1-2)
j corresponds to weight (j = 1-2)
kcorresponds to BMI (k = 1-2)
l corresponds to subject nested within BMI (l = 1-6)
ijkl
y corresponds to the mean of 12 repetitions of a certain condition
ijk
y corresponds to the median of the yijkl
ijkl
d is the absolute deviation for the lth subject from the median of his group.
2.5.5 Maximum and Minimum Relative Phase Angle of Sagittal Trunk
Bend and External Moment in the Sagittal Plane
For each lifting motion, time dependent sagittal angular velocity and time dependent
derivative of the external moment in the sagittal plane were calculated from the time
dependent trunk bend angular position and the time dependent external moment in the
sagittal plane respectively by differential equation. These four variables were then
normalized to their z-score. Two phase plane plots were plotted for trunk bend angular vs.
trunk bend velocity and external moment in the sagittal plane vs. derivative of external
moment in the sagittal plane, by the normalized values. The relative phase angle was
calculated by subtracting the instantaneous external moment phase angle from the
instantaneous trunk bend phase angle, and was used as an index of the coordination between
the sagittal angle and the external moment in the sagittal plane. In this research, the positive
relative angle indicated that the phase of sagittal angle led the phase of sagittal plane moment,
phase of sagittal angle. For each lift, the maximum and minimum relative phase angles were
calculated.
2.6 Statistical Analysis
To analyze the effect of BMI, angle, weight, and their interaction on the mean values
and the variability of trunk kinematics, ground reaction force, and maximum/minimum
relative phase, Multivariate Analysis of Variance (MANOVA) and subsequent univariate
Analysis of Variance (ANOVA) were used.
2.6.1 Checking Assumptions of the Analysis of Variance
To use analysis of variance to test the hypothesis of no difference in treatment means,
the assumption that the residuals are normally and independently distributed with mean zero
and the constant variance of error must be valid. These assumptions were evaluated using the
graphical technique advocated by Montgomery (Montgomery 2001). Appendix A displays
the example of figures illustrating the evaluation of these assumptions.
The normality assumption was evaluated by normal probability plot of the residuals
for each dependent variable. As the error distribution accords normal distribution, all points
would centralize around a straight line. To test the independence of error assumption,
plotting the residuals in time order of collection was performed. The residual should equally
distribute above and below time axis randomly without any tendency. A tendency of
continuous positive or negative residuals implies the independence assumption may be
violated. The homogeneity of variance assumption is tested by plotting the residuals versus
structureless and the residuals are randomly distributed with constant variance. (Montgomery
2001)
2.6.2 Statistical Model
In the statistical model, BMI, weight, and angle were nominal numeric variables, and
all the dependent variables were continuous numeric variables. Subject was nested in BMI.
Weight and angle were the factorial factors. For mean value, intra-subject variability, and
coordination, the model included all three main effects (BMI, weight, and angle) and all
two-way interactions. The error terms of this nested model were defined as follows: subject(BMI)
is the error term for the BMI effect; weight*subject(BMI) is the error term for the weight and
BMI*weight effects; angle*subject(BMI) is the error term for the angle and BMI*angle
effects; weight*angle*subject(BMI) is the error term for the weight*angle effect.
The linear model is:
( ) ( ) ( ) ( )
ijklm i j k l k ij jk ik jl k il k ijl k ijklm
y = + +µ τ λ +β +γ +τλ +λβ +τβ +λγ +τγ +λτγ +ε
where
i
τ corresponds to angle (i = 1-2)
j
λ corresponds to weight (j = 1-2)
k
β corresponds to BMI (k = 1-2)
( )
l k
γ corresponds to subject nested within BMI (l = 1-6)
ij
τλ corresponds to the interaction of angle and weight
jk
λβ corresponds to the interaction of weight and BMI
ik