An Efficient Clustering for Crime Analysis
Malarvizhi S
1, Siddique Ibrahim
21UG Scholar, Department of Computer Science and Engineering, Kumaraguru College Of Technology, Coimbatore,
Tamilnadu, India
2Assistant Professor , Department of Computer Science and Engineering, Kumaraguru College Of Technology,
Coimbatore, Tamilnadu, India
ABSTRACT: The k-means method is a widely used clustering technique that seeks to minimize the average squared distance between points in the same cluster. Although it offers no accuracy guarantees, its simplicity and speed are very appealing in practice. By augmenting k-means with a simple, randomized seeding technique, we obtain an algorithm that is O(log k)-competitive with the optimal clustering. Experiments show our augmentation improves both the speed and the accuracy of k-means, often quite dramatically. The experimental result which has undertaken is regional criminal activities. Crime is an interesting application where data mining plays an important role in terms of prediction and analysis. Clustering is the process of combining data objects into groups. The data objects within the group are very similar and very dissimilar as well when compared to objects of other groups. In this model, the crime analysis on grouping by patterns based on rate of criminal activities on the regional basis. Most papers on the crime analysis is often under survey study, so this paper demonstrates the experimental result on improvised k-means clustering and traditional k means clustering for the regional crime analysis with distortion analysis for finding the optimized value for the k value in this iterative algorithm.
KEYWORDS: k-means clustering, randomized seeding, distortion analysis, regional criminal activities
I. INTRODUCTION
The Data mining techniques have higher influence in the fields such as, Law and Enforcement for crime problems, crime data analysis.Recent researches on these techniques link the gap between clustering theory and practice of using clustering methods on crime applications. Cluster accuracy can be improved to capture the local correlation structure by associating each cluster with the combination of the dimensions as independent weighting vector and subspace span which is embedded on it. The traditional k means clustering for crime analysis which is widely used for pattern detection on the rate of criminal activities on the regional basis. An enhanced efficient algorithm for the k means clustering is proposed for the criminal analysis. Crime incidents are reported per day is increasing significantly. The Department of police is the major organization of preventing crimes; it is very difficult to find a country without crime free society. The present society has also packed with various kinds of crimes. The Police department is responsible for enhancing security, the public became feel safety, maintaining order and keeping the silence. In this experiment we have under taken the two different datasets of two different police force, United kingdom and United states of America for the results to be proved in an efficient way.
II. RELATED WORK
in offender behavior. Extracted factors including frequency, seriousness, duration and nature have been used to compare the similarity between pairs of criminals by a new distance.
Crime Data Mining: Data mining is defined as the discovery of interesting structure in data, where structure designates patterns, statistical or predictive models of the data, and relationships among parts of the data. The data mining techniques is using for some results on crime mining. This technique is applied to study crime cases, which mainly concerned entity extraction, pattern clustering, classification and social network analysis. This method used to get the data of criminals by using frequency occurrence of incidents.
III. SYSTEM MODEL
The Crime Analysis System is an application used to find the pattern of crime rating for the locations in the dataset for the specified types of crime in the dataset based on the regional basis .The application is extensible for both the crime types to increase as well the records in the dataset for huge amount of the data. The System also provides the facility of choosing the two crime types for analysis among the dataset. The system gives graphical plots for analysis as well map view for analysis , these two visualization are introduced in the application portal of the system.
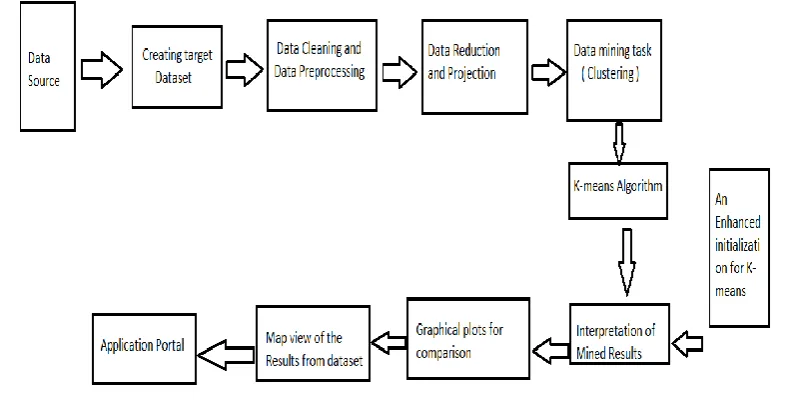
3.1 Architecture
Fig 1
.Data mining process
3.2 Creating target dataset
UK and USA police force to show the results with the experiments. Selecting a dataset, or focusing on a subset of variables, or data samples, on which discovery is to be performed
.
3.3 Data cleaning and Data preprocessing
Removal of noise or outliers. Collecting necessary information to model or account for noise.
Strategies for handling missing data fields.
Accounting for time sequence information and known change.
Data cleaning and Data preprocessing is done on the famous scripting tool called R which does the data cleaning of removing the outliers as well noise data in the dataset by box plotting the data in the set and remove the outliers and noisy data using R ,this data preprocessing can be using Apache hadoop as R uses the RAM space for the entire dataset but when it is done through hadoop it reduced the space as well time complexity.
3.4 Data Reduction and Data projection
To find useful features to represent the data depending on the goal of the task. Using dimensionality reduction or transformation methods to reduce the effective number of variables under consideration or to find invariant representations for the data.
3.5 Data Mining Task for Crime Analysis
The partition clustering methods primarily classified into K-means, AK-mode and Expectation-Maximization algorithms. The partitioning method constructs ‘k’ partitions of the data from a given dataset of ‘n’ objects. Data clustering is a process of putting similar data into groups. A clustering algorithm partitions a data set into several groups such that the similarity within a group is larger than among groups. Clustering can also be considered the most important unsupervised learning technique; so, as every other problem of this kind, it deals with finding a structure in a collection of unlabeled data. There are so many techniques used in clustering, in this paper only K-means algorithm is used.
3.6. K-means Clustering Algorithm
K-means algorithm mainly used to partition the clusters based on their means. Initially number of objects are grouped and specified as k clusters. The mean value is calculated as the mean distance between the objects. The relocation iterative technique which is used to improve the partitions by moving objects from one group to other. Then number of iterations is done until the convergence occurs.
K-means algorithm steps are given as Input: Number of clusters.
Step1: Arbitrarily choose k objects from a dataset D of N objects as the initial cluster centers.
Step 2: reassign each object which distributed to a cluster based on a cluster center which it is the most similar or the nearer.
Step 3: Update the cluster means, i.e. calculate the mean value of the object for each cluster. Output: A set of k clusters.
K-means algorithm is a base for all other clustering algorithms to find the mean values.
IV. PROPOSED MODEL
of data mining R scripting tool has a routine for the k-means which chooses the initial centers to be from random points of the data points. The K means has shortcoming for seeding the random initial centers which varies for different starts of the algorithm, The algorithm is the iterative approach hence the different starts will results differently.
4.1 An Efficient K-means Algorithm
1. Choose one center uniformly at random from among the data points.
2. For each data point x, compute D(x), the distance between x and the nearest center that has already been chosen. 3. Choose one new data point at random as a new center, using a weighted probability distribution where a point x is chosen with probability proportional to D(x)2.
4. Repeat Steps 2 and 3 until k centers have been chosen.
5. Now that the initial centers have been chosen, proceed using standard k-means clustering.
V. EXPERIMENTAL RESULTS
Crime analysis by two different dataset of UK police force and USA police force on the regional basis.
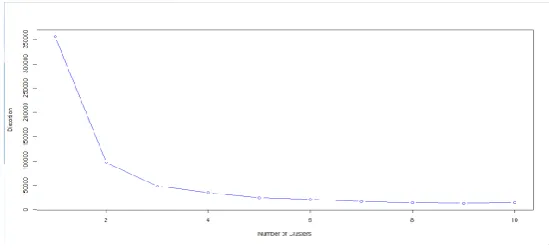
5.1 Finding the optimized value of K value
An optimal value of ‘k’ is the value which gives us a converged set of clusters with minimum distortion. Greater the distortion worse will be the clusters formed. The distortion can be calculated in terms of ‘withinss’ from each of the clusters. Lesser the value of ‘withinss’ of a particular cluster, more densely populated it will be, thus minimum distortion.Higher the value of ‘totwithinss’, greater will be the distortion.
Elbow Curve:
This is the plot between ‘k’, the number of clusters and the ‘totwithinss’ (or distortion) for each value of k. You can see when the number of cluster is less, there is a gradual decrease in distortion but as we keep on increasing the value of k, the rate of reduction of distortion values becomes constant. This value of k beyond which the distortion rate becomes constant is the optimal value. Here k=4.
Fig 2.Elbow Curve for k value Algorithm for the two different datasets and their cluster plots as follows
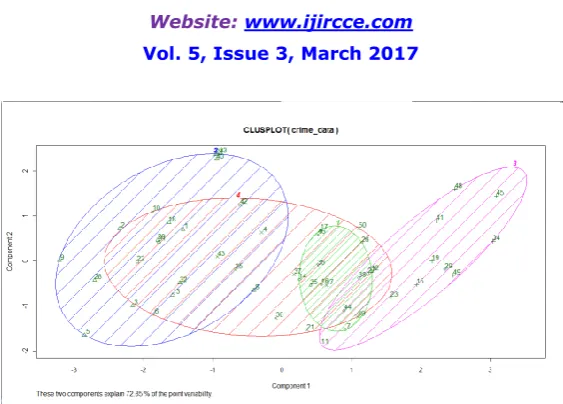
Fig 3.USA Crime dataset clustering (Clusplot)
UK Police Force is as follows which has k value as 4 and 31 observations with fifteen attributes which are typically the crime types of the region of United Kingdom.
Fig 4.UK Crime dataset clustering (Clusplot)
The above two plots for the two different datasets shows the varying plots ,so the cluster plots differs from the dataset to dataset with every start of the algorithm.
The following are the components of k-means algorithm are described by k-means function in R scripting. cluster A vector of integers (from 1:k)
indicating the cluster to which each point is allocated.
totss The total sum of squares. withinss Vector of within-cluster sum of
squares, one component per cluster. tot.withinss Total within-cluster sum of
squares, i.e. sum(withinss). betweenss The between-cluster sum of
squares, i.e. totss-tot.withinss. size The number of points in each
cluster.
iter The number of (outer) iterations. Ifault integer: indicator of a possible
algorithm problem – for experts. Efficiency Ratio = (between_SS / total_SS)
Dataset 1(USA crime dataset) Algorithm Efficiency Ratio
K-means 89.01% Kmeans(improvised) 90.1%
Dataset 2(UK crime dataset)
Algorithm Efficiency Ratio Kmeans 95.8% Kmeans(improvised) 96.5%
VI. APPLICATION PORTAL
VII. CONCLUSION
Thus the system proves an efficient clustering for the algorithm to cluster the data points as well provides interactive results and interactive interface for the user to make crime analysis of the criminal activities dataset, In future the scope of including more regions under one as well data preprocessing of huge data through Map and Reduce of Hadoop Environment can be extended. By this clustering we can analyze the data to be found patterns for crime rating in each particular location of the region is done.
REFERENCES
[1] D.E. Brown, "The regional crime analysis program (RECAP): A Frame work for mining data to catch criminals," in Proceedings of the IEEE International Conference on Systems, Man, and Cybernetics, Vol. 3, pp. 2848-2853, 1998.
[2]J. Mena, “Investigative Data Mining for Security and Criminal Detection”, Butterworth Heinemann Press, pp. 15-16, 2003. [3]. J. Han and M. Kamber, “Data Mining: Concepts and Techniques,” Morgan Kaufmann publications, pp. 1-39, 2006.
[4]. Nisha, Puneet Jai Kumar, “A Survey of Clustering Techniques and Algorithms” Second International Conference on Computing for sustainable Global Development (INDAICom), pp. 304-307, 2015.
[5]. Applications, Cluster analysis: https://en.wikipedia.org/wiki/Cluster_analysis#Applications
[6]. Stuart P. Lloyd. Least squares quantization in pcm. IEEE Transactions on Information Theory, 28(2):129–136, 1982.
[7].Arthur, D.; Vassilvitskii, S. (2007)."K-means++: the advantages of careful seeding" (PDF). Proceedings of the eighteenth annual ACM-SIAM symposium on discrete algorithms. Society for Industrial and Applied Mathematics Philadelphia, PA, USA. pp. 1027–1035.