MISSING DATA PROBLEM IN RANDOM ELECTROCARDIOGRAM SIGNAL PROCESSING
GAN THIAM YEE
A dissertation submitted in partial fulfillment of the requirements for the award of the degree of
Master of Sciences (Mathematics)
Faculty of Sciences Universiti Teknologi Malaysia
iii
Dedicated to
My supervisor, Dr. Ismail and
iv
ACKNOWLEDGEMENTS
First of all, I would like to express my greatest gratitude to Dr. Ismail Mohamad as my supervisor of this Dissertation who always being patient and guiding me in this study. Throughout my study, his guidance, suggestions,
inspirations and caring are the greatest contribution for me to keep on. Once again, I am appreciating to all his efforts on me.
v
ABSTRACT
vi
ABSTRAK
Pada asasnya, isyarat merupakan entiti yang menyampaikan maklumat dan isyarat bioperubatan adalah isyarat yang membawa maklumat tentang proses fisiologi organism. Isyarat elektrokardiogram (ECG) atau dikenali sebagai isyarat jantung adalah isyarat yang mengandungi maklumat mengenai aktiviti elektrik di dalam jantung. Oleh kerana isyarat fisiologi dihasilkan pada nilai yang rendah dan kemajuan peranti tidak mencukupi untuk mengesan nilai-nilai yang kecil ini dengan sempurna, isyarat ini sering terlepas dari pada rekod. Apabila gangguan isyarat belaku pada masa yang sama, isyarat mentah boleh dikatakan tidak boleh dipercayai untuk ditafsirkan secara langsung. Oleh itu, pemprosesan isyarat rawak diperlukan untuk mendapatkan isyarat setepat mungkin. Dalm kajian ini, kabarangkalian kehilangan isyarat telah ditetapkan kepada 0.1 pada nilai yang tinggi dan 0.3 pada nilai yang rendah. Hingar yang akan dikurangkan adalah hingar Gaussian dengan sifar min and sisihan piawai 0.01 mV. Beberapa kaedah telah digunakan untuk menganggar isyarat yang telah hilang, termasuklah imputasi min tunggal, imputasi min bersyarat empirikal dan pelicinan eksponen Holt-Winters. Untuk hingar
vii
CONTENTS
CHAPTER TITLE PAGE
DECLARATION i
DEDICATION iv
ACKNOWLEDGEMENTS v
ABSTRACT vi
ABSTRAK vii
CONTENTS viii
LIST OF TABLES xii
LIST OF FIGURES xiii
LIST OF ABBREVIATIONS AND SYMBOLS xv
1.0 INTRODUCTION 1
1.1 Background of the Study 1
1.2 Problem Statement 4
1.3 Objectives 6
1.4 Significance of the Study 6
1.5 Scopes of the Study 8
2.0 LITERATURE REVIEW 10
2.1 Introduction 10
2.2 Signals 11
2.2.1 Continuous-Time and Discrete-Time Signals 11
viii
2.2.3 Periodic and Aperiodic Signals 14 2.2.4 Casual and Non-casual Signals 15
2.2.5 Energy and Power Signals 16
2.2.6 Deterministic and Random Signals 18
2.3 Random Signals 19
2.3.1 Signal Sampling 19
2.4 Missing Data Problem 20
2.4.1 Data Reduction Methods 21
2.4.2 Data Completion Methods 21
2.5 Signal Noises 22
2.5.1 Gaussian Noise 23
2.5.2 White Noise 24
2.5.3 Coloured Noise 24
2.5.4 Impulsive Noise 24
2.5.5 Thermal Noise 25
2.5.6 Electromagnetic Noise 25
2.6 Heart 26
2.6.1 The Heart’s Electrical System 26
2.6.2 Electrocardiograph 26
2.6.3 Electrocardiogram Waveform 27
2.6.4 Resting Heart Rate 29
2.7 Random Numbers 30
2.7.1 Uniform Random Numbers 30
2.7.2 Gaussian Random Numbers 31
2.8 Cross-Correlation Function 31
2.9 Autocorrelation Function 32
2.10 Summary 32
3.0 METHODOLOGY 33
3.1 Introduction 33
3.2 Research Framework 34
3.3 Signal Sampling 36
ix
3.4.1 Simple Ordinary Least Squares Regression 37
3.5 Seasonality 39
3.5.1 Autocorrelation 39
3.6 Random Numbers 40
3.6.1 Uniform Random Numbers 41
3.6.2 Gaussian Random Numbers 41
3.6.3 Box-Muller Transformation 42
3.7 Noises Simulations 43
3.7.1 Gaussian Noises Generations 43
3.7.2 Normality Tests 45
3.7.2.1 Anderson-Darling Test 45
3.7.3 Root Mean Square Value 46
3.8 Missingness Mechanism Generations 47
3.8.1 Amplitude Indicator Function 47
3.8.2 Probability of Missingness 48
3.8.3 Missingness Indicator Function 49
3.9 Data Modification 50
3.10 Single Mean Imputation 51
3.11 Empirical Conditional Mean Imputations 52 3.12 Holt-Winters Exponential Smoothing 53 3.13 Finite Impulse Response Wiener Filter 54
3.13.1 Cross-Correlation Function 55
3.14 Comparison of the Methods 55
3.15 Summary 56
4.0 DATA ANALYSIS 58
4.1 Introduction 58
4.2 Data Descriptions 59
4.2.1 ECG Signal Trend Analysis 61
4.4.2 ECG Signal Seasonality Analysis 63
4.3 Data Processing 64
x
4.3.3 Data Missingness Proportion 67
4.4 Single Mean Imputation 68
4.5 Empirical Condition Mean Imputations 73
4.6 Holt-Winters Exponential Smoothing 78
4.7 Comparison of the Methods 81
4.8 Summary 83
5.0 CONCLUSIONS 84
5.1 Introduction 84
5.2 Conclusions 84
5.3 Recommendations 86
REFERENCES 87
xi
LIST OF TABLES
TABLE NO. TITLE PAGE
Table 4.1 Analysis of seasonal length by autocorrelation function. 64 Table 4.2 The ECG estimation results of single mean imputation. 69 Table 4.3 The filter processing results of single mean imputed ECG
signals. 72
Table 4.4 The results of empirical conditional mean imputation and
FIR Wiener filter. 75
Table 4.5 The results of Holt-Winters exponential smoothing and
FIR Wiener filter. 80
xii
LIST OF FIGURES
FIGURE NO. TITLE PAGE
Figure 1.1 Diagram of Blood Circulatory System. 2 Figure 1.2 Simple illustration of the human heart structure. 3 Figure 2.1 Examples of continuous-time signals. 12
Figure 2.2 Example of discrete-time signal. 12
Figure 2.3 Example of analog signal. 13
Figure 2.4 Examples of digital signals. 13
Figure 2.5 Examples of periodic signals. 14
Figure 2.6 Examples of aperiodic signals. 14
Figure 2.7 Example of casual signal. 15
Figure 2.8 Example of non-casual signal. 15
Figure 2.9 Example of anti-casual signal. 16
Figure 2.10 Examples of energy signals. 16
Figure 2.11 Examples of power signals. 17
Figure 2.12 Examples of deterministic signals. 18
Figure 2.13 Example of random signal. 19
Figure 2.14 Normal distribution probability density function with
mean zero. 23
Figure 2.15 A complete cycle of ECG waveform. 28
Figure 3.1 Research Framework. 35
Figure 4.1 ECG with 5120 readings in 20.476 seconds from online physiological database,
http://physionet.org/physiobank/database/#ecg.
60
xiii
Figure 4.3 Simple linear regression result of ECG signal by Minitab
16. 62
Figure 4.4 The autocorrelation function plot of the ECG signal with
5119 lags. 63
Figure 4.5 The waveform plot of 2000 ECG signal readings sample. 65 Figure 4.6 Corrupted ECG observation with signal missingness. 65 Figure 4.7 Result of Anderson-Darling test on generated noise by
Minitab 16. 66
Figure 4.8 ECG signal waveform imputed by the overall mean. 68 Figure 4.9 ECG signal waveform imputed by the complete sample
mean. 68
Figure 4.10 ECG signal waveform imputed by the incomplete sample
mean. 69
Figure 4.11 Filtered ECG signal which imputed by the overall mean. 70 Figure 4.12 Filtered ECG signal which imputed by the complete
sample mean. 71
Figure 4.13 Filtered ECG signal which imputed by the incomplete
sample mean. 71
Figure 4.14 Graph of conditional mean based on observed signal. 73 Figure 4.15 ECG waveform imputed by the conditional means. 74 Figure 4.16 Filtered ECG signal which imputed by the conditional
means. 75
Figure 4.17 Cycles of ECG Signal. 76
Figure 4.18 Waveform of ECG signal conditional mean. 77 Figure 4.19 ECG waveform estimated by Holt-Winters exponential
smoothing. 79
Figure 4.20 Filtered ECG signal which estimated by Holt-Winters
xiv
LIST OF ABBREVIATIONS AND SYMBOLS
AV - Atrioventricular
- Anderson-Darling Statistics - Amplitude Indicator Function
bpm - Beat per minute
- Trend Component of Time Series ECG - Electrocardiogram
- Frequency
FIR - Finite Impulse Response
- Estimated Signal from Missing Signal
- Basis Vector of Filter Function
- Matrix of filter function - Null Hypothesis
- Alternative Hypothesis
Hz - Hertz
- Missingness Indicator Function - Level Component of Time Series
- Number of Low Value Observations - Number of High Value Observations MAE - Mean Absolute Error
MAR - Missing at Random
MCAR - Missing Completely at Random
mV - Milli-volt
- Generated noise
xv
- Probability of Missingness for Strong Signal - Probability of Missingness for Weak Signal RMSE - Root Mean Square Error
- Matrix of cross-correlation for and - Matrix of autocorrelation for
- Seasonal length
SA - Sinoatrial
- Seasonal Component of Time Series - Time index
- Uniform Random Variable - Uniform Random Variable
- Sequence of Uniform Random Numbers - Root Mean Square Voltage
- Sequence of Observed Signal - Sequence of Real Signal
- Estimation of Real Signal
- Standard Gaussian Random Variable - Standard Gaussian Random Variable - Regression Parameter of Intercept - Regression Parameter of Gradient - Probability of Missingness
- Sum of Squared Error
μV - Micro-volt
1
CHAPTER 1
INTRODUCTION
1.1 Background of the Study
Based on the definition of Lathi (2009), Meade and Dillon (1991), a signal can be viewed as a set of data or information in the form of measurable quantity. Most of the time, signals are the functions of dependent on time, such as biomedical signal, speech signal and econometrics signal. However, the definition of signal is not only restricted in this, signals are not necessary be the functions of time always. They can be function of space, like electrical charge distributed over a body or images over a two-dimensional surface. In general, biomedical signals carry
information in several forms which reflect the nature and activities of physiological processes (Rangayyan, 2002). They can be hormones and neurotransmitters as biochemical form, potential and current as electrical form or pressure and temperature as physical form.
2
software; an algorithm that computes the output signal with the given input signal. Signals are naturally come along with noises, the undesired components or
disturbances. In biomedical signal, the noise can be physiological interferences, such as muscle contraction interference which usually are due to the body movement or external factors like electromagnetic signal from power cable and electrical stimuli. In reality, these factors are most likely unavoidable.
The blood circulatory system is a system of blood flow for humans and animals. It consists of three major parts, the heart, the blood and the blood vessels in organism. Humans are made of up many tiny cells, which every single cell need oxygen and nutrients to survive and work. Other than that, waste products from cellular activities like carbon dioxide will be transported away from the cells, then from body by blood. The main function of blood circulatory system is to provide continuous blood flow in the body and to ensure the blood reach each cell in the body (Houghton, 2007).
3
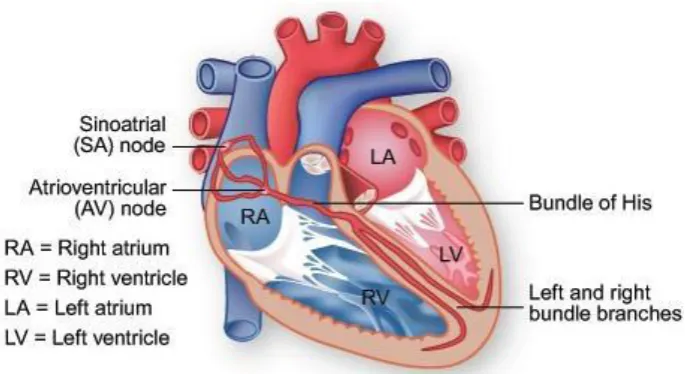
The heart is one of the important organs for most of the multicellular life forms. It contracts to pump the oxygenated blood along with the nutrients throughout the body, so that the basic requirements of cellular activities are fulfilled. Cardiac signal or electrocardiogram (ECG) signal generate as the heart contracts and relaxes, then record by electrocardiograph. It describes the electrical activities of the heart. Since every normal and complete cycle of ECG are coming from a heartbeat, the heart’s activities can be observed from the ECG signal, and heart conditions such as diseases or abnormalities can be identified easily by analyze the shape of the ECG signal.
Figure 1.2 Simple illustration of the human heart structure.
4
In most cases, the ventricles have larger and thicker muscle wall compared to the atria and the left ventricle is around three times thicker than the left ventricle. The thicker muscle wall can contribute to higher pressure exertion. It is because atria just have to pump the blood to ventricles but the ventricles need to pump the blood to other parts of body through the blood vessels. Besides, there are valves prevent the blood flowing backward. The atrioventricular valves prevent blood flow form ventricles to atria and the semilunar valves ensure the blood flow away from ventricles to the vessels.
Statistical data analyses are important as it is widely applied in various fields. However, Watanabe and Yamaguchi (2004) mentioned that data collection methods are not always ideal. Sometimes, it makes the data collection rate lower than the initially expected one. Sörnmo and Laguna (2005) proposed, for some reasons, it appears that missing data problem do occur in signal processing as well. Thus, methods to deal with these missing values problems have been developed. Traditionally, the methods to overcome the problem are simply ignoring the existence of the missing data or substitute the missing data with the mean of the collected data. Nowadays, there are several algorithms to estimate the parameters or the values of the process for various forms of data incompleteness.
1.2 Problem Statement
5
Physiological systems are dynamic, that is, they are interacting with each other, in various ways like feedback and collateral effects. Since organs other than the heart can release electrical signal, signals from some other organs act as noises that corrupt the ECG signals generated by the heart while the heart signal is the only interested signal. In addition, external interferences such as power cables of the ECG device also contribute in reducing the quality of the desired ECG signals.
Commonly, the magnitudes of biomedical signals are generated at a very low level, millivolt or even microvolt at their sources. Of course, ECG is one of the low level magnitude signals. Sensitive transducers and devices are required to record such signals. When the instruments are not capable to detect all the signals especially the low amplitude signals, missing signals will occur. As missing data are also possible in signal analysis, the raw signals obtained can be unreliable.
When both factors above are considered, it is obvious that biomedical
researchers always have the problem in separating the noise and signal and retrieving the missing signals to obtain an accurate ECG signals for the purpose of biomedical diagnosis and treatment (Catalano, 2002). Without a good approach, analysis of an inaccurate signal might lead to a wrong conclusion. It must not be tolerated as this is a matter of life and death, a little inappropriate judgment or action might cause death.
In the fields of statistics, there are many choices of statistical software for the data analysis. In recent years, the developments of these software tools are rapid and have provided conveniences in analysis and process of data for anyone as long as they own a personal computer. Yet, these tools are only designed to handle complete data. Even though there are some statistical packages provide missing data
6
Based on the problem statements mentioned earlier, the following research questions can be formulated:-
1. What is the optimal method to deal with corrupted ECG signal with missing signals?
2. How to restore the ECG signals that are corrupted by noises and missing signals?
1.3 Objectives
From the problem statements above, the following are the objectives of the study:-
1. To identify an optimal algorithm to deal with missing ECG signal problem. 2. To evaluate the performance of imputations and exponential smoothing
that deal with missing data problem in signal. 3. To estimate the de-noised ECG with missing data.
1.4 Significance of the Study
Through this study, the results are helpful in the development of biomedicine field, or more precisely, the biomedical signal analysis. A filter can be defined as a noise removal tool and its major function is to obtain the signal as true as possible. Analyzing signal filter is important because a good filter can remove a high
7
While dealing with noise, the study also tackles the missing signal problem. When the number of subject increases, the missing data is more probably to occur. The traditional methods like ignoring the missing data and mean imputation are not always a suitable approach to conduct analysis of signal with missingness as missing signals are not always occurred at random. Simply ignoring or guessing the signal values, might lead to a incorrect results and hence, a biased justification (Watanabe and Yamaguchi, 2004).
Since ECG is the graphical recorder of the electrical activities of heart over the period of time, it is important that the ECG have a good filter to reduce the noises and a suitable algorithm to deal with missing signals. An accurate cardiac signal is important to reveal many information of the heart, such as its rhythm, conduction abnormalities or enlargement of the chambers because the heart is an important organ for humans and all animals. Information of the heart, especially the heart of patients with heart diseases is significant for diagnosis, therapy and treatment control. Hence, the ECG should be able to extract correct information about one’s heart.
8
1.5 Scopes of the Study
The study mainly focuses on reducing noise from biomedical signal with missing data. In this study, the biomedical signal that was studied is the ECG signal. Apart from that, the study also covered the application of mean imputation and multiple imputations on missing ECG signal estimation. The ECG data was also modelled and estimated as seasonal time series, by Holt-Winters Exponential Smoothing. Then, comparisons were made on the estimation results and estimation performance.
The ECG data used in the study are adopted from the online database, http://physionet.org/physiobank/database/#ecg. The ECG data used was categorized in the MIT-BIH ECG Compression Test Database (cdb) section with data code 11442_01 in the online database. The ECG data taken from the database are complete, that is, there are no any missing data occurred and it is assumed has no noise, in simpler word, it is clean. The ECG last for 20.476 seconds and consists of 5120 reading values in total and measured in millivolt (mV). Then, the frequency of the ECG can be determined in Hertz (Hz) and it is obvious that the ECG sampled at the frequency of 250 Hz. Yet, the ECG signal data are not fully utilized, a sample of 2000 readings was drawn from 0:05.188 second to 0:13.184 second for the purpose of study. According to Sörnmo and Laguna (2005), the low values of the signals have higher tendency to missing. So, it can be concluded that, most of the ECG signals is probably missing as most of the sample is low value.
9
and standard deviation 0.01. These random numbers were generated in 2000 terms at six significant figures. In the views of the biomedical signals, frequency of the noise in the study is 250 Hz, same as the frequency of the ECG signal sample. Other than that, the classification of missing data that was studied is the not missing at random (NMAR) case. Since the missingness mechanism is not random, the missingness mechanism will be generated. For simulation purposes, a set of four significant figures uniform distributed random numbers will be generated from RANDOM.ORG as well. The uniform random numbers generated as the missing signal threshold. The missing signal probabilities are set to 0.3 and 0.1 for low amplitude and high amplitude signals respectively. Then, the data from the sample will be
87
REFERENCES
Baken, R. J. and Olikoff, R. F (2000). Clinical Measurement of Speech and Voice. (2nd ed.). San Diego: Singular Publishing Group.
Bourne, R. (2010). Fundamentals of Digital Imaging in Medicine. London: Springer-Verlag.
Bowman, K. P. (2006). An Introduction to Programming with IDL: Interactive Data Language. London: Elsevier Inc.
Catalano, J. T. (2002). Guide to ECG Analysis. (2nd ed.). Philadelphia: Lippincott Williams & Wilkins.
Chaudhuri, S., Pawar, T. D. and Duttagupta, S. (2009). Ambulation Analysis in Wearable ECG. New York: Springer.
Etten, W. C. V. (2005). Introduction to Random Signals and Noise. Chichester: John Wiley & Sons Ltd.
Gentle, J. E. (2003). Statistics and Computing: Random Number Generation and Monte Carlo Methods. New York: Springer.
Guerrero, A. P., Mailhes, C. and Castanié, F. (2007). Lost Sample Recovering of ECG Signals in e-Health Applications. Proceedings of the 29th Annual
88
Houghton, G. (2007). Blood: The Circulatory System. New York: The Rosen Publishing Group, Inc.
Huff, J. (2006). ECG Workout: Exercises in Arrhythmia Interpretation. (5th ed.). Ambler: Lippincott Williams & Wilkins.
Katz, A. M. (2011). Physiology of the Heart. (5th ed.). Philadelphia: Lippincott Williams & Wilkins.
Lathi, B. P. (2009). Principles of Linear System and Signal. (2nd ed.). New Delhi: Oxford University Press.
Longford, N. T. (2005). Missing Data and Small-Area Estimation: Modern Analytical Equipment for the Survey Statistician. New York: Springer.
Madisetti, V. K. (Ed.) (2010). The Digital Signal Processing Handbook: Digital Signal Processing Fundamentals. (2nd ed.). Boca Raton: CRC Press.
Meade, M. L. and Dillon, C. R. (1991). Signals and Systems: Models and Behaviour. (2nd ed.). Dordrecht: Kluwer Academic Publishers.
Pierce, D. A. (1978). Seasonal Adjustment when Both Deterministic and Stochastic Seasonality are Present. In Zellner, A. (Ed.) Seasonal Analysis of Economic Time Series. (pp. 242-269). Washington, D. C.: Bureau of the Census.
Rangayyan, R. M. (2002). Biomedical Signal Analysis: A Case-Study Approach. Piscataway: IEEE Press.
Reddy, T. A. (2011). Applied Data Analysis and Modeling for Energy Engineers and Scientists. New York: Springer.
89
Rumsey, D (2006). Probability for Dummies. Indianapolis: Wiley Publishing, Inc.
Sherwood, L. (2013). Human Physiology: From Cells to Systems. (8th ed.). Belmont: Cengage Learning.
Smith, S. W. (2003). Digital Signal Processing: A Practical Guide for Engineers and Scientists. Burlington: Elsevier Science.
Sörnmo, L. and Laguna, P. (2005). Bioelectrical Signal Processing in Cardiac and Neurological Applications. San Diego: Elsevier Academic Press.
Telford, W. M., Geldart, L. P., Sheriff, R. E. (1990). Applied Geophysics. (2nd ed.). New York: Cambridge University Press.
Watanabe, M. and Yamaguchi, K. (Eds.) (2004). The EM Algorithm and Related Statistical Models. Basel: Marcel Dekker, Inc.
Warner, R. M. (1998). Spectral Analysis of Time-Series Data. New York: The Guilford Press.
Whitfield, J. (1995). Electrical Craft Principle Volume 1. (4th ed.). London: The Institution of Electrical Engineering.
Vaseghi, S. V. (2000). Advanced Digital Signal Processing and Noise Reduction (2nd ed.). Chichester: John Wiley & Sons Ltd.