Abstract
SCHERTEL, STACEY LEE. DATA MINING AND ITS POTENTIAL USE IN TEXTILES: A Spinning Mill. (Under the direction of Dr. George Hodge and Dr. William Oxenham)
The purpose of this research has been to understand the possible uses of data
mining in the Textile Industry, specifically a spinning mill. There is a lot of information
published on the theory of data mining, however there is not a lot published on its use in
a manufacturing setting. A case study approach was used to help understand how data
mining could be used in the manufacturing of textiles. The focus of this research was on
a spinning mill in the textiles industry and the processing that is followed with the
different data elements available.
Data was collected from a spinning mill operation and then cleansed and merged
to create a data warehouse that could be mined using the SAS Enterprise Miner software.
An example ideal data warehouse was created for a spinning mill. In this
warehouse the different elements and formats that are needed were listed for each process
in the production of a cotton fiber.
Initially a simple data mining process was used however this proved to be
ineffective. Due to the successes and failures that were experienced during the research a
new data mining process model was created. This model has six major steps, which
contains a total of 28 specific activities that may be included in the data mining process
model. The proposed model describes how data mining can be implemented in a
DATA MINING AND ITS POTENTIAL USE IN TEXTILES: A Spinning Mill
by
Stacey L. Schertel
A dissertation submitted to the Graduate Faculty of North Carolina State University
in partial fulfillment of the requirements for the degree of
Doctor of Philosophy
Textile Technology Management
Raleigh, North Carolina
2002
APPROVED BY:
________________ ___________________
Dr. George Hodge
Dr. William Oxenham
Co-Chair
Co-Chair
________________ ___________________
Dr. Nancy Cassill
Dr. Thomas HoneyCutt
Biography
Stacey Lee Schertel was born on July 23, 1973 in Woburn, Massachusetts. She
grew up in the neighboring town of Burlington, Massachusetts and attended the local
high school. She graduated in 1991. After completion of high school she decided to
attend the University of Rhode Island studying Textile Marketing. After two years she
transferred to North Carolina State University where she earned her Bachelor of Science
in Textile and Apparel Management. She graduated Magna Cum Laude in 1995.
L.L. Bean employed her directly following graduation. She worked there for two
years and two months. She went through several promotions at L.L. Bean. Upon leaving
her final title was Production Engineer. Her goals while at L.L. Bean had shifted and
therefore she found herself applying to the Master’s program at North Carolina State
University. She started her quest for a Master’s degree in the fall of 1997. She
completed this degree in the December of 1998. Beginning in 1999 the pursuit of a PHD
degree began. During both of these degrees, from 1997 to 2001, she held a research
assistantship at the College of Textiles, helping Dr. George Hodge and Dr. William
Oxenham on a project funded by the National Textile Center.
During the summer of 2001 she married Damon Dowell on Cape Cod where they
Acknowledgements
I would like to thank my co-advisors, Dr. George Hodge and Dr. William
Oxenham, for their guidance and input throughout my research work I would also like
to thank Dr. Nancy Cassill because without you I never would have gotten through the
A1 paper. I would also like to thank Dr. Thomas Honeycutt for his support and feedback
in my research work.
The author would like to thank the company that was willing to participate in the
research project. The time of the employees there and their willingness to assist in the
research was greatly appreciated. I would also like to thank Dr. Jerry Oglesby at SAS
Institute for his assistance in the actual mining expedition.
Finally, and above all else, the author would like to thank all her family members
and friends who supported her quest for her PHD degree. Without her husband Damon’s
constant support and loving words she may never have gotten through this degree. She
would especially like to thank her loving mother and father, Linda and Robert, and her
sister, Lisa, and her husband, Steve, for their support and encouragement. In addition she
would like to thank her “second parents”, Paul and Mary, for their words of
encouragement and loving advice when things were tough. A special thanks goes to her
new in-laws for their understanding, support and words of wisdom in the PHD process.
Without all of you, my extended family, this degree would not be possible. Finally,
thanks to Abercrombie and Sable for all their loving during this difficult time.
Table of Contents
List of Figures... viii
List of Tables ... ix
1.0 Introduction... 1
2.0 Literature Review ... 6
2.1 Introduction to Data Mining ... 9
2.2 Current Signification of Data Mining... 11
2.3 Requirements of Data Mining... 12
2.3.1 How to Condition the Data ... 13
2.3.2 Different techniques that can be included in data mining... 15
2.3.2.1 “Traditional” statistics ... 15
2.3.2.2 Neural networks ... 16
2.3.2.3 Decision trees... 16
2.3.2.4 Bayesian networks ... 17
2.3.2.5 Visualization ... 18
2.4 Where is Data Mining Being Used? ... 18
2.4.1 Customer Retention ... 19
2.4.2 Customer Acquisition ... 19
2.4.3 Customer Lifetime Valuation ... 20
2.4.4 Customer Segmentation... 20
2.4.5 Cross Selling ... 21
2.4.6 Response Remodeling... 22
2.4.7 Special Application... 22
2.5 Summary of problems Data Mining Solves... 23
2.6 Areas in Which Data Mining will Produce Good Results ... 23
2.7 Who are the Vendors?... 24
2.8 Steps in Data Mining ... 25
2.9 What is the Future of Data Mining? ... 25
3.0 Research Methodology ... 28
3.1 General Objectives of the Research... 28
3.2 Experimental Procedure... 29
3.3 Steps to the Data Mining Process and What These Entail... 30
3.3.1 Determine Company ... 30
3.3.2 Determine Software Package... 30
3.3.3 Collect Data ... 31
3.3.4 Condition Data... 31
3.3.5 Data Mine... 31
3.3.6 Make Decisions... 32
3.4 Set up of the Experiment... 32
3.5 Possible Outcomes of the Research ... 32
4.0 Data Quality... 39
4.1 Cleansing Process Phase 1... 42
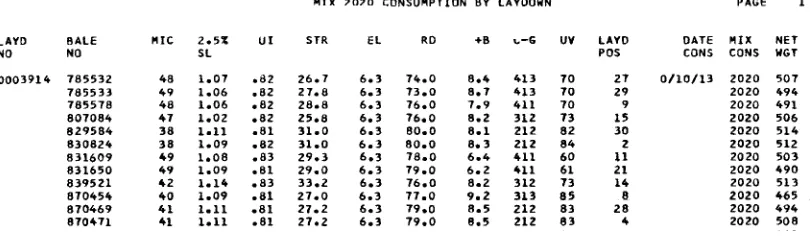
4.1.1 Bale Laydown ... 42
4.1.2 Carding... 46
4.1.3 Drawing... 46
4.1.5 Yarn... 50
4.2 Cleansing Phase 2 ... 51
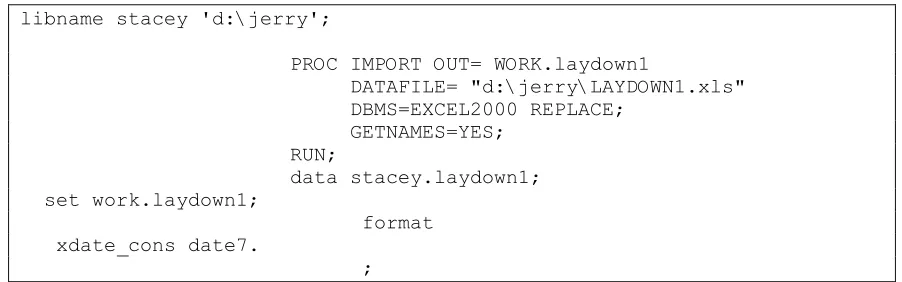
4.2.1 Laydown ... 52
4.2.2 Carding... 53
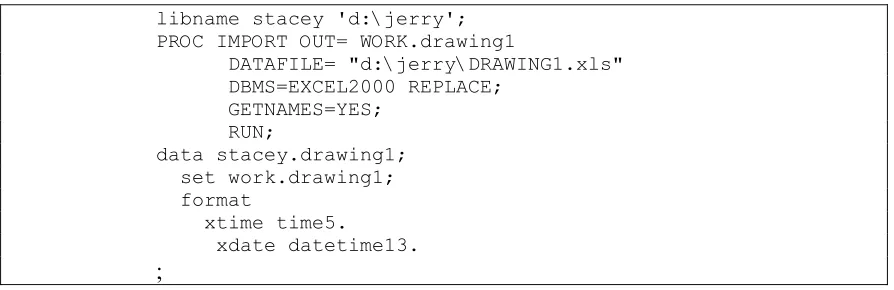
4.2.3 Drawing... 53
4.2.4 Open End Spinning ... 54
4.2.5 Yarn Data ... 55
4.3 Cleansing Phase 3 ... 55
4.3.1 Bale Laydown ... 55
4.3.2 Carding... 56
4.3.3 Drawing... 56
4.3.4 Spinning ... 57
5.0 Combining of Dataset to be Used in Enterprise Miner by SAS ... 58
5.1 Code for Laydown Dataset ... 58
5.2 Code for Drawing Dataset ... 59
5.3 Code for Spinning Data ... 61
5.4 Code for Yarn Data... 63
6.0 Analysis of Data Mining Using Enterprise Miner ... 66
6.1 SAS Enterprise Miner ... 66
6.1.1 Input Data Source Node... 67
6.1.2 Data Partition Node... 67
6.1.3 Variable Selection Node ... 68
6.1.4 Regression Node ... 68
6.1.5 Decision Tree Node ... 70
6.1.6 Neural Network Node ... 70
6.1.7 Assessment Node ... 70
6.1.8 Reporter Node... 70
6.2 Results... 71
6.2.1 Input Data Source ... 71
6.2.2 Data Partition ... 73
6.2.3 Variable Selection... 73
6.2.4 Regression... 74
6.2.5 Decision Tree ... 74
6.2.6 Neural Networks ... 76
6.2.7 Final Comments ... 76
7.0 Data Mining Process Model ... 79
7.1 Overview of the Model ... 80
7.2 Data Mining Process Model Phase explanations ... 83
7.2.1 Phase 0: Research ... 83
7.2.2 Phase 1: Company... 85
7.2.3 Phase 2: Collect Data ... 86
7.2.4 Phase 3: Condition Data ... 88
7.2.5 Phase 4: Data Mine ... 90
7.2.6 Phase 5: Make Decisions ... 92
7.3 Ideal Data Warehouse ... 94
7.3.2 Laydown Data... 94
7.3.3 Carding Data ... 95
7.3.4 Drawing Data ... 96
7.3.5 Spinning Data... 96
7.3.6 Yarn Data ... 97
8.0 Conclusions and Recommendations for Future Studies ... 99
8.1 Conclusions... 99
8.2 Future Studies ... 102
9.0 References... 104
Appendices... 109
Appendix A: Cotton Classification... 110
Appendix B: Spinning Mill Layout with Lag Times... 112
Appendix C: Another View of Lags ... 113
Appendix D: Spreadsheet of AFIS Data Collected ... 114
List of Figures
Figure 3.1: Steps to be Completed for this Data Mining Project... 29
Figure 3.2: Different Data Collected within a Spinning Mill ... 33
Figure 4.1: Flow of Data obtained through the Spinning Mill ... 40
Figure 4.2: Original Data Set from Bale Laydown (Non Summarized) ... 43
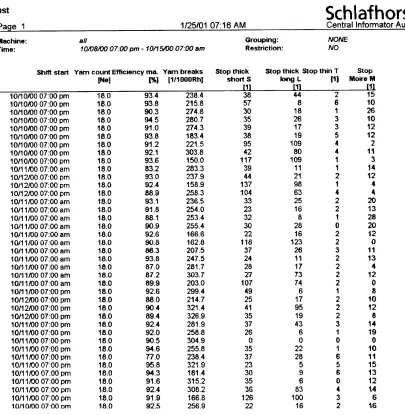
Figure 4.3: Schlafhorst Spinning Data Week Summary... 49
Figure 4.4: SAS Code for Converting Date for Laydown Data... 52
Figure 4.5: SAS Code for Converting Date for Drawing Data... 53
Figure 4.6: SAS Code for Converting Date for Schlafhorst Data... 55
Figure 4.7: SAS Code for Converting Date for Yarn Data... 55
Figure 5.1: Laydown Code for New Data Variable... 59
Figure 5.2: Code for Drawing Regeneration... 61
Figure 5.3: Code for Schlafhorst – Spinning Data... 63
Figure 5.4: Building Rows of Yarn Data ... 63
Figure 6.1: SAS Enterprise Miner Diagram for the Research Conducted... 66
Figure 6.2: Percentages of Yarn Breaks Allocated... 74
Figure 6.3: Decision Tree Model Assessment Plot... 75
Figure 6.4: Decision Tree Model... 75
Figure 6.5: Neural Network Optimization Plot Results... 76
Figure 7.1: Initial Six-Step Process for a Data Mining Project ... 79
Figure 7.2: Six-Step Process for a Data Mining Project... 80
Figure 7.3: Schertel Data Mining Process Model... 81
Figure 7.4: Step Representation... 82
Figure 7.5: Flow Chart Representation... 82
List of Tables
Table 2.1: Data Mining Vendors Compared... 24
Table 4.1: Current systems in the chosen plant ... 41
Table 4.2: Bale Laydown Summarized Data Transferred to Excel ... 44
Table 4.3: Cleansed Excel Spreadsheet of Bale Laydown Summarized Data... 44
Table 4.4: Bale Laydown Data with Additional CV% columns... 45
Table 4.5: Uster Sliver Data Shift Report... 47
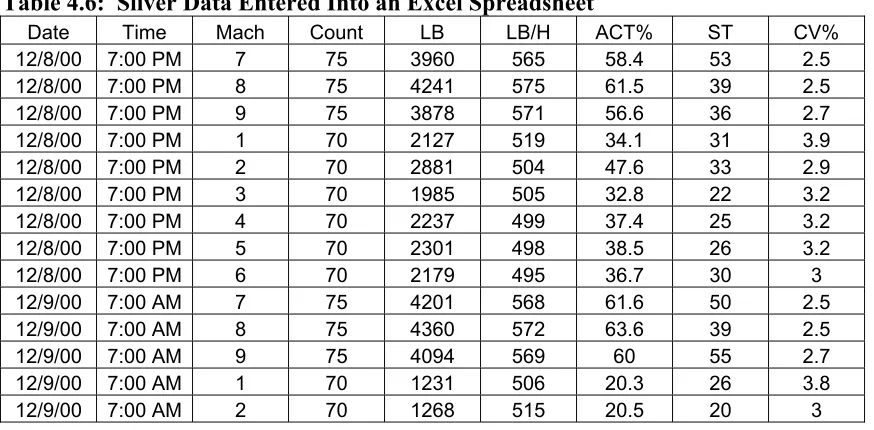
Table 4.6: Sliver Data Entered Into an Excel Spreadsheet ... 48
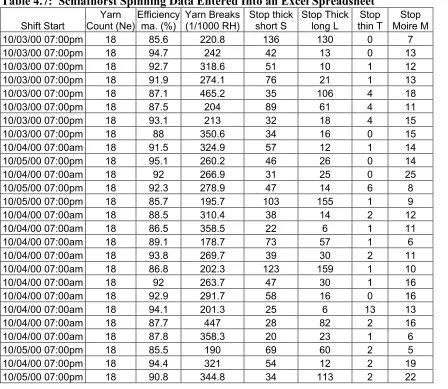
Table 4.7: Schlafhorst Spinning Data Entered Into an Excel Spreadsheet ... 50
Table 4.8: Yarn Dataset Example ... 51
Table 5.1: Final Format of the Data Collected ... 64
Table 5.1 (continued): Final Format of the Data Collected ... 65
Table 6.1: Input Data Source Variables... 71
Table 6.1 (continued): Input Data Source Variables ... 72
Table 6.2: Breakdown of Variables ... 73
Table 6.3: Variable Selection Examples... 73
Table 7.1: Chart of Current Data Systems and Collection of Data... 87
1.0 Introduction
In the information technology age that has emerged in the last 10 to 20 years,
industries have seen an influx of data that is “generated”, but for the most part not fully
utilized. In the textile arena this is certainly the case according to the literature available
on the subject, very little is written about textiles and data mining. In most mills the data
is used for day-to-day evaluation of how a plant is running. Printouts are reviewed to see
how the plant is performing, but this data is not used any further.
The purpose of this research is to understand how data mining can be used in
Textiles to sift through the massive amounts of data that are being produced each day in
this industry to help make more informed decisions. A case study approach will be used
in this research, specifically a spinning mill will be evaluated.
As can be seen in the literature review section of this dissertation, there is
information based on theory available on this topic. However, in all of the literature that
is available there is very little that discusses how data mining can be used in a
manufacturing setting. There are examples of how data mining has worked for customer
related industries like: fraud detection, insurance, hotels and many others. However, the
information that is published does not really explain how the process works. In some
cases it describes the process as a black box. The data is inputted and then the outcomes
or nuggets of information are outputted from the system. The literature leads individuals
to believe that it is as an easy task with no real work involved. The main difference
between customer oriented and manufacturing data is that in customer related industries
databases have already been established however; the databases still need to be cleaned.
be determined, production time lags need to be established and the overall database needs
to be created. These types of issues will be discussed in this dissertation along with a new
process model that has been produced to help manufacturing environments mine their
data. Some topics that can be the focus of a data mining project are: what raw material
is appropriate for the end product that is being produced, is the equipment efficient, and
how is the process performing to create an quality end product.
In Chapter 2 the literature review discusses the basics about data mining. Various
definitions of data mining are presented and it is apparent from this review that there is
some ambiguity as to the “definition” of data mining. Applications of where data mining
has been used are reviewed. The techniques that are present in data mining software
packages are discussed. The vendors and their software packages and techniques are
compared and the overall process steps are exposed.
Chapter 3 covers objectives of the research. In this chapter the purpose of the
research and how the goals of the project will be accomplished are shown. In this chapter
there will also be information about the facility that was chosen for the analysis and how
it runs. The process used to mine the data, which will be followed for this research, will
also be explained. The research hypothesis that is hoped to be proven is laid out to help
get a better understanding of what data mining might show from the manufacturing data.
Chapter 4 shows the cleansing process for this case study. In this chapter the
different issues that were faced will be shown to help get a feel for what must be
accomplished if data mining is to be used. It can be seen in this section that it is not a
simple process nor is it a short process. At the beginning of this chapter a glossary of
In some cases there will be a full definition while in others the abbreviation will simply
be explained.
In Chapters 5 and 6 the actual effort of mining the data will be shown and then
discussed. In the first of the two chapters the analysis using the chosen software package,
Enterprise Miner – SAS, will be explained. In chapter 6 the results will be discussed and
explained. Chapter 7 will introduce the Proposed Data Mining Process Model with
explanations on how it is organized. In this section there will be five Phases. Each phase
will show what must be completed to move on to the next phase of the process. Finally
the conclusions of the research will be stated in Chapter 8 along with suggestions for
Glossary
“Classification Tree is a decision tree that places categorical variables into classes” [57].
Clustering uses algorithms to help distinguish groups that are similar in nature [57].
Cross selling is determining whether a customer, who has already purchased certain articles, is likely to acquire others (and in what combinations)[22].
Customer lifetime valuation is based on repeat purchases, dollars spent or longevity. From this data mining a company can predict who will become their most valuable customer [22].
Customer segmentation determines what the common characteristics are about their customers. Data mining can help to determine whether they fall under identifiable groups [22].
Data Cleansing is the process of ensuring that all information in datasets are consistently and correctly inputted [59].
Data mining is an analytical tool, a computer software package that is used to sort through data to determine trends, relationships or profiles.
“Data Visualization is the visual interpretation of complex relationships in multidimensional data” [59].
Data Warehouse is a computer based storage system enabling massive quantities of data to be pooled with easy accessibility in a way that is consistent with the organizations’ needs [21].
Decision Trees are tree shaped structures that represent sets of decisions. These decisions generate rules for the classification of a dataset. Such methods include: Chi Square Automatic Interaction Detection (CHAID), Classification Regression Trees (CART) [59].
Missing Data is data that was missed either because it was not measured, not answered, it was unknown at the time, or it was lost [59].
2.0 Literature Review
Data mining is an analytical tool, a computer software package that is used to sort
through data to determine trends, relationships or profiles [47]. Why should business use
this technology? In today’s environment of constant changes and new technologies, it is
important to understand what the drivers and enablers are of the industry. Drivers are
what forces an organization to change while the enablers help the organization to
accomplish the actual change. Data mining is not the only driver and enabler present in
an organization, it is only one, among many others in today’s changing world. Data
mining can be considered an enabler because of the need to analyze data to make a
company more competitive in the marketplace. The enabler is the means to implement
data mining techniques and these are becoming increasingly more technically advanced
in new technologies like databases and visualization techniques [8]. The driver of data
mining is what comes out of the process of data mining that helps managers make
decisions. “Knowing your customers, what they want and need is what tops the priority
list for most businesses today” [27] and because of this, data mining is very important for
a company to be competitive. The notion of data mining has become more important
over the course of time due to the enormous amounts of data that are created in today’s
business environment. Traditional manual approaches are ruled out because they can no
longer perform the analysis in a timely fashion. Humans can deal with three to five
dimensions but when more than 10 are used it becomes much more difficult. This is
partly why it is important to develop new technologies that can handle this data [14].
Companies have discovered that the ability to derive knowledge from customer
raw data in today’s business environments. What there is a shortage of is how to use this
data to be more competitive and in making products more appealing. It is also important
for a company to use the data obtained from the process in a timely fashion. For
instance, if the manufacturer of your product takes one week from start to finish, it would
be imperative to have quality information about this product while it is still being
produced. The information is no longer helpful to producing a quality product after it has
been completed, shipped and already arrived and is on the shelf at your customer’s
facilities. If it takes two months for the statistician to find trends about this data, then in
most cases it is too late to save that company from possible disaster. However, if a data
mining tool can look at the data during the process and show that similar trends have
resulted in defective product then this would be valuable information to the producers
and possibly save them a lot of money and retain customers’ loyalty.
Some of the applications of data mining are in customer retention, customer
acquisition, customer lifetime valuation, customer segmentation, cross selling, response
modeling and other special niche applications like National Basketball Association
scouting. In the textile industry today most of the articles that have been written are
showing data mining being used for forecasting, production planning, promotion and
distribution. However, for the most part this is only done at the retail level. Very little
has been found at the manufacturing end of the textile industry. One example is in the
production of mono-filament nylon fibers. In this data mining case the company used
classification and regression trees to help determine spin breaks during production [30].
The analysis utilized data that was available from both on and offline measurement and
however a very different production process is followed for a natural fiber versus that of
the man-made nylon fibers.
Some of the various definitions of data mining offered are as follows:
• In "Solid State Technology", data mining is defined as “a methodology that finds hidden patterns in large sets of data to help explain the behavior of one or more response variables” [46].
• Jacobs defines data mining “as a process of analyzing data to extract information not offered by the raw data alone” [21].
• Davis says that “data mining uses mathematical algorithms to search for patterns within large volumes of data that are related to business issues. Data mining is a way of discovering hypotheses not verifying them. It also takes human skill to interpret the results accurately. It is thought that data mining is not only a science but also an art” [10].
• DuMouchel says that “a common task of data mining is to search for associations within large databases” [13].
• Hand describes data mining as “a new discipline, lying at the interface of statistics, database technology, pattern recognition, and machine learning, and concerned with the secondary analysis of large databases in order to find previously unsuspected relationships which are of interest or value to the database owners” [19].
• “Data mining gives you the ability to sift through thousands of potential variables to isolate key variables that are highly predictive” [25].
• The SAS organization has defined data mining as “the process of selecting, exploring, and modeling large amounts of data to uncover previously unknown patterns of data for business advantage” [47].
• Alexander says that “data mining is the next step beyond online analytical processing (OLAP). It sifts through data for unknown relationships” [1].
• The University of Birmingham’s Computer Science website has defined data mining as “the nontrivial extraction of implicit, previously unknown, and potentially useful information from data. It uses machine learning, statistical and visualization techniques to discover and present knowledge in a form that are easily comprehensible to humans” [48].
• “Data mining is the use of an appropriate set of technologies to exploit patterns of information from massive customer focused databases. However, data mining is not a single technology. Rather, it is a collection of tools that are used to extract information from data. Data mining is not just a technology but it is also a process. It cannot be fully automated as individuals must be active in the process to be sure that the information that is extracted is accurate. In other words the results must be relevant and meaningful to the business [15].
Data mining is therefore a way to analyze the enormous amounts of data that is
being generated in today’s industries to find trends and relationships that were not
previously known to exist. The main reason this new technology works is because of the
high-powered computers that are available today at a reasonable price coupled with
sophisticated software. Also with the Internet we are able to get more data points than
what was ever possible in the past. In the new environment of the world wide web and
order processing on line there is an extreme amount of data that can be obtained. While
at the same time it can be transmitted from computer to computer with minimal time and
effort.
Aspects that must be considered in data mining are:
• Who uses different data and information? (e.g. do different levels of workers from the mill floor to senior management need access to the same information?)
• What format is the data in? (can be obtained from different monitoring systems and can be in different end formats such as: Excel, Word, or only printable formats)
The rest of the chapter reviews the current state of the art of this analytical tool.
2.1 Introduction to Data Mining
Data mining is an analytical tool, usually implemented using a computer software
package, that sorts through data to determine trends, relationships, or profiles. Specific
data mining tools consist of existing statistical models for traditional statistical analysis
[1,15,17,25,36,41,42,46,53,56,58], bayesian networks [25,6], visualization [15,58] and
tree based models [1,15,17,25,36,41,42,46,53,56,58]. Many of the applications that are
used to data mine are from statistical methods that have been around for years. However,
the main difference in today’s data mining technology as opposed to old methods is that a
high-speed computer is used to find trends and relationships in large amounts of data in a
minimal time frame. Without computer and optimized software a traditional statistical
analysis of the same data may take an individual month to come up with the same
answer, if they ever find the same relationship. The reasoning for this is that data mining
can easily find predictive trends and relationships while at the same time they are making
a sweep through the data to find hidden patterns all in the same step. This data mining
finds hidden trends with minimal time and effort.
A data warehouse is a computer based storage system enabling massive quantities
of data to be pooled with easy accessibility in a way that is consistent with the
organizations’ needs [21]. A data warehouse facilitates the storage and the organization
of the data so that it may be readily accessed. Data warehouses became available in the
early 1990’s. Data warehouses do not sort the data into useful trends, relationships or
profiles; it is just a database filled with potential information. It is the use of techniques
such as data mining that allows us to sort through the data to research information. In
order to acquire the data for the data warehouse, it is important to identify what data is
required and where it currently resides. Many times the data that is required will be on
different systems and therefore these are all in different formats. This necessitates the
use of a cleansing process prior to moving the data into the storage phase. Once the data
the analysis, which reveals trends that enable management to answer business questions
based on stored data. In order to develop links between data and/or groups of data
according to some specified parameter, it is necessary to use specialized software, of
which data mining performs a particular function. According to W.H. Inmon, the creator
of the term data warehouse, “a data warehouse is a centralized, integrated repository of
information, which means data is cleaned up, merged and redesigned. This can be more
or less complicated depending on where all the data is being fed in from one or many
different systems” [33].
2.2 Current Signification of Data Mining
Ernst and Young conducted a survey on where data mining is being used and
what types of data are being stored in data warehouses in 1999. It was found from the
companies that were surveyed, 62% are currently mining data. If the company revenues
were less than $5 billion, there was a change in this figure. In companies of this size, 63%
of them said they have no plans of using data mining. Conversely, of companies that have
revenues greater than $5 billion, 75% of them say they are currently data mining. The top
three types of information that are stored in the warehouse are: sales (88%),
merchandising (84%) and financial information (72%) [45]. However there is also
information stored about planning/forecasting (56%) and operational performance
information (54%). These data warehouses are used currently for more broad decision
making instead of tactical solutions. Companies look to their data warehouses for query
and reporting analysis, executive decision-making, and regional performance reporting
The META Group also did a survey on data mining. They surveyed, in 1999, any
company that currently has data warehouses to see if these companies also plan to
purchase data mining tools. Of the companies surveyed, 54% of them said that they do
plan to purchase data mining and knowledge discovery tools this year. This is a 20%
jump since 1996. However, only 8% of those that were surveyed are currently using data
mining software [26]. These numbers seem to be fairly low, the main reason for this is
the simple fact that it has not been proven yet as a viable solution. Companies selling
data mining tools have not yet established themselves as leaders in the field and therefore
companies interested in possibly using these types of products are skeptical. Data mining
will not grow until customers are convinced that it will improve business [33].
While there seems to be a disparity in the results of these surveys, there are
several possibilities why this may be so. Each survey questioned different companies,
the questionnaire may have had very different questions, or the timeframe of the actual
survey may have caused enough difference in the mind frames of those companies
questioned. However, from the articles there is no obvious justification for the
difference in results.
2.3 Requirements of Data Mining
Data mining requires that a database is present, which can also be referred to as a
data warehouse, and a software package.
Requirements for data mining are as follows:
• data availability
• efficient access methods
• robustness to data problems
• efficient algorithms
• high performance application server
Other requirements of data mining are that the data must also be “cleaned” to help
eliminate getting false signals due to outliers [46]. It is important to know what the plans
for the data are before trying to set up a data warehouse effectively. If the right data does
not exist and the limitations of the data are not known then the software can lead
companies and people astray [37]. As Alexander says in his article, “garbage in, garbage
out.”
2.3.1 How to Condition the Data
In a business environment it has been stated that whomever controls the critical
information can then leverage them to create profitability [38]. The idea of collecting
this information and using it is not a new one. However, there are new techniques
available to do this for instance, data warehouses, data marts and then mining the data to
make critical decisions that have been made before without the knowledge from
analyzing, massaging and delivery useful information from otherwise unconnected raw
data [38]. Examples of how to do this are discussed further in the following paragraph.
The first line of defense to receive quality data is to be certain that at the data
entry stage of the process all fields have been inputted completely and correctly. If this is
done then it may help to eliminate the likelihood of receiving bad data. This is the easiest
stage at which to correct data because it is still fresh in the mind and once this data works
its way downstream it will take much more time and effort to correct errors. In some
cases it might be important to narrow the range of the data that is being entered and to use
integrity constraints. For instance, if a survey has answers of only 1 to 5, an integrity
constraint will ensure that no other answer can be entered. As with a spell or grammar
it is not misspelled, the spell checker will not pick it up and therefore it is not correct but
it still exists. This is the same for data entry. An individual can by mistake enter a 2,
which is in the 1 to 5 range, although it should really be a 3. This would be considered an
error and depending on the magnitude of this error it may or may not be caught. For
instance, if looking at a disparity in the results of entering a 2 when it should be a 2.1 this
probably would not be caught but if it should be a 2 and a 3 is entered this may show up
in the results as an outlier. It is not uncommon for there to be inconsistencies or holes in
the data. This often requires the use of some standard default values for the cleansing
process. An example of this would be the color “000” on an item that has no color.
Because color was not used for the product, it may be blank or hold zeros in some
systems. If this color code does not exist in the color description table, then the cleansing
process should have instructions such as loading a description of “Unknown Color” or
“No Color”. It is important to have default mechanisms so that there are no voids in the
data even when there is nothing to enter into that particular field. For instance, if there is
a blank in the data field then there was no data. For example, perhaps there was no
inspection on that particular day. However, if there is a “0” in the field then the value is
“0”. These are two totally different values and should be looked at this way. The blank
should not be assumed to be a “0” value [38].
It is extremely important that the data being collected is quality data. This means
the data is accurate, complete and relevant. If this is not the case then the data is not
useful to the business. Bad quality data will give false signals. How can a business
really be sure the information collected is quality data? There is no way to ensure that
needed to answer the “question” the company wants to answer. For instance, if I want to
know how many students are from India then the nationalities of the students must be
contained in the data. No matter what it is still important to cleanse the data or a correct
“answer” still will not be found [38]. The data that is stored in the data warehouse needs
to be cleansed and de-duplicated. This all needs to be done in a repeatable cycle whether
it be hourly, weekly or monthly [39].
2.3.2 Different techniques that can be included in data mining
Han states that present mining models lack human involvement and user control.
It is believed that data mining is most effective when the computer searches large
databases or counting [18]. However, there are many techniques that are involved in data
mining that mix human involvement in a computer environment quite extensively in the
world of statistics. Some of the techniques that are incorporated in data mining software
packages will be discussed in this section of the dissertation.
2.3.2.1 “Traditional” statistics
Traditional statistics includes such things as: regression, cluster analysis and time
series forecasting. Regression is usually used when for building predictive models that
forecast some outcome and generate a mathematical algorithm [42]. It can be used when
dichotomous (yes/no) variables are being predicted. It is also used to analyze continuous
ratio measures such as revenues or profits [42]. Cluster analysis is the process of
separating a data set into components that reflect consistent patterns. The clustering of
data into sets allows for the data to be put into understandable profiles. This is used
sending a new catalog. Time series analysis is the comparison of time periods for
instance, year to year or month to month.
2.3.2.2 Neural networks
It is claimed that “neural networks are not true data mining” [46], it is only a way
of modeling the relationships. Neural networks do not find hidden trends or relationships
within the data. The real use of the neural network is to model large amounts of data in a
physical model [46]. However, another source says that neural networks are the most
common data mining technique. This technique generalizes patterns inside the database
for classifications and predictions [5]. Neural networks are used quite extensively in the
financial industry because these tend to only model and predict trends [16]. Neural
network algorithms quantify only and because of this these are not appropriate to use on
qualitative data. It is best to only use neural network algorithms for data that is
quantifiable. Neural networks are very good at detecting non-linear relationships and are
also good at combining information from many input parameters. Therefore neural
networks work well when the predictors are partially redundant [15]. Some consider
neural networks to be programs that mimic the brain’s ability to learn from its own
mistakes [1]. Neural networks are therefore non-linear models that learn through training
and they closely resemble biological networks. These work best on small to medium
datasets. The main issue with Neural networks is that they are considered to be the black
box operation because there is no way to get an explanation of what happened in the
process and because of this it inhibits the confidence about the final results.
2.3.2.3 Decision trees
A decision tree is the process of taking the data and constructing a tree that
by nodes, which signify the data it represents. Decision trees are tree shaped structures,
like a family tree, that represent sets of decisions. By completing the different steps in
making the decision tree a basic set of rules are generated. Decision trees are useful for
several different reasons they are very good at detecting non-linear relationships. They
are good at selecting important variables and therefore work well when many of the
predictors are irrelevant. Basically decision trees are branching systems that show
relationships in the form of a hierarchy, such as an organizational chart [1]. The major
advantage is that they are faster and more understandable than neural networks.
However, since the methodology uses “if-then” statements to categorize the data it is
important for the data to be either categorical or interval. All continuous data needs to be
put into categorical data. For instance, if States in the United States are chosen then 50
different columns would be needed that list all the States and only one of these columns
would have a yes while the rest would be no’s. This type of data can cause problems
because of all the extra data that is not needed to get the same answer.
2.3.2.4 Bayesian networks
Bayesian networks are similar to decision trees in that these are also branching
structures. However, each circle or node, is a probability of the one that precedes it. In
other words one event is conditional on the probability of the event that was before this
event. The Bayesian network is based on the Bayesian Inference Theorem. All of the
probabilities within this network are conditional. These specify the degree of belief in
Bayesian networks and decision trees can detect hidden relationships and trends
within large amounts of data. These are capable of discovering new relationships and
therefore these are true data mining techniques [46].
2.3.2.5 Visualization
Visualization is a technique that is used to make it possible for the analyst to get a
deeper understanding of the data. It is often difficult to analyze data when it is in rows
and columns so visualization is key to understanding vast amounts of information.
Visualization is a way to see the trends and profiles easier. Visualization uses graphical
tools to illustrate the data relationships this can range from a simple scatter plot to
complex multidimensional representations. In other words a picture is worth a thousand
words or in this case data points.
2.4 Where is Data Mining Being Used?
The major acceptance of data mining is in insurance, health care providers,
finance, credit card companies, telephone companies, retail and marketing processes
[1,15,25,26,47,58]. Data mining is also currently in hotel, catalog, supermarket, rental
car, the Internet or E-Commerce, and airline industries [15,25,26,47,58]. These industries
use data mining through frequent shopper, flier or rental card clubs (marketing programs)
to determine customer’s preferences. From this data, they can decide what promotional
fliers can be sent to a particular customer. The main reason these industries are using
data mining is because they have large quantities of data on customers, products and
transactions and need to be able to understand the value within this information [1]. They
are looking for behavior patterns, preference patterns, any relationships that are not
sift through is simply too overwhelming [15]. Some of the current applications of data
mining are briefly discussed below [22].
2.4.1 Customer Retention
It has been determined in different studies that to acquire a new customer can cost
a company between 4 and 10 times that of keeping a current customer [15]. This is the
driving force behind the loyalty programs that many companies institute. Many loyalty
programs reward customers for their continued business. Basically, the premise behind
this is that if a customer is happy they will continue to give that company business. If for
instance the customer gets no discount or free gift from one company they may be less
likely to purchase there if they can get free stuff or discounts from one of the companies
competitors [15, 22, 26, 42, 47]. Another dimension of customer retention is cross
selling. This will be discussed in more depth later in the dissertation.
2.4.2 Customer Acquisition
Although customer retention is critical to an organization it is also important to acquire
new customers. Attracting new customers is what helps the organization grow. The
main issue with this is how to acquire customers efficiently. For instance, it is not
profitable to send a sale catalog of kids’ products to families that do not have children.
The costs of acquiring a customer are astronomical so it is a necessity to find a way to
obtain customers with as little cost to the company as possible. It is important to profile
and segment customers to better understand them. By profiling the customers that are
already loyal they can determine what segment of the population that is most likely to
buy products from them in the future. From this companies can start to focus their future
essential to market towards customers that would more likely be interested in your
products than those that are not in order to acquire a new customer proficiently [15, 22,
26, 42, 47].
2.4.3 Customer Lifetime Valuation
Customer lifetime valuation is based on repeat purchases, dollars spent or
longevity [22]. From this data mining, a company can predict who will become their most
valuable customer. A company can also use this to help get their customers to purchase at
a higher level [42]. Banks use the information that is generated from data mining to
determine who their most profitable credit card customers are or possibly their highest
risk loan applicants [1]. It can also be used to detect fraud, trend analysis and analyzing
profitability. NeoVista Solutions has a knowledge discovery technology that helps
retailers leverage store and customer level data to uncover important sales patterns and
consumer preferences. The patterns that are determined from this system are then
transformed into models to help improve targeting [2].
2.4.4 Customer Segmentation
Customer segmentation determines what characteristics are common to their
customers [26]. Data mining can help to decide if they fall into identifiable groups [22].
Data mining is used to help companies better create a more successful marketing strategy.
Data mining techniques can be used to identify or target markets, determine what the
needs and wants of the customers or businesses in these markets are, and give the
marketing strategists valuable information from which intelligent information can be
derived. It is a way for companies to help retain customers by using loyalty programs.
individual’s wants and needs [4]. Data mining tools do not ensure a successful marketing
plan but it does greatly enhance the probability of a successful one [42]. An insurance
company in California used IBM’s software to mine data about sports car owners. The
insurance company was able to extract information about a group of sports car owners
that were in the age group of 30 – 50 years old, married and owned two cars. From this
data mining expedition, the insurance company decided that this group was not high risk
and was able to offer a better rate to their customers that fit this profile. The real
importance of this is to identify the not so obvious and offer something their competitors
are not [10].
2.4.5 Cross Selling
Cross selling is a further dimension of customer retention. Cross selling is the
expansion of products sold to a customer. The additional products are somehow related
to other products that should go together. Historical data is used to determine which
kinds of products are typically bought in conjunction with each other. If, for example, an
individual were to purchase three particular products will they also be likely to purchase
additional products X and Y (both) or maybe only X. This is a technique of selling
additional products or services to existing customers. For example, if an individual
purchases a printer they are probably also likely to purchases paper for that printer. In
other words it is a linkage between different products. The customer retention side of this
comes into play when the company knows what the customer typically purchases and
therefore sends them fliers about additional items that may be discounted when
clients in order to data mine it to find a trend in the purchasing behavior of their
customers [15, 22, 26, 42, 47].
2.4.6 Response Remodeling
Catalog companies also use a technique similar to data mining to help them
decide what customer should or should not receive a particular catalog. If a customer
never orders from the summer catalog, then the company should not waste their time and
money continuing to send catalogs to that customer when there could be another potential
customer who may spend hundreds of dollars if they received the same catalog. This can
be referred to as response modeling. Response Modeling can help in identifying a
community as a retirement one and then not send any ads out that would be for back to
school sales since these would be ineffective [20]. At the same time, they’re using data
mining tools to help ”drill” through a data warehouse to help seek trends and form
hypotheses based on the character of the data. This is something that was thought to be an
impossible task. It also helps to see if any profiles have changed [20]. Other companies
are using this type of software to help establish point of sale trends that may have been
overlooked otherwise [6]. Some companies are using point of sales forecasting to help
accurately determine sales at the store level [24].
2.4.7 Special Application
IBM has created a program that specifically mines data for NBA (National
Basketball Association) scouts. It is called the Advanced Scout. It will find patterns in the
massive amounts of statistical data from games and condenses it into useful pieces of
of the players which helps coaches to learn more about their players and their opponents
[3].
2.5 Summary of problems Data Mining Solves
Data mining has been used to overcome a wide range of business issues and
problems. Some of the problems include how to:
• Segment customers accurately into groups with similar buying patterns.
• Profile customers most effectively for individual relationship management.
• Dramatically increase response rate from mailings.
• Profile customers to help identify which ones have been the most loyal or are the most likely to respond to certain promotions.
• Understand what motivates customers to leave a company for its competitor.
• Uncover factors affecting purchasing patterns, payments and response rates.
• Predict whether a credit card transaction or an insurance claim will be fraudulent.
• Predict whether credit card customers are likely to transfer their balances to another company within some given timeframe.
• Anticipate customers’ future actions, given their history and characteristics.
• Help medical centers and insurance companies better manage costs by determining which combination of procedures will produce the most favorable outcomes [15].
2.6 Areas in Which Data Mining will Produce Good Results
As with any new technology there are always doubts about whether or not it is
suitable for any particular circumstance. While no technology will answer every business
problem, data mining can be useful for certain things. Data mining is successful at
solving problems with these characteristics:
• Have vast amounts of data available,
• The data consists of many variables,
• Need to predict behavior or outcomes,
• Must find associations and relationships that are not currently understood.
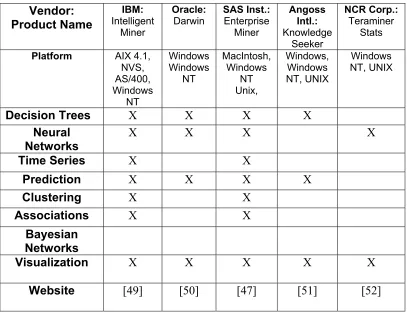
2.7 Who are the Vendors?
IBM: Intelligent Miner, Oracle (Thinking Machines): Darwin, SAS Institute:
Enterprise Miner, Angoss International: Knowledge Seeker, and NCR Corporation:
TeraMiner Stats are the most recognizable data mining vendors. Other vendors, who are
not as recognizable in the literature but they also offer packages for data mining include:
DataMind, Pilot Software, Business Objects, NeoVista Solutions, Magnify and Cognos
[16].
Table 2.1 shows the major players, the platforms their product functions on and
what types of techniques are present in their data mining software products.
Table 2.1: Data Mining Vendors Compared
Vendor: Product Name IBM: Intelligent Miner Oracle:
Darwin SAS Inst.:Enterprise Miner Angoss Intl.: Knowledge Seeker NCRCorp.: Teraminer Stats
Platform AIX 4.1, NVS, AS/400, Windows NT Windows Windows NT MacIntosh, Windows NT Unix, Windows, Windows NT, UNIX Windows NT, UNIX
Decision Trees X X X X
Neural Networks
X X X X
Time Series X X
Prediction X X X X
Clustering X X
Associations X X
Bayesian Networks
Visualization X X X X X
2.8 Steps in Data Mining
In order for data mining to be successful it is important that it is thought of as a
process rather than a set of tools. Therefore it is important that there are steps to follow
in the process, and these are as follows:
Step 1: Must have a representative sample of the data that will be explored both statistically and visually. This means that the data that will be collected and then mined must be identified.
Step 2: Apply exploratory statistical and visualization techniques to select and transform the most significant predictive measures. This means that data is sampled to explain visually or numerically any inherent trends or groupings.
Step 3: Model the measures to predict outcomes. At this stage the data is explore both visually and/or numerically for trends and relationships.
Step 4: Test the results to be sure the model is accurate.
Step 5: If needed change the data that is being selected/collected to help focus the model selection process. Changing the data refers to the modification of the data to help focus the model selection process. In some cases it may be apparent that some absent fields in the data set need to be added or deleted.
Always remember that data mining is an iterative process so these steps must be
continually used [15].
2.9 What is the Future of Data Mining?
Some believe that the long-term prospects of data mining are truly amazing.
There are thoughts about data mining being used on medical research data or on
subatomic-particle information. It is thought that maybe computers can reveal new
treatments for diseases or new insights on the nature of the universe [11]. In an article by
Regalado, the use of data mining to find answers to diseases is starting to take shape. It is
also stated that data mining is going to be a core part of drug discovery in the future [32].
human genome to help reshape how a new medicine is discovered. The hope is to find
cures easier and more efficiently. It is felt that even miscellaneous bits of trivia can be
turned into power [28].
In an article by Kittler, he states that there must be a better “cleaning” of the data
being placed in the data warehouse in order to use it for data mining [25]. He also states
that at this time, he does not feel that data mining technology is ready for manufacturing
uses. He feels that data mining must have as a starting point derived models that
physically relate the association of the various components. There seems to be an
opportunity to significantly increase the rate at which volumes of data generated by the
manufacturing process can truly be turned into useful information [25].
It is felt that the manufacturing use of data mining is just beginning and, because
of this, it is the time to determine how useful data mining will be in the manufacturing of
Textiles. This research will outline the current status and future prospects of data mining
in textile technology. Some questions to answer would be:
• Is data mining necessary for a textile company to stay competitive (i.e. will it make a company better and more efficient than other textile companies)?
• What role could data mining play in the textile industry?
• How much, if any, is it being used today in this industry?
• How would a textile company get started in incorporating this into their business?
In closing it has been determined through this literature review that data mining,
in the sense of finding new trends and relationships that otherwise would not have been
found, has not yet be been done in the production of natural fibers in a spinning mill. It
has been done by using regressional analysis with statistical methods for instance
give to companies in the textile industry it cannot be verified for sure that it is not being
used presently; however, at this time it has not been documented in a spinning mill for
3.0 Research Methodology
In this chapter the objectives of the research will be presented. The following
subjects will be discussed:
♦ What were the research objectives
♦ How will this research be conducted and in what form
♦ What type of a facility will be analyzed and what does the set up of that company look like
3.1 General Objectives of the Research
The main objective of this research was to explore the data mining application
techniques in a textile environment. In this research a case study approach was used to
determine the potential benefits afforded by using data mining to analyze factors
affecting process and product quality in a spinning mill. Some questions that will be
answered are:
What roles could data mining play in the textile industry?
How much, if any, is data mining being used today in this industry?
How would a textile company get started in incorporating this into their business? (How does a company go about it)?
What is the process of data mining?
The ultimate purpose of this research was to enable the analysis of the plethora of
data that is collected from different monitoring and other data input systems. This
analysis provides concise information that can in turn be used to determine trends in the
spinning process. A prerequisite to success in this project is the development of a
standardized and documented process of how to combine the data generated from many
online and offline sources, which may be in different formats, into a useable database
3.2 Experimental Procedure
It was decided that this research would be conducted using a case study approach.
In this case one company’s data will be collected and then analyzed using a data mining
software package. The reason for a case study approach is that one can always derive a
plan to mine data in a manufacturing environment, but until this has been done there is no
way to really fully understand the possibilities of mining data. The reason for only
choosing one facility is because of the amount of time needed to clean data and mine it.
In the literature there are discussions about companies that take years to gather and clean
data in order to mine it [62]. The literature also discusses that it takes 80% of the time to
get the data ready for mining [26].
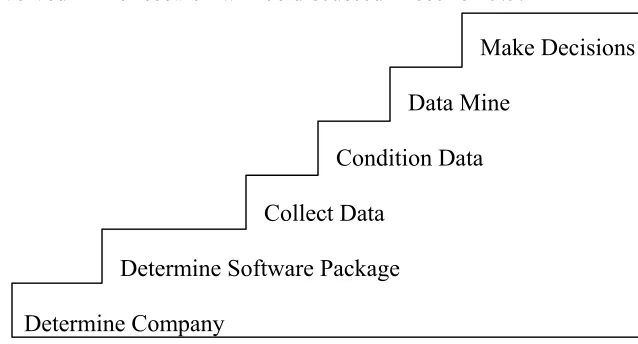
It will be imperative to work through this data mining process in steps. In
reviewing the literature it was determined that there should be a procedure to follow for
mining data. In this research the steps shown in figure 3.1, that were derived from
Thuraisingham’s process steps, were followed to help with the organization of this
research. The process begins at the bottom of the staircase and works its way upward.
What is involved in the research will be discussed in section 3.3.
Make Decisions
Data Mine
Condition Data
Collect Data
Determine Software Package
Determine Company
3.3 Steps to the Data Mining Process and What These Entail
3.3.1 Determine Company
The first step was determining what type of company to target by looking at
different options such as proximity of geographical location; likelihood of their
willingness to co-operate; which company already had available a significant source of
data? After reviewing what companies were available and willing to co-operate. It was
decided that a spinning mill would be the object of the research. At the present time
spinning mills are gathering data but it may be possible that the data that is being
collected is not useful. It is important to be able to understand and use the data that is
being generated by the many different monitoring systems in a mill. In many instances
companies are collecting data, but they may not be sure why they are collecting that
particular piece of data.
3.3.2 Determine Software Package
The first step of determining the company to study had been completed it was
now time to choose the software, step number two. This was not an easy task since from
the review of earlier research, it was determined that there are several different mining
software packages that could be used for this project. Each of these software packages
had there own strengths and weaknesses. Based on the information known about textile
companies it was decided to select SAS Enterprise Miner as the software to use.
However, the main reasoning behind the choice of SAS was that this software allows for
the data to be imported into their software directly from Excel. It was felt that this was
an important part of the user friendliness of the SAS software. The reasoning was that all
the data that is collected from any company can be downloaded into Excel, which is a
with a fairly simple macro. The other software package that was also considered was the
IBM Intelligent Miner. The main disadvantage of this software was that the user must
also learn DB2, their database software, which is very complicated and not user friendly.
Both software packages that have been mentioned were available for use from the
University and therefore availability of software was not a factor in the decision.
However, other software packages that were reviewed were not available and therefore
not in the final running.
3.3.3 Collect Data
The next step in this process is to acquire an actual data set that could be mined.
However, before this can be accomplished the following must be identified:
♦ What processes are involved in a spinning plant
♦ What systems generate the data
♦ What are the timeframes of the data
♦ What is the format of the data
See the beginning of Chapter 4 for an explanation of the plant in this research
study.
3.3.4 Condition Data
Once the data is collected then it will be conditioned or also sometimes referred to
as cleaned. In this case study since there are not earlier works to base the research on the
data will be cleaned/conditioned manually. In this approach it will be feasible because
only a few months of data will be utilized.
3.3.5 Data Mine
The next step of the process is to take the data that has been collected and cleaned
and then import it into the chosen SAS software package and mine the data. At this stage
utilized during the mining, for instance, neural networks, regression models and decision
trees.
3.3.6 Make Decisions
The data analysis will be conducted after the data warehouse has been created for
the data in the spinning mill. This data will be analyzed using Enterprise Miner Software
by SAS that was discussed in Chapter 2. Once this process has been completed then
decisions can be made about the usefulness of data mining in a manufacturing
environment specifically a spinning mill.
3.4 Set up of the Experiment
The data mining experiment was conducted on a Gateway computer with 500Mhz
Pentium III processor. The original datasets were in Excel 1997 by Microsoft before
being imported into SAS Enterprise Miner version 8.1. The whole SAS programming
system utilizes 814Mb of space on the C drive.
3.5 Possible Outcomes of the Research
The initial intention of this study was to examine relationships that are generally
accepted as true in order to verify that the data mining approach was giving valid links.
Once this is accomplished it will be used to search for new trends in the data that is
currently collected by the spinning mill. Some of the questions of this research are: is it
necessary to continue collecting this data? Is all the data important for the company to
find the answers to any manufacturing dilemma?
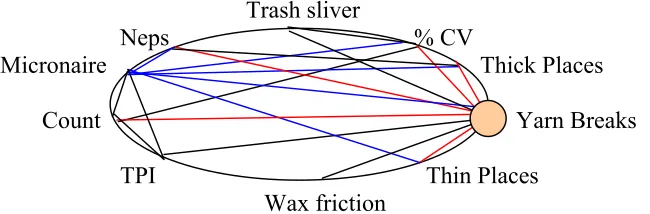
Figure 3.2 gives a conceptual example; this figure is purely what would be
considered to be “dream” results, of what might be the outcome of this research. In
combination of the two: the fiber information are the inputs while the quality information
can be viewed as outputs. From this diagram it is obvious that lots of parameters effect
yarn breaks. The real interest is that all of these factors can be actually independent of
yarn breaks but are influenced by another parameter which does impact breaks. In effect,
do one or more variables directly and indirectly influence this parameter? For example
in Figure 3.3 the illustration shows that yarn breaks may be influenced by thick places,
thin places, trash sliver, neps, count, etcetera shown by the black lines. However, on
closer inspection it can be seen that while micronaire has a direct impact on yarn breaks
micronaire also affects thin places, thick places, neps and % CV. Therefore, what may be
determined is that in fact micronaire is the key parameter. In essence, it may not be
necessary to gather data on thick places, thin places, % CV and neps, because they can be
inferred from a measuring micronaire (and if micronaire could be eliminated as a variable
then neps may have no effect on yarn breaks).
Trash sliver
Neps % CV
Micronaire Thick Places
Count Yarn Breaks
TPI Thin Places
Wax friction
Figure 3.2: Different Data Collected within a Spinning Mill
The following sections discuss the actual case study analysis and results, and
Glossary and Abbreviations of Terms in Spreadsheets Used in Chapter 4:
AVG: Average
WGT: Weight
S.E.: Single End
Elong: Elongation
Frict: Friction
T.P.I.: Turns per inch
V.L.C.: Variance length curve.
CV: Coeffiecient variance
% : Percentage
HVI: High Volume Instrument data
Laydown Spreadsheet Data Terms:
Layd #: Laydown Number: The incremental number used as an identifier for each 30 bale laydown that is consumed.
Bale #: Is the internally assigned bale number to insure unique file keys.
Bale Count: Number of bales in the laydown.
Layd Pos = Laydown Position: The bale position within the 90-bale laydown.
Mix Cons = Mix Consumption: consumption mix identifier.
Net Weight: Weight of the individual bale.
Mic = Micronaire: Weight per unit length of a fiber.
2.5% SL = 2.5% span length: Length at which only 2.5% of the fiber is longer than that length.
UI = Uniformity Index: Ratio of span length to mean length.
Str = Strength: strength of the fiber in g/Tex.
Rd = Colorimeter A: The level of grayness in the fiber.
+b = Colorimeter B: The level of yellowness in the fiber.
C-G = Color/Grade: Color grade that a classer would use to classify the fiber.
UV = Ultraviolet reading: This is the ultraviolet reflectance of the fiber.
Card Spreadsheet Data Terms:
Card Number: The value listed is the average of 5 readings from a sample. The date on the report is the date the samples were gathered. The samples are taken from the card mat and the delivered sliver.
Card: Machine number in the plant.
Nep Mat: Number of neps per gram entering the card (within the card mat).
Nep Sliver: Number of neps per gram in the card sliver.
Nep % Elim. = % Elimination: Percent reduction of neps at the card (Mat-Sliver)/100
Dust Mat: Number of dust particles per gram entering the card (within the card mat).
Dust Sliver: Number of dust particles per gram in the card sliver.
Dust % Elim. = % Elimination: Percent reduction of dust particles at the card (Mat-Sliver)/100
Trash Mat: Number of coarse trash particles per gram entering the card (within the card mat).
Trash Sliver: Number of coarse trash particles per gram in the card sliver.
Trash % Elim. = % Elimination: Percent reduction of coarse trash particles at the card (Mat-Sliver)/100
V.F.M. = Visible Foreign Matter: is a calculated value from the dust and trash readings.
V.F.M. Mat: Number of % visible foreign matter per gram entering the card (within the card mat).
V.F.M. Sliver: Number of % visible foreign matter per gram in the card sliver.