ISSN(Online) : 2320-9801
ISSN (Print) : 2320-9798
I
nternational
J
ournal of
I
nnovative
R
esearch in
C
omputer
and
C
ommunication
E
ngineering
(An ISO 3297: 2007 Certified Organization)
Vol. 4, Issue 4, April 2016
Visualization of Big Data with Hadoop
Swamil Singh1, Viplav Mandal2, Dr. Sanjay Srivastava3
Student, Department of Computer Science, MGM’s College of Engineering And Technology, Noida (UP), India
Professor, Department of Computer Science Department, MGM’s College of Engineering And Technology, Noida
(UP), India
ABSTRACT: Big data is large amount of data which is structured and unstructured form. Now it is handle by Hadoop that is open source product. In this paper take a website log files as a big data and visualize over them using Tableau business intelligence tool. Log files is contain information about time stamp, IP address, URL, swid, genders, country and state and so on. The log files comes from web server. By analyzing these log files gives a correct idea about the user. Hadoop is tool for refine the data and it is also provides large scale processing performance. Here using a Cloudera platform for refine the data. And Tableau trial version for visualize the data.
KEYWORDS: Hadoop, Cloudera platform, Business intelligence tool, Hive, Clickstream.
I. INTRODUCTION
Website log files is big data that contains IP address, Time stamp, swid, categories and country. Clickstream is record user clicking actions on the web. It is used to understand customer behavior on website. Here identify the most efficient path for a site visitor to search a product, and then purchased it. And which products do visitor tend to buy together, and what they are most likely to buy in the future. And last where should I spend resources the user experience on my website?Once I have combined these datasets, then used a visualization tool to analyzed that which customers is related to which country, states, city and so on and what they are looking for.
II. BACKGROUND
ISSN(Online) : 2320-9801
ISSN (Print) : 2320-9798
I
nternational
J
ournal of
I
nnovative
R
esearch in
C
omputer
and
C
ommunication
E
ngineering
(An ISO 3297: 2007 Certified Organization)
Vol. 4, Issue 4, April 2016
A. Data
Website log files is semi structured data and it is depend upon user behavior on website. Take the data from Hortonworks, for analysis and visualize purpose. Web logs contains information about Timestamp, URL, IP, Country, State, City and Categories.
B. Flume
Flume’s high-level architecture is built on a streamlined codebase that is easy to use and extend. The project is highly reliable, without the risk of data loss. Flume also supports dynamic reconfiguration without the need for a restart, which reduces downtime for its agents.
C. HDFS
HDFS is stand of Hadoop Distributed File System, which is storing and managing the large amount of data (terabyte & petabyte). Files are stored across multiple nodes. HDFS is break the large files into small fixed blocks. HDFS makes clusters of machines and correlate work among them. If any cluster have failed, Hadoop continuous the work without losing the data by shifting the works remaining machines in the cluster.
D. Hive
Hive is query procedure which is refine the data. Basically its uses SQL procedures to refine the data. Hive provides a SQL-like interface to data stored in DP (data platform).Hive because of its SQL like query language is often used as the interface to an Apache Hadoop based data warehouse. Hive is considered friendlier and more familiar to users who are used to using SQL for querying data.
E. Visualize
Visualize the refined data into business intelligence tool which we have used Tableau. Visualization is showing in graphical form. Tableau is tool of analysis and visualize the structured and semi structured data.
III. SCOPE OF RESEARCH
Now a days, data are very important for every organization for better communication between their clients and management of product for their business.
The main scope of this research paper is to analyze and visualize the data. Hadoop framework works very well with structured and unstructured data. This also support variety of data formats in real time such as XML, JSON and text based flat files format.
The main advantage for the organization with Hadoop is the increase in their productivity, manufacturing and sales based on Hadoop analysis and visualization. Hadoop analysis work perfectly with the business analysis tool to visualization of data individually related to the organizations to fulfill their product in the needy places based on the visualizations of every individual products.
IV. METHDOLOGY
In this experiment, use following tools to visualize the data from different sources:-
A. Data upload
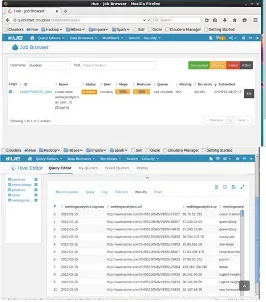
Downloaded the data from Hortonworks website. Then open the cloudera Hadoop platform after that open the hue in cloudera. Here worked on single node, saving the data in HDFS. Go to the HDFS manage and create the folder. Then upload the data from file browser in created folder.After that uploaded the rest data’s as same technique.
ISSN(Online) : 2320-9801
ISSN (Print) : 2320-9798
I
nternational
J
ournal of
I
nnovative
R
esearch in
C
omputer
and
C
ommunication
E
ngineering
(An ISO 3297: 2007 Certified Organization)
Vol. 4, Issue 4, April 2016
B. Refining data
In the previous uploaded the data in tables.Here create the new table of important column that need for analysis purpose then create the table of important column that is time stamp, ip address, url, swid, city, country, state. Finally created table that joins the website log data to the registered user data and products data
ISSN(Online) : 2320-9801
ISSN (Print) : 2320-9798
I
nternational
J
ournal of
I
nnovative
R
esearch in
C
omputer
and
C
ommunication
E
ngineering
(An ISO 3297: 2007 Certified Organization)
Vol. 4, Issue 4, April 2016
V. EXPERIMENTAL RESULT
Visualize the data into any business intelligence tool. Here we use the business intelligence tool is Tableau trial version. Here can analysis anything like country where mostly purchase the clothes and can see URL, IP addresses and so more. Dataset includes product data, so can display the product categories viewed by website visitors in each state.
This chart shows that the majority of men shopping for clothing on website are between the ages of 22 and 30. With this information, we can optimize our content for this market segment.
VI. CONCLUSION
ISSN(Online) : 2320-9801
ISSN (Print) : 2320-9798
I
nternational
J
ournal of
I
nnovative
R
esearch in
C
omputer
and
C
ommunication
E
ngineering
(An ISO 3297: 2007 Certified Organization)
Vol. 4, Issue 4, April 2016
VII. ACKNOWLEDGEMENT
We would like to thank Dr. Sanjay Srivastava for his most support and encouragement. He kindly read my paper and
offered invaluable detailed advices on organization, and the theme of the paper
.
REFERENCES
1. Priya Kale, Dr. Siddhartha Ghosh, Manoj Kumar Danthala, “Visualizing Website Clickstream Data with Apache Hadoop using Hortonworks”. 2. Randolph E. Bucklin and CatarinaSismeiro,”Click Here for Internet Insight: Advances in Clickstream Data Analysis in Marketing”.
3. Jishang Wei, ZeqianShen, Neel Sundaresan, Kwan-Liu Ma§,”Visual Cluster Exploration of Web Clickstream Data”.
4. RANDOLPH E. BUCKLIN, JAMES M. LATTIN, ASIM ANSARI AND SUNIL GUPTA, DAVID BELL, ELOISE COUPEY, JOHN D. C. LITTLE, CARL MELA, ALAN MONTGOMERY, JOEL STECKEL” Choice and the Internet: From Clickstream toResearch Stream”.
5. Sana Siddiqui Imran Qadri, “Mining Web Log Files for Web Analytics and Usage Patterns to Improve Web Organization”. 6.M. Vengateshwaran and E. V. R. M Kalaimani,“Web Mining Research Direction and Open Source Tools”.
7. L.K. Joshila Grace, V.Maheswari, Dhinaharan Nagamalai, “ANALYSIS OF WEB LOGS AND WEB USER IN WEB MINING”. 8. K. R. Suneetha, Dr. R. Krishnamoorthi, “Identifying User Behavior by Analyzing Web Server Access Log File”.
9. Arvind K. Sharma and P.C. Gupta,” ANALYSIS OF WEB SERVER LOG FILES TO INCREASE THE EFFECTIVENESS OF THE WEBSITE USING WEB MINING TOOL”.
10. Swamil Singh, Viplav Mandal, Dr. Sanjay Srivastava, “The Big Data analytics with Hadoop” 11. Swamil Singh, Viplav Mandal, Dr. Sanjay Srivastava,” The Big Data analytics with Hadoop: Review”. 12.http://fr.hortonworks.com/hadoop-tutorial/how-to-visualize-website-clickstream-data/.
13.http://fr.hortonworks.com/hadoop-tutorial/how-to-visualize-website-clickstreamdata/#section_3. 14. http://www.cloudera.com/downloads.html.
15. https://developer.yahoo.com/blogs/ydn/hadoop-future-bright-48231.html