Electronic Theses and Dissertations Theses, Dissertations, and Major Papers
2011
Combustion Phasing and Engine Performance of an HCCI Engine
Combustion Phasing and Engine Performance of an HCCI Engine
Utilizing Simulated Biomass Gas
Utilizing Simulated Biomass Gas
Dale Haggith University of Windsor
Follow this and additional works at: https://scholar.uwindsor.ca/etd
Recommended Citation Recommended Citation
Haggith, Dale, "Combustion Phasing and Engine Performance of an HCCI Engine Utilizing Simulated Biomass Gas" (2011). Electronic Theses and Dissertations. 190.
https://scholar.uwindsor.ca/etd/190
This online database contains the full-text of PhD dissertations and Masters’ theses of University of Windsor students from 1954 forward. These documents are made available for personal study and research purposes only, in accordance with the Canadian Copyright Act and the Creative Commons license—CC BY-NC-ND (Attribution, Non-Commercial, No Derivative Works). Under this license, works must always be attributed to the copyright holder (original author), cannot be used for any commercial purposes, and may not be altered. Any other use would require the permission of the copyright holder. Students may inquire about withdrawing their dissertation and/or thesis from this database. For additional inquiries, please contact the repository administrator via email
By
Dale Edward Haggith
A Thesis
Submitted to the Faculty of Graduate Studies
through Mechanical, Automotive and Materials Engineering in Partial Fulfillment of the Requirements for
the Degree of Master of Science at the University of Windsor
Windsor, Ontario, Canada
2011
by
Dale Haggith
APPROVED BY:
______________________________________________
Dr. E. Tam, Outside Department Reader Civil and Environmental Engineering
______________________________________________
Dr. J. Johrendt, Department Reader
Mechanical, Automotive, and Materials Engineering
______________________________________________
Dr. A. Sobiesiak, Advisor
Mechanical, Automotive, and Materials Engineering
______________________________________________
Dr. R. Barron, Chair of Defence
Mechanical, Automotive, and Materials Engineering
I hereby certify that I am the sole author of this thesis and that no part of this thesis has been published or submitted for publication.
I certify that, to the best of my knowledge, my thesis does not infringe upon anyone’s copyright nor violate any proprietary rights and that any ideas, techniques, quotations, or any other material from the work of other people included in my thesis, published or otherwise, are fully acknowledged in accordance with the standard referencing practices. Furthermore, to the extent that I have included copyrighted material that surpasses the bounds of fair dealing within the meaning of the Canada Copyright Act, I certify that I have obtained a written permission from the copyright owner(s) to include such material(s) in my thesis and have included copies of such copyright clearances to my appendix.
so called producer gas is investigated as a fuel for HCCI engines. There were several fuel compositions used in this study; the main difference in fuel mixture compositions was the change of the H2 to CO ratio. Indicated performance of the HCCI engine was evaluated
based on in-cylinder and cycle-resolved pressure measurements. The performance and phasing analysis consisted of peak in-cylinder pressures, pressure rise rates, indicated mean effective pressure (IMEP), indicated efficiency, start of combustion timing, and combustion duration. Combustion phasing and performance of the engine was found to be significantly affected by variations in both intake charge temperature and equivalence ratio. The effects of engine speed are more unclear; however, there are some effects at different engine speeds which are speculated to be attributed to air/fuel mixing and possible charge stratification.
ACKNOWLEDGEMENTS
When I set out in the field of combustion research several graduate students aided me with their knowledge and friendship; Prakash Gnanam, Micheal Johnson and Nima Gharib were great colleagues to have worked with. The research itself on biogas HCCI combustion was initiated at the University of Windsor by a post doctoral fellow Dr. Grzegorz Przybyla and I would like to thank him for introducing such an interesting topic.
I would like to thank Dr. Johrendt and Dr. Tam for participating on my Thesis Committee. I would to thank Bruce Gadal and Waseem Habash and their staff at St. Clair College for their support and co-operation; St Clair College is where the
TABLE OF CONTENTS
DECLARATION OF ORIGINALITY ... iii
ABSTRACT ... iv
DEDICATION ... iv
ACKNOWLEDGEMENTS ... vi
LIST OF TABLES ...x
LIST OF FIGURES ... xi
ABBREVIATIONS ... xiiv
CHAPTER I. INTRODUCTION 1.1 HCCI Basics ...1
1.2 Biomass Gas Introduction ...2
1.3 Objective ...3
1.4 Scope ...3
II. REVIEW OF LITERATURE 2.1 HCCI Fundamental Research ... 2.1.1 Variations in Intake Charge Temperature ...5
2.1.2 Effects of Intake Charge Boosting ...6
2.1.3 Variable Compression Ratio Application ...7
2.1.4 EGR as a Combustion Controller ...9
2.1.5 Engine Speed Implications ...10
2.2 HCCI Fuels and Fuelling Strategies ... 2.2.1 Fuel Classification & Application ...13
2.2.2 Natural Gas as an Alternative ...14
2.2.3 Fuel Reformation ...15
2.3 Biomass Gas Production & Characteristics ... 2.3.1 Biomass & Byproducts Overview ...17
2.3.2 Gasification Process & Fuel Composition(s) ...18
2.3.3 Chemical Kinetic Basics Regarding Hydrogen and Carbon Monoxide Oxidation ...21
2.3.4 H2:CO Ratio Combusiton Characteristics ...25
2.4.1 SI Engine Biomass Gas Utilization ...30
2.4.2 Biomass Gas Combustion in Diesel Engines ...32
2.4.3 Biomass Gas & HCCI Engines ...33
III. DESIGN AND METHODOLOGY 3.1 Engine Experimental Setup ...35
3.2 Data Aqusition and Parameter Control ...38
3.3 Operational Conditions ...39
3.4 Performance & Combustion Phasing Quantification Methodology ...40
IV. RESULTS 4.1 Experimental Results Introduction ...44
4.2 Individual Fuel Composition Results ... 4.2.1 Fuel Composition 2 Results - Tin and Parameters at various Engine Speeds ...45
4.2.2 Fuel Composition 3 Results - Tin and Parameters at various Engine Speeds ...53
4.2.3 Fuel Composition 4 Results - Tin and Parameters at various Engine Speeds ...63
V. ANALYSIS AND DISCUSSION 5.1 Fuel Compsotion Effects ...75
5.2 Discussion of Operating Conditions ... 5.2.1 Effects of Intake Charge Temperature Variations ...82
5.2.2 Equivalence Ratio Effects on Phasing and Performance .83 5.2.3 Engine Speed Variation Effects on Combustion ...84
VI. CONCLUSIONS AND RECOMMENDATIONS 6.1 Conclusions ...88
6.2 Technological Contributions ...89
6.3 Future Work Recommendations ...89
REFERENCES ...91
APPENDICES A. Experimental Data ... A.1. Performance and Phasing Data Table - Fuel Composition 2 ...98
A.2. Performance and Phasing Data Table - Fuel Composition 3 ...99
B.1. Emission Data Table - Fuel Composition 2 ...101
B.2. Emission Data Table - Fuel Composition 3 ...102
B.3. Emission Data Table - Fuel Composition 4 ...103
LIST OF TABLES
Table 2.1: Carbon balance & gasification efficiency of experimental results of fluidized bed gasifier
Table 2.2: Mole Fractions of the Producer Gas Components for Different Frg Values
Table 3.1: Core Experimental Element Identification Corresponding to Figure 3.2 Table 3.2: General Engine Specifications & Operating Conditions
Table 3.3: Fuel Compositions & Factors
LIST OF FIGURES
Figure 1.1: CI, SI & HCCI Pictorial Comparison
Figure 2.1: Operational Range with various intake air temperatures (CR=16.55) Figure 2.2: Operational Range with various compression ratio (Tin=400 K)
Figure 2.3: Effect of Compression Ratio on Stable and Moderate Combustion Region and on Maximum IMEP (1200rpm)
Figure 2.4 Heat release parameters definitions net rate of heat release (RoHR) Figure 2.5: Effect of engine speed on maximum rate of low temperature heat release
(LTHRmax) for crank angle (CAD) and time (ms) basis, ULSD fuel,
CR=11.0, Tmix=68ÛC, MAP=1.55kPa, 0% EGR, AFR=57
Figure 2.6 Effect of RG replacement on HCCI operating range of PRF100 and PRF80 fuels
Figure 2.7: Concept of the Combined Injection Method in Negative Valve Overlap & Intake Stroke
Figure 2.8: Gas production rate vs. air velocity
Figure 2.9: Explosion limits of a stoichiometric H2 – O2 mixture
Figure 2.10: Laminar burning velocities for various mixtures
Figure 2.11: Rich flammability limits of H2-CO mixtures in air at different
temperatures
Figure 2.12: Lean flammability limits of H2-CO mixtures in air at different
temperatures
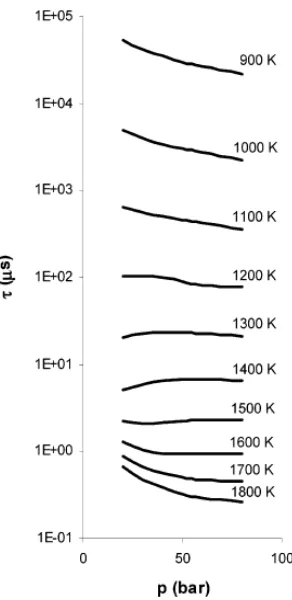
Figure 2.13: Auto-ignition delay time (in microseconds) of a stoichiometric producer gas/air mixture vs. pressure at different temperature values
Figure 2.14: Measured ignition delays for H2/CO auto-ignition. Molar composition:
(H2+CO)/O2/N2/Ar=12.5/6.25/18.125/63.125. Pressure at TDC, Pc=50bar
Figure 2.15: Charge energy density of different fuels used in HCCI engine Figure 2.16: Schematic diagram fully renewable fuel engine test setup Figure 3.1: Experimental Engine and Fuelling System
Figure 3.4: Pressure, HRR, and HR traces showing correlation of CA10, CA90, and CA10-90
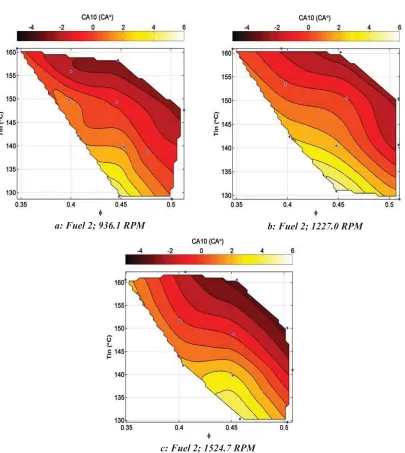
Figure 4.1 CA10 for Fuel Composition 2 with respect to intake charge
(a,b,c): temperature and equivalence ratio at engine speeds of 936.1, 1227.0, and 1524.7 RPM
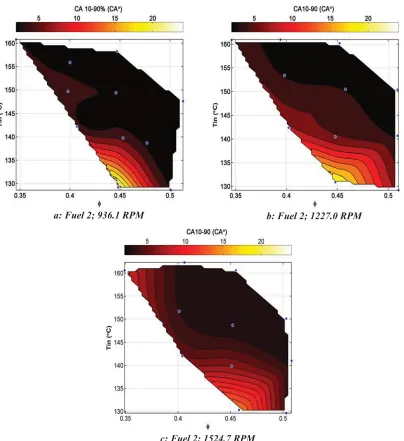
Figure 4.2 CA10-90 for Fuel Composition 2 with respect to intake charge
(a,b,c): temperature and equivalence ratio at engine speeds of 936.1, 1227.0, and 1524.7 RPM
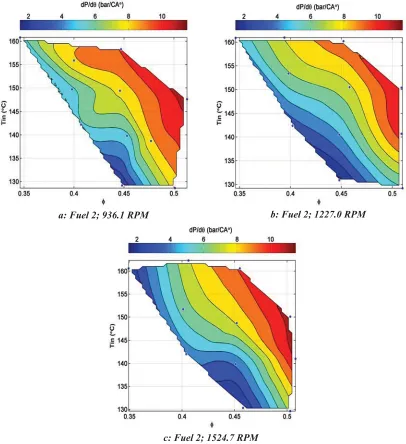
Figure 4.3 Maximum Pressure Rise Rate for Fuel Composition 2 with
(a,b,c): respect to intake charge temperature and equivalence ratio at engine speeds of 936.1, 1227.0, and 1524.7 RPM
Figure 4.4 Maximum In-Cylinder Pressure for Fuel Composition 2 with
(a,b,c): respect to intake charge temperature and equivalence ratio at engine speeds of 936.1, 1227.0, and 1524.7 RPM
Figure 4.5 IMEP for Fuel Composition 2 with respect to intake charge
(a,b,c): temperature and equivalence ratio at engine speeds of 936.1, 1227.0, and 1524.7 RPM
Figure 4.6 Indicated Efficiency for Fuel Composition 2 with respect to
(a,b,c): intake charge temperature and equivalence ratio at engine speeds of 936.1, 1227.0, and 1524.7 RPM
Figure 4.7 CA10 for Fuel Composition 3 with respect to intake charge
(a,b,c): temperature and equivalence ratio at engine speeds of 935.3, 1225.6, and 1521.9 RPM
Figure 4.8 CA10-90 for Fuel Composition 3 with respect to intake charge
(a,b,c): temperature and equivalence ratio at engine speeds of 935.3, 1225.6, and 1521.9 RPM
Figure 4.9 Maximum Pressure Rise Rate for Fuel Composition 3 with
(a,b,c): respect to intake charge temperature and equivalence ratio at engine speeds of 935.3, 1225.6, and 1521.9 RPM
(a,b,c): respect to intake charge temperature and equivalence ratio at engine speeds of 935.3, 1225.6, and 1521.9 RPM
Figure 4.11 IMEP for Fuel Composition 3 with respect to intake charge
(a,b,c): temperature and equivalence ratio at engine speeds of 935.3, 1225.6, and 1521.9 RPM
Figure 4.12 Indicated Efficiency for Fuel Composition 3 with respect to
(a,b,c): intake charge temperature and equivalence ratio at engine speeds of 935.3, 1225.6, and 1521.9 RPM
Figure 4.13 CA10 for Fuel Composition 4 with respect to intake charge
(a,b,c): temperature and equivalence ratio at engine speeds of 938.9, 1227.0, and 1523.4 RPM
Figure 4.14 CA10-90 for Fuel Composition 4 with respect to intake charge
(a,b,c): temperature and equivalence ratio at engine speeds of 938.9, 1227.0, and 1523.4 RPM
Figure 4.15 Maximum Pressure Rise Rate for Fuel Composition 4 with
(a,b,c): respect to intake charge temperature and equivalence ratio at engine speeds of 938.9, 1227.0, and 1523.4 RPM
Figure 4.16 Maximum In-Cylinder Pressure for Fuel Composition 4 with
(a,b,c): respect to intake charge temperature and equivalence ratio at engine speeds of 938.9, 1227.0, and 1523.4 RPM
Figure 4.17 IMEP for Fuel Composition 4 with respect to intake charge
(a,b,c): temperature and equivalence ratio at engine speeds of 938.9, 1227.0, and 1523.4 RPM
Figure 4.18 Indicated Efficiency for Fuel Composition 4 with respect to
(a,b,c): intake charge temperature and equivalence ratio at engine speeds of 938.9, 1227.0, and 1523.4 RPM
Figure 5.1: CA10 at constant equivalence ratio 0.450 ± 0.004 with respect to (a,b,c) intake charge temperature and engine speed regarding fuel
compositions 2, 3, and 4
compositions 2, 3, and 4
Figure 5.3: IMEP at constant equivalence ratio 0.450 ± 0.004 with respect to intake (a,b,c) charge temperature and engine speed regarding fuel compositions 2,
3, and 4
Figure 5.4: Indicated Efficiency at constant equivalence ratio 0.450 ± 0.004 with (a,b,c) respect to intake charge temperature and engine speed regarding fuel
compositions 2, 3, and 4
ABBREVIATIONS
HCCI homogeneous charge compression ignition NOx nitrious oxides
PM particulate matter
SI spark ignition
CI compression ignition CR compression ratio SOC start of combustion
EGR exhaust gas recirculation TDC top dead center
CO carbon monoxide
H2 hydrogen
CH4 methane
CO2 carbon dioxide
N2 nitrogen
CV calorific value
K Kelvin degrees
°C degrees Celsius
RPM revolutions per minute
excess air ratio
COV coefficient of variation
IMEP indicated mean effective pressure BMEP brake mean effective pressure ppm parts per million
NVO negative valve overlap
ULSD ultra low sulphur diesel LTHR low temperature heat release HTHR high temperature heat release CAD crank angle degrees
PRF primary reference fuel ICE internal combustion engine
NG natural gas
RG reformer gas
Tin intake charge temperature
O2 oxygen
ISFC indicated specific fuel consumption LCV lower calorific value
DI direct injection UHC unburnt hydrocarbons LPG liquid petroleum gas THC total hydrocarbons MRG methanol reformed gas DME dimethyl ether
AC alternating current VSD variable speed drive ECU electronic control unit CAS combustion analysis system DAQ data acquisition
HRR heat release rate
HR heat release
CHAPTER I
INTRODUCTION
1.1 HCCI Basics
HCCI combustion mode for engine technology has been a growing area of interest for over a decade. As the name indicates in HCCI engines a homogeneous charge
(fuel/air mixture) is created then the mixture is compressed. Ignition of the mixture is due to the auto-ignition properties of the fuel used and the temperature conditions in-cylinder derived from the compression process. HCCI engines are desirable for their improved thermal efficiency, ability to accommodate a variety of fuels and reduced NOx & PM (particulate matter) emissions [1]. The HCCI concept contains aspects from both conventional types of internal combustion engines; SI (Spark Ignition) & CI
(Compression Ignition).
In a conventional SI engine a homogeneous charge is created consisting of some hydrocarbon fuel and an oxidizing agent (air). This mixture is then brought into the cylinder, compressed (CR ~8-11) and ignited (via a spark plug) [2]; the spark timing controls the pressure conditions generated from the expansion of combustion products. Once the spark plug fires a flame front propagates through the combustion chamber from the point of origin to the cylinder walls. The mixture of fuel/air for SI combustion needs to be at approximately the stoichiometric ratio of fuel and air ݊=1 throughout the entire combustion chamber (meaning theoretical amount of air to oxidize all of the fuel with no excess oxygen; equivalence ratio () is the comparison of theoretical AFR (air-to-fuel ratio) and actual AFR). In CI engines only air is brought into the cylinder and
Figure 1.1: CI, SI & HCCI Pictorial Comparison [4]
The combination of the two conventional methods for combustion to form this alternative HCCI combustion mode has its advantages and drawbacks as shown in Figure 1.1. The phasing of the combustion event encompasses both the on-set timing and duration of heat release; it is somewhat problematic and complex as there is not direct control of the start of combustion (SOC) (in SI is spark timing and in CI is fuel injection timing). Some methods for control of HCCI combustion phasing are: variation of the intake charge temperature [5], modification of the compression ratio [6], intake charge boosting [1] and the introduction of EGR [7, 8]. In HCCI engines the energy release occurs simultaneously throughout the combustion chamber due to the auto-ignition at multiple locations of the homogeneous charge. For this reason the period of heat release is generally short and located close to TDC; this can cause extremely high in-cylinder pressures with richer mixtures which could lead to knock and eventual engine damage.
1.2 Biogas Introduction
by-products of the process [9]. In the case of the work conducted here the compositions used are derived from possible variances in gaseous mixture components found through the process of gasification of wood products. The gasification of wood products is considered because waste wood or by-product wood waste could be a viable renewable source of supply for the biogas production process which does not impact the supply of food.
The components found in the gaseous mixture derived from wood are CO, H2,
CH4, CO2 and N2 [10], taking into consideration that any water vapour formed during the
partial oxidation transformation is filtered out. If just the components identified above are considered only CO, H2 and CH4 could contribute to the release of energy by further
oxidation reactions and therefore a focus will be brought to the variances found with these mixture components. The percentage of CH4 is small (3-5%) and therefore almost
all of the energy released is derived from the H2 and CO constituents [10]. The total
gravimetric contribution which the reactive components have within such mixtures is small, mostly being dominated by N2, and therefore a reduction in the calorific value
(CV) of the fuel mixture occurs.
According to [11] there is limited current data concerning the combustion
characteristics of biomass gas containing H2 and CO as the majority reactive components
with regards to properties such as flammability limits, flame speeds and ignition characteristics; excluding 100%H2. With limited information and data concerning the
combustion properties of these biogas mixtures a study such as this work could help provide insight into the viable range of biogas fuels.
1.3 Objective
The goal of this work is to experimentally investigate the viability of biomass gas as a fuel for HCCI engine combustion.
1.4 Scope
In this study, performance and combustion phasing of a HCCI engine will be quantified utilizing premixed compositions of biomass gas with a varied CO/H2 ratio.
combustion and inherently the performance will be manipulated (intake charge
CHAPTER II
REVIEW OF LITERATURE
2.1 HCCI Fundamental Research
As identified in Chapter 1 there is no direct control over the SOC or the rate at which the combustion event occurs in HCCI combustion. There are however, methods that have been researched which are implemented as indirect control of the combustion processes by setting the conditions under which combustion is initiated and carried out. Increased/optimized performance and extension of the HCCI operating range is the objective of modifying the combustion event and therefore with operating condition modification inherent control over the phasing and duration of the combustion event is indicated.
2.1.1 Variations in Intake Charge Temperature
One of the most studied methods for combustion control is intake charge preheating. Through preheating of the fresh fuel/air mixture it is shown that the SOC timing can be altered and the rate at which heat is released can be changed based on the level of preheating [5].
Figure 2.1: Operational Range with various intake air temperature (CR=16.55) [12]
In the work of [12] various intake charge temperatures (67ÛC, 87ÛC,107ÛC, & 127ÛC) were investigated at a constant compression ratio of 16.6 with respect to
equivalence ratio and engine speed using n-butane as fuel. Figure 2.1 shows that as the intake charge temperature increases the operational range shifts to higher engine speeds, however a reduction in the equivalence ratio is required therefore affectively decreasing the amount of chemical energy which was released. In the work conducted for [13] an HCCI engine was operated with a fixed compression ratio of 16.5 and fixed engine speed of 1500 RPM fuelled with ethanol. The results are reported with respect to (the excess air ratio {1/ = }) instead of equivalence ratio. In this study it was determined that at lower intake temperatures a richer mixture ( = 0.5 or Ȝ= 2) could be ignited without causing engine knock, as the intake temperature was increased at the same rich
equivalence ratio knock was encountered. However it was found that the lean operational range (up to = 0.18 or Ȝ= 5.5) could be extended with increases in intake temperature. In the work of [14] it is shown that for a constant compression ratio of 16 and engine speed of 1500 RPM, as the intake temperature increases from 40ÛC to 110ÛC the resultant BMEP decreased drastically from 4.0 bar to 0.5 bar. These results are attributed to phasing of the combustion event. By increasing the intake temperature the auto-ignition temperature for the fuel/air mixture is reached earlier during the compression stroke at constant compression ratio. With too advanced combustion (BTDC) the expanding combustion products do work on the piston while the compression stroke is still
completing (negative work). The resultant negative work done on the piston reduces the amount of positive net work out from the system which was shown in [14] as the
reduction in BMEP.
2.1.2 Effects of Intake Charge Boosting
charge) aids in the problematic nature of the speed of the combustion caused by the chemical reaction rates. The performance of the engine in terms of IMEP [15] was greatly improved up to 14 bar from more conventional HCCI technology which can attain up to 5 bar. Similar results of significant increases in IMEP values due to intake boost were found in [16]. In [16] a maximum IMEP was recorded at 16.34 bar with no
knock/pressure ringing at 3.25 bar intake pressure. Unlike the study done in [15], in [16] EGR was added to the incoming charge; it was found with increasing boost at a constant equivalence ratio (if no EGR is added at a constant intake temperature with boost
pressures above 1.8 bar) a reduction in equivalence ratio is required to maintain low levels or avoid pressure ringing/knock.
2.1.3 Variable Compression Ratio Application
Another method to modify the temperature conditions of the fuel/air charge in the cylinder is through modification of the compression ratio; it has been reported that HCCI combustion is strongly influenced by compression ratio changes [5].
Figure 2.2: Operational Range with various compression ratio (Tin=400 K) [12]
engine speed. It is shown that the largest compression ratio maintains the largest operating range for combustion in terms of both equivalence ratio and engine speed. When operating at higher compression ratios the maximum equivalence ratio is limited effectively restricting gains in performance.
The effect which increased compression ratios have on reducing required intake charge temperatures was further investigated in the work conducted in [17]. Here compression ratios ranging from 12:1 to 18:1 were used at various intake charge temperatures over a range of air-to-fuel ratios for stable to moderate combustion. The air-fuel ratio (AFR) represents the comparison of mass of air to mass of fuel which is present in the delivered charge; this ratio will vary based on the fuel used but can be approximated at 14.5 for most liquid fuels. If the AFRactual increases the mixture
becomes leaner; HCCI engines operate with increased AFRactual or decreased equivalence
ratios (~1/3). Therefore, one can expect AFRactual in the range of ~25 to 60. In Figure 2.3
it is shown that if the compression ratio is increased the temperature created from
compression is sufficient for ignition; the maximum IMEP obtained (5.4 bar) corresponds to the highest compression ratio used at the lowest (close to ambient) intake temperature.
2.1.4 EGR as a Combustion Controller
Since HCCI combustion can be summarised as a chemical kinetic process which relies on in-cylinder temperature, pressure and composition of the charge another interesting approach to combustion control through the addition of EGR is currently under investigation by many researchers. Through the research conducted on classification of effects EGR has on HCCI combustion there are three main topics: dilution effect (presence of inert gases in EGR), thermal effect (heat transfer, quality of EGR mixture, temperature, heat capacity), and chemical effects [18]. The focus of the work in [18] is directed toward understanding the chemical effects EGR has on
combustion through the chemical species CO, NO, & CH2O (formaldehyde) which are
common reactive species found in HCCI exhaust. It was found in this work that the chemical effect of CO found in EGR was varied. For instances where 170ppm and lower levels were added to the intake no effect was induced. When a level of between 170-1000ppm was added SOC was delayed and at levels up to 10000ppm the chemical energy supplied by the oxidization of the CO plays an important role and increases the peak pressures. In terms of NO addition it can both promote and inhibit ignition delay; with a small amount of 45ppm can affect both the heat release phasing and the total amount of heat released. CH2O (Formaldehyde) is shown to delay auto-ignition and negatively
affect the heat release process. The researchers of [19] investigate both experimentally and numerically the effects which EGR has on the onset of combustion. In [19] it was found that the SOC could be retarded due to a thermodynamic cooling effect attributed to a high heat capacity of CO2 and H2O. Similar results to those found in [18] were also
reformation. In both [20] and [21] the goal of trapping the hot combustion residuals in-cylinder is to accomplish “reformation” of the injected fuel through partial oxidation reactions. These reactions create new molecules such as H2 which are thought to aid in
the battle of combustion control for HCCI technology.
2.1.5 Engine Speed Implications
The last major factor which contributes to problems with combustion control is engine speed; as engine speed changes the available time for the combustion event changes. As was shown in [12] the operating range can be influenced by not only modifications to parameters such as intake temperature or compression ratio but also by the engine speed. With higher engine speeds there is less time for the mixture to self-ignite and completely burn. As the engine speed increases the SOC needs to be advanced in order to have enough time to release all of the energy from the oxidization of the fuel; the ignition delay time remains constant due to chemical kinetics. Experiments were carried out in [22] isolating engine speed by holding the intake temperature (45ÛC), coolant temperature (90ÛC) and compression ratio (CR = 15.3) constant while varying the engine speed from 600rpm to 900rpm. At higher engine speeds, low heat transfer to the wall occurs due to reduced cycle evolution times. Through the experiments conducted in [22] it was determined that the timing/phasing with regards to low temperature reactions which occur regarding a dual stage fuel (iso-butane used here) in terms of crank angle remains constant. A dual stage fuel has a high cetane number meaning it auto-ignites readily when mixed with air and has a dual stage burn; this dual stage heat release
consists of a low temperature heat release (LTHR) or cool flame and a main burn stage or high temperature heat release (HTHR); shown in Fig. 2.4. This results because the various chemical reactions are governed by temperature conditions. The work of [22] goes on to state that the time delay between the low temperature reactions and main combustion event is reduced as engine speed is increased which is attributed to a
Figure 2.4: Heat release parameters definitions net rate of heat release (RoHR) [23]
It was found that for richer mixtures (up to ݊= 0.4) the timing was advanced due to compression heating effects but as the charge was leaned out this effect was not sufficient to compensate for a reduction in actual time of the cycle and combustion was inherently retarded. In contradiction to [22], [24] found that the low-temperature reaction phasing was advanced as engine speed increased. The use of standard ultra-low sulphur diesel (ULSD) in HCCI combustion for the purposes of investigating the effect of engine speed was carried out in [23]. In [23] the operating conditions were: compression ratio to 11, with initial temperature of the fuel/air mixture at 68ÛC and boosting the intake pressure to 1.55 bar using no EGR at an equivalence ratio of 0.26. In Figure 2.5 the effect of engine speed on on-set of LTHR is quantified. As the engine speed is increased the amount of energy released over a certain amount of time (ms) is generally constant. However, it is clearly shown that as engine speed increases the amount of energy released with respect to crank angle decreases. This LTHR provides both energy to aid in the initialization of the main combustion event and intermediate radical chemical species which lead to HTHR reactions for the main combustion event [23]. Since the LTHR is negatively affected by increases in engine speed the main combustion event is also then retarded as a result.
The fuel used for the work conducted in this thesis does not generate the dual stage heat release and therefore engine speed effects correlating to high cetane fuels may not translate into results found with the biomass gas fuels used here.
Figure 2.5: Effect of engine speed on maximum rate of low temperature heat release (LTHRmax) for crank angle (CAD) and time (ms) basis, ULSD fuel, CR=11.0, Tmix=68ÛC, MAP=1.55kPa, 0% EGR,
AFR=57 [23]
2.2 HCCI Fuels and Fuelling Strategies
2.2.1 Fuel Classification & Application
There is a fundamental difference between types of fuels based on the process used to ignite them and the nature of subsequent combustion process. If a fuel is
referenced by its octane number, which is an indication of the fuel’s ability to resist auto ignition, the fuel is generally meant for use in a SI engine as the ignition is induced by the spark release [3]. If a fuel is referenced identifying its cetane number, which is an
indication of the fuel’s readiness to auto-ignite, the fuel is generally used in CI
combustion and SOC is controlled by temperature and pressure conditions at the injection timing of the fuel [3]. Due to the method for combustion in HCCI where a premixed charge is auto-ignited a variety of fuels can be utilized as long as in-cylinder conditions are created where auto-ignition will occur [28]. The researchers of [28] used PRFs (Primary Reference Fuels) and conventional commercial fuels to demonstrate the ability of HCCI to accommodate both high octane and high cetane fuels through the
conventional octane ratings of fuels inaccurate for HCCI engines the researchers in [30] experimentally investigated then developed a new fuel index based on HCCI combustion. This index is limited to the fuels experimentally tested in the study and cannot be
extrapolated to predict behaviours of new types of fuels such as the gaseous fuel used in this thesis. However, the index developed incorporates motor octane number (MON), heat release data, and molecule properties (paraffin %, olefin %, and aromatic %). By taking the chemical properties into account this new index will better reflect the auto-ignition process which occurs in HCCI engines.
2.2.2 Natural Gas as an Alternative
Liquid fuels are not the only hydrocarbons investigated with regards to HCCI engines. Natural gas has long been researched as an ICE fuel and thought of as a good alternative to liquid petroleum products. One issue with the term natural gas is that the gas itself is a mixture of various chemical components such as methane, ethane, propane, & butane and the fraction in which these components are present in the mixture varies [31]. The main constituent in natural gas is methane (CH4) which has the property of a
high auto-ignition temperature [32] which leads to a high octane rating of natural gas. Although natural gas contains large fractions of CH4 which is not an ideal fuel for HCCI
it is the higher hydrocarbon components which make natural gas a suitable candidate for HCCI combustion. The researchers of the simulation work in [31] showed that there is a strong dependence of mixture properties for HCCI combustion and that a relatively small replacement of CH4 with higher hydrocarbons (which react first) changes the chemical
in the operating region of by limiting the chemical kinetics from the cool exhaust products. It was also noted that the thermal efficiency increased as engine speed increased which was contributed to lower heat transfer to the walls, however the higher engine speed conditions did negatively affect the operating region for HCCI combustion.
2.2.3 Fuel Reformation
Another fuelling concept which is being developed for HCCI combustion involved introducing reformer gas with the fresh air/fuel charge. This reformer gas is a mixture of gaseous components with the composition primarily dominated by H2 and CO
also containing larger fractions of H2O, CO2, and N2; it is produced through the partial
oxidation of virtually any hydrocarbon fuel [33]. The idea of using reformer gas as a secondary fuel for ignition control utilizing high octane PFRs was the basis for the experimental work conducted in [33]. In this work the RG was a simulated mixture consisting of 75% H2 and 25% CO by volume and delivered from storage tanks. Through
Figure 2.6 it was found that the lowest compression ratio (14.4) with RG addition
produced the widest operating range, however the addition of RG in general allowed for a larger operating range in general. When comparing cases with and without RG while maintaining constant ݊, EGR, CR and Tin it was found that the effect, which the RG had
Figure 2.6: Effect of RG replacement on HCCI operating range of PRF100 and PRF80 fuels [33]
Another method to institute reformer gas or reformation products is through in-cylinder partial oxidation. As was identified earlier an effective method to trap combustion products in-cylinder is through the use of NVO [21] and in this work experimentation with fuel reformation strategy is conducted. Here once the exhaust valve closes and hot combustion products are trapped with excess air/O2 (because HCCI
combustion is very lean) a small portion of the total fuel required for the cycle is injected. The remainder of the fuel is injected after the intake stroke is completed and the intake valve cycles. This process is depicted in Figure 2.7 below. This small amount of fuel (~10% & 25 % of total fuel) undergoes a low-temperature partial oxidation reaction where the composition of the mixture changes producing intermediate chemical species. It was found that there was a significant expansion to the lean limit of operation when both the two injections were implemented. In terms of performance it was found that with the 10% NVO fuel injection an IMEP range of 340-400kPa with a valve overlap of 152Û. With 25% NVO injection a range of IMEP = 170-340kPa was achieved. With 100% injection during the intake stroke with the idea of creating a conventional
for fuel reformation as was used in [21] is presented in [35]. The researchers of [35] found that advancing the NVO injection earlier can affect the main SOC by up to 10ÛCA which can be attributed increased amounts of heat release and increased concentrations of intermediate chemical species due to longer reformation times. It was also reported as in [21] that there is an optimal injection timing and % of fuel which should be injected during the NVO period.
Figure 2.7: Concept of the Combined Injection Method in Negative Valve Overlap & Intake Stroke [21]
2.3 Biogas Production and Characteristics
2.3.1 Biomass and By-Products Overview
Biomass is defined as all organic matter which originates from plants (trees, crops, etc.) [36]. The vegetation itself stems from the reaction between CO2 in air, water
and sunlight which is known as photosynthesis; through biomass growth the solar energy which drives the photosynthesis process is stored in the form of chemical bonds making the structure of the biomass [36]. Researchers classify biomass in various types
consisting mostly of: woody plants, herbaceous plants/grasses, aquatic plants, and manures. The fuel gas of interest for this thesis is concentrated on woody plants as the biomass source and subsequent processing to generate the gaseous fuel mixture.
In an extension of the work of [36] a description of technologies used to extract energy back from biomass is provided in the work of [37]. In [37] the conversion processes are broken down in two main categories: thermo-chemical conversion & bio-chemical conversion. Bio-bio-chemical conversion can be broken further into two main processes fermentation and aerobic digestion. Fermentation generally leads to an end-product such as ethanol (liquid fuel) derived from sugar crops or from starch based crops such as corn [37, 38], for this reason fermentation process will not be considered as a source for biomass gas production. Aerobic digestion does provide a proven viable method for conversion of biomass substrate into biogas; however, the AD process is focused on feedstock containing a very high moisture content which in some cases
requires extra processes for increasing moisture [37] and therefore for this thesis it will be excluded from the discussion. Thermo-chemical conversion of biomass can be
subdivided into three main processes: direct combustion, gasification, pyrolysis [37]. As we are interested in a renewable fuel for HCCI combustion direct combustion is not an option due to the inability of an internal combustion engine to accommodate combustion of a solid feedstock. Pyrolysis is where heating of the feedstock occurs in the absence of air (~500K) which produces a liquid (bio-oil), solid (generally consisting of mostly carbon) and gaseous products [38, 39]. The final thermo-chemical process of biomass gas generation is gasification of the feedstock. Gasification is the partial oxidation of biomass at relatively high temperatures (~800-900ÛC) where a LCV gas is generated which then can be burnt directly in a burner type application or potentially fuel an ICE [37]. It is the gasification technology which is the biogas production method of interest.
2.3.2 Gasification Process and Fuel Composition
There are two main gasification technologies which have proven to be viable options for use with wood waste biomass: fixed bed and fluidized bed gasifiers; there are also variations which can be done within each process such as using steam or air [10].
steam is introduced insuring a good mixture of material with its oxidant [10]. The researchers in [40] investigated steam to biomass ratio and gasifying temperature on the gas component composition. The results found through the work of [40] are summarized in Table 2.1 below. The fuel compositions shown in [40] have had water vapour and nitrogen filtered out; the compositions tested in this thesis replicate water vapour filtration however retain the nitrogen therefore lowering the % contribution of other components (H2, CO, etc). At a constant steam biomass ratio of 1.32 as the gasification
temperature was increased the H2 and CO fractions increased while the CO2 and CH4
fractions decreased. When the steam biomass ratio was increased the H2 fraction
increased however the CO content decreased, CO2 increased and CH4 decreased.
Table 2.1: Carbon balance & gasification efficiency of experimental results of fluidized bed gasifier [40]
It is shown through [40] that fluidized bed gasification is a viable option for generation of biomass gas, however there are several drawbacks which make the process less attractive. The major issue is slagging of material due to the ash content of the biomass in the
gasifier [10]; this problem can be reduced by lowering the temperature. Particulate matter formed in fluidized bed reactors is also greater than those formed through fixed bed gasifiers [10].
in a downdraft type the feed and air/steam move in the same direction (down) [10]. General nominal compositions of the gaseous fuel produced through the process of gasification using air is comprised typically of 40-50% N2, 15-20% H2, 15%CO,
10-15% CO2, 3-5% CH4 [10].
In the work of [43] both scale lab experiments and numerical modelling were carried out in order to help quantify the performance of their fixed bed biomass gasifier operating with air at elevated temperatures. As was found with fluidized bed gasification [40] by increasing the feed gas temperature higher fractions of H2, CO and CH4 could be
achieved therefore increasing the LCV of the gaseous fuel. When comparing the numerical and experimental data obtained in [43] at feed gas temperatures of 623K to 1103K this work showed an optimal feed gas temperature of ~803K where the
concentration increase of combustible component gases (CO, H2 &CmHn) was less
significant than temperatures below 803K. The predicted concentration of CO was slightly lower than experimentally recorded values but ranged from 20.1% to 26.3% by volume within the temperature limits of 623K to 1103K on a dry basis. The H2 presence
increased from 6.6% to 12.7% by volume within the same temperature range. The CmHn
component of the biomass gas ranges from ~5.2% to 9.8% by volume.
As in the work of [43], [42] investigated the gasification of wood in an updraft type gasifier only in this work the biomass substrate was “long stick” feed. The idea behind using a larger feedstock size was to reduce waste produced (sawdust generation) for the gasification process. In this study it was found that long stick feedstock could be used as the substrate for gasification to produce LCV gas for use as a fuel at a conversion efficiency of 73%. It is also shown that the production of biomass gas is strongly
Figure 2.8: Gas production rate vs. air velocity [42]
The composition of the gas produced is listed for the three trials discussed in [42]; the CO content ranged from 10-15%, H2 was identified as 15-20% of the mixture, CO2 consisted
of 10-14%, the remainder of the compositions was N2 ranging from 45-50%.
2.3.3 Chemical Kinetic Basics Regarding Hydrogen and Carbon Monoxide
Oxidation
As discussed in section 2.3.2 with only a small portion ~2-5 % of the total biomass gas composition consisting of CH4 and ~65% made of inert species of N2 and
CO2 the major contributing species to the release of chemical energy from the biomass
gas are H2 and CO. To better understand the auto-ignition of H2 and CO mixtures with
air the chemical reactions of each individual component with air will be considered. Hydrogen oxidation has only eight participating species (H2, O2, H, O, OH, H2O, HO2,
and H2O2) and about 20 reactions. Despite of the condense mechanism hydrogen
M H H M
H2 o
H HO O
H2 2 o 2
OH O O
H 2 o
OH H H
O 2 o
O H H H
OH 2 o 2
Figure 2.9: Explosion limits of a stoichiometric H2 – O2 mixture [46]
Basically there are two main initiation reactions; dissociation of H2, and a H2-O2
reaction.
(Eq. 2.1) (Eq. 2.2) Note that intermolecular energy transfer caused by molecule collision is represented by the term M. The most important initiation reaction tends to be Eq. 2.2 which is relevant under almost all conditions; however, the HO2 molecule being relatively inactive at low
temperatures does not lead to any chain branching during combustion on-set [46]. If compression heating (temperature) conditions exist reaction Eq. 2.1 can also contribute to initial stages. With the production of H, a chain reaction is limited leading to further radical formation and finally H2O production:
(Eq. 2.3) (Eq. 2.4) (Eq. 2.5) These reactions are more dependent on temperature changes than pressure. When H2O is
O CO O
CO 2 o 2
M HO M
O
H 2 o 2
H O H H
HO2 2 o 2 2
M OH OH M
O
H2 2 o
2 2 2 2
2 HO H O O
HO o
OH OH H
HO2 o
2
2 O OH O
HO o
pressure is increased the frequency of molecule collisions increases leading to accelerated chain branching causing extremely rapid H2 consumption/oxidation and inherently
explosion [46]; this is the first explosion limit in Fig. 2.9. At the second limit reaction Eq. 2.6 occurs as pressure increases and replaces Eq. 2.3 as the H consuming reaction. When the HO2 molecule is produced it is considered relatively inactive, slowing down
overall reactively and therefore can be considered terminating [45].
(Eq. 2.6) At the third explosive limit with increased temperature and pressure the reactions Eq. 2.7 and Eq. 2.8 emerge and overtake the stability of the generally unreactive HO2 molecules.
(Eq. 2.7) (Eq. 2.8) As temperature again increases higher concentrations of OH radicals are produced (Eq. 2.10 and Eq. 2.11) and the chain branching reactions (i.e. Eq. 2.5) between them become more significant.
(Eq. 2.9) (Eq. 2.10) (Eq. 2.11) It should be noted that reactions Eq. 2.7 through Eq. 2.11 do play an important role at high temperatures and pressures and are the source of the third explosion limit. However, the mechanism itself is somewhat weak relative to other reactions present.
If carbon monoxide is considered to be oxidized only with oxygen the chemical reaction is:
(Eq. 2.12) The energy required to initiate this reaction is fairly high at 48 kcal/mol; this leads to very slow reaction rates. Also, the O atom produced during this reaction does not lead to any rapid chain-branching reactions which does not aid in CO consumption/conversion [46 and 47].
The relatively slow reaction rates when compared to hydrogen are represented in Figure 2.10 in terms of laminar burning velocity [47]. It is observed that under similar
2 2 2O CO H H
CO o
M O O M
O2 o
Figure 2.10: Laminar burning velocities for various mixtures [47]
When adding small portions of either water vapour or hydrogen the dynamic of CO oxidation is drastically altered. If water vapour is first considered then the reaction given by Eq. 2.13 [3] becomes significant; this reaction generally requires elevated pressure conditions:
(Eq. 2.13) With the introduction of water vapour, either injected or formed through oxidation of hydrogen i.e. Eq. 2.5, hydrogen can be freed from the H2O molecule leading to H-O
reactions. This will allow for chain branching in turn speeding up the process of CO oxidation. Another potential avenue for water vapour to aid in carbon monoxide oxidation is:
OH OH O
H
O 2 o
H CO OH
CO o 2
OH CO HO
CO 2 o 2
(Eq. 2.15) Through the disassociation of O2 molecules and the formation of OH radicals the most
commonly considered dominant path for CO oxidation can be carried out [48]:
(Eq. 2.16) The final potential oxidation path for CO is:
(Eq. 2.17) The usually chain-branching terminating species of HO2 will become reactive under
certain conditions, generally high pressure, leading to the formation of CO2 accompanied
by OH which will drive both hydrogen and carbon monoxide oxidation reactions [45].
2.3.4 H2:CO Biomass Gas Combustion Characteristics
The biomass gas produced from the gasification of wood generates a mixture where the combustible components of the gas are dominated by hydrogen and carbon monoxide as reported in previous sections of this thesis. Due to a majority of the chemical energy released in the combustion of biomass gas being attributed to the oxidization of these two components a review of characteristics concerning the mixture of these will now be carried out.
The goal of the researchers in the investigation of [49] was to establish flammability limits of various homogeneous mixtures of H2 and CO; the experiments
were conducted on a dry basis and at atmospheric pressure. The experiments are
conducted in a shock tube with the ability to manipulate the temperature of the air/H2/CO
mixture. Figures 2.11 and 2.12 are extracted from the work conducted in [49] and show the effects that not only H2 has on the flammability of the mixture but also how the
charge temperature affects them. For both the lean limit and the rich limit as the temperature of the charge was elevated the operational range is expanded. For the rich limit it is shown that for small amounts of H2 addition (~4%) an increase in the limit is
observed, however as the H2 concentration is increased the rich limit is decreased
slightly. The effect of increased concentrations of H2 on the lean limit is clearly
identified in Figure 2.12; as the H2 addition increases the lean limit of operation is
Figure 2.11: Rich flammability limits of H2-CO mixtures in air at different temperatures [49]
Figure 2.12: Lean flammability limits of H2-CO mixtures in air at different temperatures [49]
An investigation into the ignition properties of H2/CO mixtures was conducted in
[11]. Using a rapid compression machine ignition properties of only H2 and CO mixtures
the ignition delay time of the charge. The ignition delay time was then quantified with respect to changes in pressure at a constant temperature of 980K and ݊= 0.4; it was found that as the pressure was increased the ignition delay time decreased. The pressure and temperature were then held constant at 980K and 15 atm with different equivalence ratios; it was found that as the mixture approached the lean limit the ignition delay time increased.
The work of [50] implements a chemical kinetic model to analyze the main reactions involved in the combustion of various compositions of biomass gas as listed in Table 2.2; Frg is the biomass/air ratio which would be inside the gasifier.
Table 2.2: Mole Fractions of the Producer Gas Components for Different Frg Values [50]
Through the modelling work of [50] charge temperature and pressure were key parameters for the investigation of ignition delay time. In Figure 2.13 it is shown that charge temperature plays an important role in the kinetics which control ignition delay; as the temperature is increased the ignition delay decreases. The effect of pressure is not as clearly depicted; at low temperatures (T<1200K) and in the high temperature range (T>1500K) the ignition delay time decreased as pressure increased, for the intermediate temperature range (1200K<T<1500K) there were no significant changes in ignition delay time. Also reported in [50] was the effect of fuel gas/air ratio in an engine; the engine equivalence ratio appeared to play a dominant role in the chemical kinetics at
Figure 2.13: Auto-ignition delay time (in microseconds) of a stoichiometric producer gas/air mixture vs. pressure at different temperature values [50]
Another study on the auto-ignition characteristics of H2/CO mixtures was carried out in
[51]. In [51] emphasis was focused on the impact which CO has on combustion. In Figure 2.14 experimental results are plotted showing that for even small fractions of CO addition ignition delay of the mixture is increased with a pressure of 50bar. Similar results are recorded for pressures of 15 and 30 bar under the same mixture and
Figure 2.14: Measured ignition delays for H2/CO auto-ignition. Molar composition: (H2+CO)/O2/N2/Ar=12.5/6.25/18.125/63.125. Pressure at TDC, Pc=50bar [51]
2.4 Biomass Gas as an ICE Fuel
Biomass gas appears to be a viable fuel for internal combustion engines, however practical applications seem to limit the utilization to stationary systems geared toward power generation [52]. There is a misconception that because of the LCV of the biomass gas (4-6 MJ/Nm3) that there will be a significant derating of the engine performance when compared to conventional liquid fuels or even natural gas with a CV of
approximately 30 MJ/Nm3 [53]. If the biomass + air charge CV is compared to a natural gas + air charge the energy density is only 15-20% lower even though the CV of biomass gas is 1/8 of NG [53]. In the work of [54] a simple model was created to demonstrate the energy density of different fuels for HCCI engines; the results are shown in Figure 2.15. In [54] the CV of the simulated biomass gas used for Figure 2.14 is 4.95 MJ/m3 when compared to 227.7 MJ/m3 for gasoline or 57.03 MJ/m3 for ethanol. The energy density per unit mixture of the biomass gas is only ~25% lower than for a gasoline and air mixture at the equivalence ratio = 1. A reduction of 25% in ideal energy density is not significant when considering the efficiency of the entire energy conversion system; the overall efficiency of an internal combustion engine being fairly low (o = 25-40%). As
engines the charge energy density differences become smaller and at = 0.32 they are equal. (TXLYDOHQFHUDWLRI & KDU JHHQHU J\ FRQ FHQWU DWLRQ N J/ d m 3
LCVgas composition
CO H2 CH4 CO2 N2 *DVROLQH (WKDQRO /&9JDV
Figure 2.15: Charge energy density of different fuels used in HCCI engine [54]
Due to the composition of the biomass gas where a large fraction consists of inert components (N2 and CO2) a higher octane rating these components can act as knock
suppressors to allow for use of higher compression ratio therefore leading to potentially higher efficiencies [53]. The most conventional and investigated mode of combustion in engines for LCV gas is currently SI [52, 53, 55, 56] due to very little modification of existing systems for implementation. With the higher octane rating of biomass gas conventional CI or diesel combustion becomes difficult to achieve, however the producer gas can be used for similar processes accomplished by dual fuel natural gas diesel
engines.
2.4.1 SI Engine Biomass Gas Utilization
to gasoline/air mixtures). In [53] a DI CI engine was converted to SI mode for operation with biomass gas derived from an inline gasification unit. The engine was modified to allow for compression ratio manipulation which was employed for the experiments conducts in [53]. The gas fuel composition was measured in the delivery to the engine with a typical composition of 19% H2, 19% CO, 2% CH4, 12% CO2, and 2% H2O with
the balance being N2. The stock engine operating on diesel fuel in CI mode with a shaft
output power of 24 kW at an overall efficiency of 31%, with a maximum compression ratio 17:1 implemented and the engine operating in SI mode burning the biomass gas 20 kW of power was recorded at 21% overall efficiency. As the compression ratio was reduced a decrease in power output and efficiency occurred. The ignition timing also needed to be advanced with a reduction in compression ratio to maintain maximum performance (quantified here with IMEP).
Another similar study was carried out in [55] on a small single cylinder SI engine. The composition of the LCV gas used was 3% CH4, 14%H2, 13% CO2, 22% CO, 47.3%
N2, and 0.7% containing higher hydrocarbons (acetylene, ethylene, and ethane). Here
performance and emission data for biomass gas operation was compared to conventional gasoline at different engine load settings. It was found that a reduction of ~50% in terms of torque occurred leading to a reduction in power when the LCV gas was implemented. This reduction in power can be attributed to two main factors: use of approximately stoichiometric mixtures and reduction in amount of air inducted. Minimal de-rating occurs when the mixture is lean < 1 and the de-rating increases with increases in equivalence ratio. Because [55] utilizes SI combustion the mixture must be around stoichiometric for the flame to propagate through the combustion chamber. Also, as the mixture becomes richer the volume the gaseous fuel charge occupies increases and inherently decreases the flow of air into the engine. SI requires stoichiometric mixtures therefore limiting mass of fuel which can be used (restricting the potential chemical energy to be released); which can lead to de-rating of work output when utilizing biomass gas. Significant reductions in CO and UHC emissions were recorded in [55] when the biomass gas was used compared to gasoline however there was an increase in the CO2
2.4.2 Biomass Gas Combustion in Diesel Engines
For most of the work concerning implementation of biomass gas for CI
combustion it was found that the CI engines were operated in dual fuel mode; this means that there is a premixed charge of some auto-ignition resistant fuel (natural gas, biomass gas, etc.) and air inducted into the engine and then a pilot injection of high cetane fuel times/controls the ignition.
One study which conducts such an investigation is [57], where a mixture of H2
and N2 was introduced into the intake airstream and then the amount of diesel fuel
directly injected into the cylinder was adjusted in order to produce a specified power output. It was determined through the experiments carried out that the addition of this LCV gas does not significantly affect the efficiency of the engine with the advantage of a substantial reduction in diesel fuel consumption. In terms of emission characteristics it was found that a reduction in NOx production occurred thought to be from an increase in the amount of N2 present in cylinder and its dilution effects. However, increases in
smoke, THC and CO were also recorded; this effect is denoted to be caused by a reduction in the overall O2 concentration within the charge.
In the work of [58] a biomass gasifier is operated in conjunction with a DI-CI single cylinder engine with the concept of stationary power generation. To better
understand how such a dual fuel system operates a schematic is depicted in Figure 2.16.
The gas produced from the gasifier, which for this study utilized coir-pith as the feedstock, was introduced and mixed in the intake manifold of the diesel engine. The objective of the work was to compare the operation of the DI-CI engine when operating on gas + pilot injection of diesel, gas + pilot injection of rubber seed oil (an alternative renewable liquid fuel), only diesel, and only rubber seed oil. A reduction in performance parameters such as brake thermal efficiency and specific energy consumption was
recorded for all alternative fuelling cases when compared to diesel petrol as the sole fuel. The pilot injection fuel consumption savings when comparing the gas + liquid fuel experiments showed that there were lower amounts of petrol diesel required at specific engine outputs (BMEP). The emissions of CO were found to be higher at different engine loadings when using gas + oil vs. gas + diesel and the lowest CO emissions were recorded from the oil only fuelling condition.
2.4.3 Biomass Gas & HCCI Engines
The use of biomass gas for HCCI is extremely limited with only a few papers that incorporate both ideas. One such work was [59]; however this study still did not solely fuel an HCCI with biomass gas. In [59] both diesel and biomass gas were introduced into the intake manifold to create a homogeneous charge which is then inducted into the cylinder for subsequent combustion. The diesel was added as an ignition controller as it was thought that the auto-ignition temperature of only biomass gas/air mixtures would be unfeasible for combustion. The ratio of fuelling ranged from ~40-60% biogas. It was found that this dual fuelling methodology with variations in intake manifold temperature range used was 80-135ÛC and was an effective process for controlling combustion. CO2
in the gaseous fuel suppressed high temperature heat release therefore governing peak pressures and pressure rise rates while the CH4 was thought to delay combustion to
There are other works where individual components of a biomass gas mixture are investigated in terms of effects in HCCI combustion, such as H2 and CO. One such study
is [60] where simulated methanol reformed gas (MRG) was used with dimethyl ether (DME) in order to determine how combustion was affected by these mixtures. In this work it was shown that H2 is an effective ignition controller for HCCI with DME where
combustion was delayed due to the higher auto-ignition temperature of H2 gas mixtures
in air. It was also stated that H2 had a greater effect on retarding combustion that CO did.
CHAPTER III
DESIGN AND METHODOLOGY
3.1 Engine Experimental Setup
The experimental setup used to carry out this investigation was originally designed and fabricated by a previous M.A.S.c student P. Zoldak and a detailed design of all systems can be found in [61]. Overall small modifications/improvements to the experimental setup have been made but the setup itself for the most part remains as originally designed. The engine and fuelling system are shown in Figure 3.1. For the benefit of the reader of this document a general description of the apparatus will be discussed.
Figure 3.1: Experimental Engine and Fuelling System
Figure 3.2: Pre-chamber modification for HCCI combustion [61]
The engine is motored using an AC motor with a variable speed drive (VSD). The VSD system is used to maintain the engine speed at a desired RPM during both motoring and firing scenarios. The VSD has in addition a resistor brake which dissipates power generated by the engine during firing conditions.
The engine is instrumented with various equipement in order to measure and/or control operating conditions and performance. A schematic identifying the core elements of the experimental setup is provided in Figure 3.3 (above). The numbered equipment in Figure 3.3 is identified in Table 3.1 and will be described next.
Table 3.1: Core Experimental Element Identification Corresponding to Figure 3.3
Item
Number Description
1 TRo om thermo co up le (measure r oom air temp .)
2 TEG R th erm oco uple (measure temp . of EG R)
3 TI ntak e thermo co uple ( measu re temp of f resh ch arg e)
4 TCo ol th erm ocou ple (measure temp of engin e coo lant)
5 TEx ha ust th erm oco uple (measur e temp of exh aust)
6 La minar Flow E lem en t (LFE creates diff er ential pressu re w hich co rrelates with a flowrate)
7 D if feren tial Pressure Tra nsmitter (measu res d if f. press. C reated by LF E) 8 In ta ke C har ge Preheater ( preh eats intak e charg e to p redeter mined temp.) 9 Temp erature C ontroller (contro ls the Intake C harge Preh eater)
10 F uel Flow meter ( measures the flowrate of fu el b eing d elievered )
11 E lectronic F uel Injector used to deliv er the fuel at a specif ic time dueing the eng in e cycle
12 The EC U is used to con trol the injector timing an d monitor some engine p arameter s ( i.e. MA P, coolan t temp . etc.)
13 G asesou s C ylinder (con tains premixed fuel comp ositio n)
14 Sh af t E ncod er (used to measure the d isplacement of the cran kshaft correspo nd in g to a p isto n position o f TD C)
15 Pressure Tra nsd ucer (measur es the pr essure in th e cy lind er)
16 C ha rge A mp lifier (conditions th e signal from th e pressu re transducer) 17 E mission Ana lyzer (measu res levels of certain en gine emissions)
A number of K-Type thermocouples were installed along the intake and exhaust channels to monitor and record the intake and exhaust gas temperatures along with one installed in a cooling channel to monitor engine block temperature. The intake and exhaust system design has the capability of introducing EGR into the intake charge channel. The intake air pre-heater and a laminar flow element in conjunction with a differential pressure transmitter measure and prepare the incoming air for the combustion process. The fuel system designed utilizes a pressure regulator, which maintains the pressure of
(gaseous injector). An electronic control system (ECU) is implemented with a control interface via PC software and was installed to regulate the time of the solenoid valve opening and open duration in order to supply the required demand of LCV fuel dose to the engine cylinder (intake port injection). A Kistler piezoelectric 5mm wall-mounted transducer (6052A1) is mounted in the stock glow plug hole for the acquisition of in-cylinder pressure measurements; the pressure signal is conditioned using a DSP 1104CA charge amplifier. A Gurley optical encoder with a 0.1 degree Crank Angle (CA)
resolution is used for engine speed and crank angle measurements. All of the results reported on in this work are a result of the average of 125 consecutive engine cycles. The engine-out emissions were evaluated using a portable MicroGasTM gas analyzer. The emissions data is omitted from the main body of this work as the instrument used is not research calibre; however the emissions results were recorded in Appendix B.
3.2 Data Acquisition and Parameter Control
The data acquisition for this experimental setup has three core systems: combustion performance monitoring, intake charge preparation and monitoring, and system temperature monitoring and control.
The indicated combustion performance of an engine is mainly attributed from the in-cylinder pressure with respect crank angle or in-cylinder volume. To
acquire/process/display the in-cylinder pressure events a MTS CAS (Combustion Analysis System) is utilized and is specifically constructed for experimentation with internal combustion engines. The encoder signal and in-cylinder pressure transducer are routed into this DAQ system where they are used to calculate various performance indicators (IMEP, HRR, HR, etc.).
![Figure 1.1: CI, SI & HCCI Pictorial Comparison [4]](https://thumb-us.123doks.com/thumbv2/123dok_us/1443829.1176898/19.612.126.533.83.287/figure-ci-si-hcci-pictorial-comparison.webp)
![Figure 2.2: Operational Range with various compression ratio (Tin=400 K) [12]](https://thumb-us.123doks.com/thumbv2/123dok_us/1443829.1176898/24.612.182.459.422.623/figure-operational-range-various-compression-ratio-tin-k.webp)
![Figure 2.3: Effect of Compression Ratio on Stable and Moderate Combustion Region and on Maximum IMEP (1200rpm) [17]](https://thumb-us.123doks.com/thumbv2/123dok_us/1443829.1176898/25.612.228.419.418.612/figure-effect-compression-stable-moderate-combustion-region-maximum.webp)
![Figure 2.4: Heat release parameters definitions net rate of heat release (RoHR) [23]](https://thumb-us.123doks.com/thumbv2/123dok_us/1443829.1176898/28.612.115.523.79.325/figure-heat-release-parameters-definitions-rate-release-rohr.webp)
![Figure 2.5: Effect of engine speed on maximum rate of low temperature heat release (LTHRmaxcrank angle (CAD) and time (ms) basis, ULSD fuel, CR=11.0, T) for mix=68�C, MAP=1.55kPa, 0% EGR, AFR=57 [23]](https://thumb-us.123doks.com/thumbv2/123dok_us/1443829.1176898/29.612.153.493.165.399/figure-effect-engine-maximum-temperature-release-lthrmaxcrank-basis.webp)