University of Windsor University of Windsor
Scholarship at UWindsor
Scholarship at UWindsor
Electronic Theses and Dissertations Theses, Dissertations, and Major Papers
6-30-2018
ERGONOMIC DETERMINATION OF PHYSICAL CAPABILITY LIMITS
ERGONOMIC DETERMINATION OF PHYSICAL CAPABILITY LIMITS
WHILE USING RIGHT ANGLE POWER TOOLS
WHILE USING RIGHT ANGLE POWER TOOLS
Jonathan Valencia University of Windsor
Follow this and additional works at: https://scholar.uwindsor.ca/etd
Recommended Citation Recommended Citation
Valencia, Jonathan, "ERGONOMIC DETERMINATION OF PHYSICAL CAPABILITY LIMITS WHILE USING RIGHT ANGLE POWER TOOLS" (2018). Electronic Theses and Dissertations. 7483.
https://scholar.uwindsor.ca/etd/7483
This online database contains the full-text of PhD dissertations and Masters’ theses of University of Windsor students from 1954 forward. These documents are made available for personal study and research purposes only, in accordance with the Canadian Copyright Act and the Creative Commons license—CC BY-NC-ND (Attribution, Non-Commercial, No Derivative Works). Under this license, works must always be attributed to the copyright holder (original author), cannot be used for any commercial purposes, and may not be altered. Any other use would require the permission of the copyright holder. Students may inquire about withdrawing their dissertation and/or thesis from this database. For additional inquiries, please contact the repository administrator via email
ERGONOMIC DETERMINATION OF PHYSICAL CAPABILITY
LIMITS WHILE USING RIGHT ANGLE POWER TOOLS
By
Jonathan Valencia
A Thesis
Submitted to the Faculty of Graduate Studies
through the Faculty of Human Kinetics
in Partial Fulfillment of the Requirements for
the Degree of Master of Human Kinetics at the
University of W indsor
Windsor, Ontario, Canada
2018
ERGONOMIC DETERMINATION OF PHYSICAL CAPABILITY
LIMITS WHILE USING RIGHT ANGLE POWER TOOLS
By
Jonathan Valencia
APPROVED BY:
_____________________________________________________ M. Nussbaum
Grado Department of Industrial and Systems Engineering Virginia Polytechnic Institute and State University
_____________________________________________________ J. Urbanic
Department of Mechanical, Automotive, and Materials Engineering
_____________________________________________________ K. Chandler
Department of Kinesiology
_____________________________________________________ J. Cort, Advisor
Department of Kinesiology
iii
DECLARATION OF ORIGINALITY
I hereby certify that I am the sole author of this thesis and that no part of this thesis has
been published or submitted for publication.
I certify that, to the best of my knowledge, my thesis does not infringe upon anyone’s
copyright nor violate any proprietary rights and that any ideas, techniques, quotations, or any
other material from the work of other people included in my thesis, published or otherwise, are
fully acknowledged in accordance with the standard referencing practices. Furthermore, to the
extent that I have included copyrighted material that surpasses the bounds of fair dealing within
the meaning of the Canada Copyright Act, I certify that I have obtained a written permission
from the copyright owner(s) to include such material(s) in my thesis and have included copies of
such copyright clearances to my appendix.
I declare that this is a true copy of my thesis, including any final revisions, as approved
by my thesis committee and the Graduate Studies office, and that this thesis has not been
iv
ABSTRACT
The purpose of the present study was to determine if a relationship between what individuals
chose as an acceptable workload and muscle effort existed. Additionally, physical capability
limits for direct current right-angle power tool operation were established. A psychophysical
methodology was utilized to examine 40 non-skilled female participants while performing a
right-angle power tool fastening task on a simulated joint. A combination of two between subject
variables were examined: joint orientation (horizontal and vertical planes) and joint hardness
(hard and soft joints). Participants were evenly distributed into one of the four joint
orientation-hardness groups via a minimization technique that reduced between group mean characteristics
(i.e. height, weight, age, grip strength). Within each of these four groups, a combination of three
fastening strategies (Automatic Tightening Control, Quick Step, and Turbo Tight) and three
fastening frequencies (1/min, 3/min, and 5/min) were performed by each participant. The
chosen target torque, forces experienced in all three orthogonal axes, and surface
electromyography were gathered throughout the data collection. Separate mixed-design
repeated analyses of variance were used to assess each of the dependent measures, with
Tukey’s post hoc test comparisons as relevant (p<0.05). Fastening strategy and frequency
influenced the target torque and forces participants chose as an acceptable workload, which
was also supported by the surface electromyography data. Participants chose significantly
higher target torques with the Turbo Tight strategy, which was associated with lower peak force
and force impulse in comparison to the other two strategies. Participants chose to accept lower
target torques and forces as fastening frequency increased. Physical capability limits were
calculated to accommodate 75% of the female working population, which will help reduce the
v
ACKNOWLEDGEMENTS
I want to start off by thanking Dr. Jim Potvin who ignited my interest in Ergonomics
during my undergraduate studies at McMaster. You provided a strong foundation of my
Ergonomics knowledge which I still use today, and I don’t know if I would have pursued a career in this field if it wasn’t for you.
I would like to thank my committee members Dr. Maury Nussbaum, Dr. Jill Urbanic, Dr.
Krista Chandler, and Dr. Joel Cort for the invaluable guidance and advice you have provided
throughout this project. I want to especially thank my advisor, Dr. Joel Cort. The interview I had
with you seems like it was ages ago, but I distinctly remember driving back home excited about
the prospect of working under your supervision, and you have not disappointed. I am extremely
grateful for the opportunity you afforded me to take on such a massive and important project;
the experience, knowledge, and skills I have acquired throughout my time here have helped me
grow both on a professional and personal level. I will remember my time here fondly. Jim built
the foundation, but you built the house. I hope you continue to nurture and inspire future young
minds.
The completion of this project wouldn’t have been possible without the help of my
labmates, in particular my good friend Adrian de Gouw, who aided me with the majority of the
data collection. Wasn’t it fun collecting participant after participant from morning until night
everyday for 4 months straight? I can still hear the metronome in my nightmares. Don Clarke,
what more can I say that hasn’t been said about you? Anytime I had a mechanical, electrical, or
software issue you were there happy to help. Without your expertise and incredible knowledge,
it would have taken me substantially longer to complete my thesis. When you decide to retire,
the Department of Kinesiology is going to sorely miss you.
Lastly, I want to thank my family for their never-ending support. To my mom, I know it
wasn’t easy raising three kids on your own, yet you excelled as a parent and made it seem
vi “We are what we repeatedly do.
Excellence, then, is not an act, but a habit.”
vii
TABLE OF CONTENTS
DECLARATION OF ORIGINALITY ... iii
ABSTRACT ... iv
ACKNOWLEDGEMENTS ... v
LIST OF TABLES ... ix
LIST OF FIGURES ... x
LIST OF ABBREVIATIONS ... xii
CHAPTER 1: INTRODUCTION ... 1
1.1 Background ... 1
1.2 Statement of the Purpose ... 4
1.3 Hypotheses ... 5
CHAPTER 2: LITERATURE REVIEW ... 8
2.1 Occupational Musculoskeletal Injuries ... 8
2.2 Upper Extremity Musculoskeletal Disorders and Power Tools ...10
2.3 Psychophysics...14
2.4 Electromyography ...23
2.4.1 EMG and Power Tools ...25
CHAPTER 3: METHODS ...29
3.1 Study Design ...29
3.2 Participants ...35
3.3 Instrumentation ...37
3.3.1 Right Angle Power Tools and Instrumented Handle ...37
3.3.2 Simulated Joints ...39
3.3.3 Electromyography ...40
3.4 Experimental Protocol ...41
3.4.1 Training Sessions ...42
3.4.2 Testing Sessions ...43
3.5 Data Acquisition and Processing ...44
3.5.1 RAPT-HFT and Chosen Target Torque ...44
3.5.2 EMG ...45
3.6 Data Analysis ...45
3.6.1 Data Reduction Investigation ...46
3.6.2 Final Analysis – All 40 Participants ...46
CHAPTER 4: RESULTS ...47
4.1 Data Reduction Investigation ...47
4.2 ChosenTarget Torque ...48
4.3 RAPT-HFT data ...50
4.3.1 Peak Force ...50
4.3.2 Force Impulse ...51
viii
4.4.1 Peak EMG ...53
4.4.2 Integrated EMG ...57
4.5 Borg Ratings ...64
4.6 Physical Capability Limits ...64
CHAPTER 5: DISCUSSION ...66
5.1 Hypotheses Revisited ...74
5.2 Reliability...………..77
5.3 Limitations and Assumptions ...78
5.4 Recommended Physical Capability Limits ...82
CHAPTER 6: CONCLUSIONS ...84
6.1 Implications to Industry ...85
6.2 Future Research Directions ...86
REFERENCES ...88
APPENDIX A ...97
APPENDIX B ... 101
ix
LIST OF TABLES
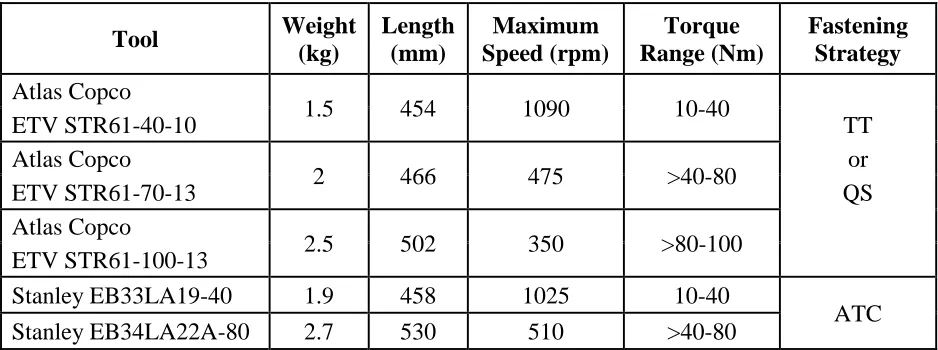
Table 1. Physical and functional properties of the right-angle power tools that will be used in this investigation………...32
Table 2. Participant anthropometric measures and grip strength organized by experimental and age groups. Mean and standard deviation are presented……...36
Table 3. The coefficient of variation values from the chosen target torque training and testing data are presented, subdivided based on joint orientation-hardness group, fastening strategy, and 15-minuteperiod………...49
Table 4. Two-way interaction shown between joint orientation-hardness group and fastening strategy on integrated EMG as a percent of MVC in all seven collected upper extremity muscles (n = 40). PEC: pectoralis major, DELT: anterior deltoid, TRAP: upper trapezius, BB: biceps brachii, TRI: triceps brachii, FCU: flexor carpi ulnaris, ECU: extensor carpi ulnaris. Means and standard deviations are presented. ………...63
Table 5. Two-way interaction shown between body region and fastening frequency on ratings of discomfort based on a CR-10 Borg Scale (n = 40). Means and standard deviations are
presented………...64
Table 6. Physical capability limits calculated from the chosen target torque data to
x
LIST OF FIGURES
Figure 1. The onset time for EMG burst as a result of increasing torque build-up times in the finger flexors, biceps, and triceps (Oh and Radwin, 1998). ...26
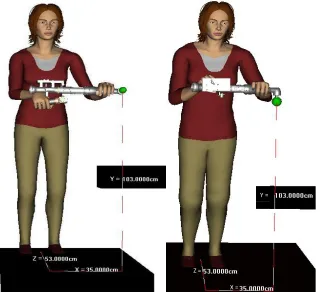
Figure 2. A digital postural representation when the test joint is oriented vertically (left) and horizontally (right) on the work station. The location of the test joint bolt, represented by the green sphere, will be 53 cm in front and 35 cm to the left relative to the participants’ midline, and 103 cm vertically relative to the floor. ...30
Figure 3. Joint classification system based on the bolt angular displacement (outer numbers) when target torque is reached. The inner chart represents the industry classification system, while the outer chart shows the modified classification system for research purposes (Radwin et al., 2016). ...31
Figure 4. A diagram depicting the independent variable combinations that make up all 36 experimental conditions. Participants will be evenly distributed into one of four test joint
orientation-hardness groups. Each participant will complete the 9 conditions in each group. ....33
Figure 5. The right-angle power tools that will be used in the study (left to right): Stanley EB34LA22A-80 (A), Stanley EB33LA19-40 (B), Atlas Copco ETV STR61-100-13 (C), Atlas Copco ETV STR61-70-13 (D), Atlas Copco ETV STR61-40-10 (E). ...37
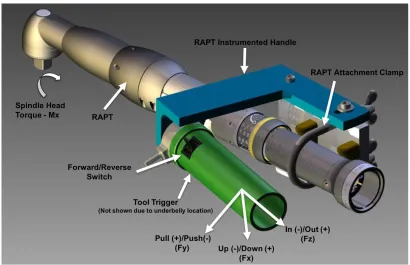
Figure 6. Handle force tool interface with a right-angle power tool. Torque reaction forces at the hand will be measured in three orthogonal axes during RAPT operation...38
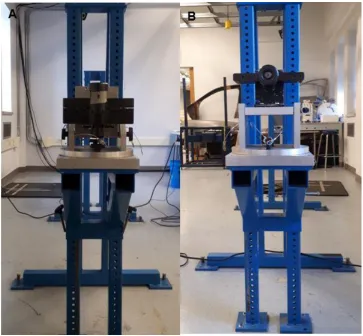
Figure 7. Simulated joint attached to the height adjustable stand positioned in the horizontal plane (A) and the vertical plane (B). ...39
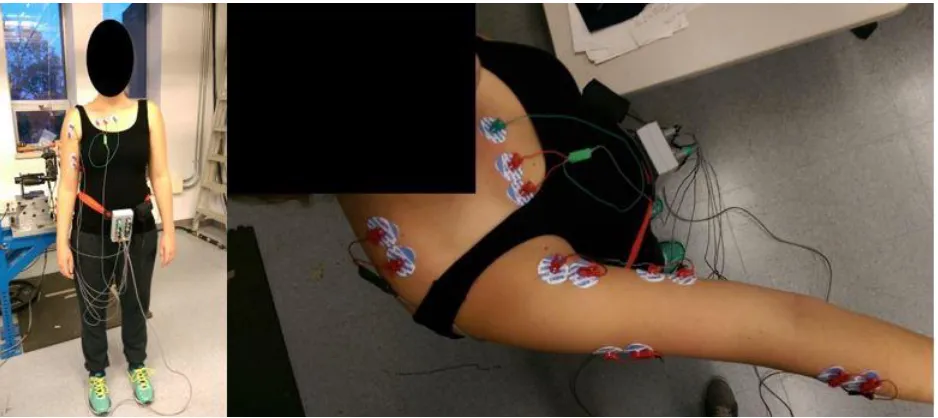
Figure 8. Front and top view of the electromyography system and set-up. ...40
Figure 9. Two-way interaction shown between joint orientation-hardness group and fastening strategy on chosen target torque (n = 40). Standard deviation bars are presented...48
Figure 10. Two-way interaction shown between fastening strategy and frequency on chosen target torque (n = 40). Standard deviation bars are presented. ...49
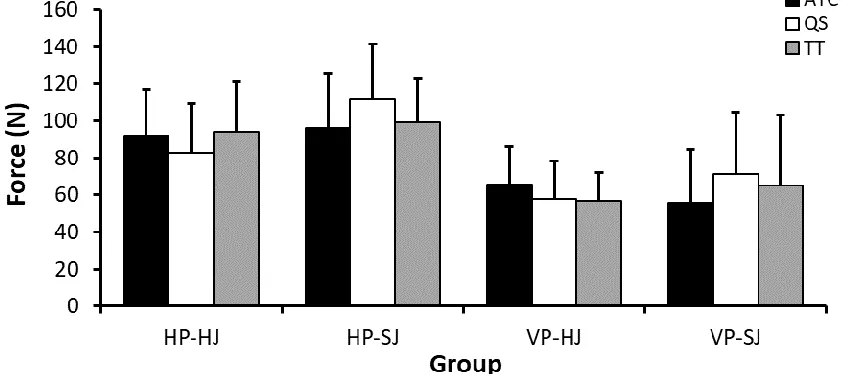
Figure 11. Two-way interaction shown between joint orientation-hardness group and strategy on the peak force recorded in the y-axis (n = 40). Standard deviation bars are presented. ...50
Figure 12. Main effect of frequency on the peak force recorded in the y-axis (n = 40). Standard deviation bars are presented. ...51
Figure 13. Main effect of frequency on the force impulse recorded in the y-axis (n = 40).
Standard deviation bars are presented. ...52
xi
Figure 15. Main effect of fastening frequency on peak EMG as a percent of MVC (n = 40). PEC: pectoralis major, FCU: flexor carpi ulnaris. Standard deviation bars are presented. ...53
Figure 16. Two-way interaction shown between joint orientation-hardness group and fastening frequency on peak EMG as a percent of MVC for the anterior deltoid (A, n = 40), triceps brachii (B, n = 40), and extensor carpi ulnaris (C, n = 40). Standard deviation bars are presented. ...54
Figure 17. Main effect of fastening strategy on peak EMG as a percent of MVC (n = 40). DELT: anterior deltoid, TRAP: upper trapezius, BB: biceps brachii. Standard deviation bars are
presented. ...55
Figure 18. Two-way interaction shown between joint orientation-hardness group and fastening strategy on peak EMG as a percent of MVC for the triceps brachii (A, n = 40) and flexor carpi ulnaris (B, n = 40). Standard deviation bars are presented. ...56
Figure 19. Between joint orientation-hardness group effect on triceps brachii peak EMG as a percent of MVC. Standard deviation bars are presented. ...57
Figure 20. Main effect of fastening frequency on integrated EMG as a percent of MVC (n = 40). PEC: pectoralis major, DELT: anterior deltoid, BB: biceps brachii. Standard deviation bars are presented. ...58
Figure 21. Two-way interaction shown between joint orientation-hardness group and fastening frequency on integrated EMG as a percent of MVC for the triceps brachii (A, n = 40) and
extensor carpi ulnaris (B, n = 40). Standard deviation bars are presented. ...61
xii
LIST OF ABBREVIATIONS
3D: Three Dimensional
Ach: Acetylcholine
aEMG: Average Electromyography
ANOVA: Analysis of Variance
ATC: Automatic Tightening Control
BB: Biceps Brachii
COV: Coefficient of Variation
CTS: Carpal Tunnel Syndrome
CR-RPE: Category Ratio of the Rating of Perceived Exertion
DC: Direct Current
DELT: Anterior Deltoid
DV: Dependent Variable
ECU: Extensor Carpi Ulnaris
EMG: Electromyography
EMGIMP: Integrated %Electromyography
EMGPK: Peak %Electromyography
FCU: Flexor Carpi Ulnaris
HAVS: Hand-Arm Vibration Syndrome
HJ: Hard Joint
HP: Horizontal Plane
HP-HJ: Horizontal Plane – Hard Joint
HP-SJ: Horizontal Plane – Soft Joint
iEMG: Integrated Electromyography
xiii IV: Independent Variable
MU: Motor Unit
MUAP: Motor Unit Action Potential
MVE: Maximum Voluntary Effort
N: Newtons
Ns: Newton Seconds
pEMG: Peak Electromyography
PCLs: Physical Capability Limits
PEC: Pectoralis Major
PHD: Peak Handle Displacement
PHV: Peak Handle Velocity
QS: Quickstep
RAPT: Right Angle Power Tool
RAPT-HFT: Right Angle Power Tool Handle Force Tool
RCS: Rotator Cuff Syndrome
RPE: Rating of Perceived Exertion
sEMG: surface electromyography
SJ: Soft Joint
TRAP: Upper Trapezius
TRF: Torque Reaction Force
TRI: Triceps Brachii
TT: Turbo Tight
UE: Upper Extremity
U.S.: United States
VP: Vertical Plane
xiv VP-SJ: Vertical Plane – Soft Joint
VWF: Vibration White Finger
WMSDs: Work Related Musculoskeletal Disorders
1
Chapter 1
INTRODUCTION
1.1 BACKGROUND
Occupational injuries have afflicted workers for centuries, and although much effort has been
directed to reduce risk factors, injuries in the workplace persist. This is of great concern since
injuries can debilitate a worker’s capacity to carry out their job, in addition to the associated
financial repercussions. In Ontario alone, there were 229,324 injury claims in 2015 resulting in
$2.58 billion in benefit payments (WSIB, 2016a; WSIB 2016b). The reported numbers in the
United States (U.S.) are much higher according to the Bureau of Labor Statistics (2016), which
recorded over 2.9 million nonfatal injuries in 2015. However, it has been estimated that the
number of nonfatal injuries could be as high as 8.5 million annually, costing approximately $186
billion (Leigh, 2011).
Due to the negative impact of occupational injuries, an abundance of research has been
conducted with the purpose of uncovering the risk factors associated with musculoskeletal
injuries, and thus providing solutions to reduce the risks of injury. A particular area of interest is
the association of power hand tool use and upper extremity (UE) injuries in the automotive
sector. Van Bergeijk (1987) found that 55% of workers in Ford Motor Company factories in the
U.S. used power hand tools, and in 2015, the Bureau of Labor Statistics (2016) reported 45,630
hand-tool related injuries in the private sector. The risk factors associated with power tool use
are related to the necessary forceful muscular exertions required to counteract torque reaction
forces, vibration exposure, prolonged muscular effort to support the tool mass, and adaptation
of awkward postures (Bernard, 1997; Muggleton et al., 1999). Epidemiological evidence has
found a strong relationship between power tool use and rotator cuff syndrome, cubital tunnel
syndrome, hand-arm vibration syndrome, carpal tunnel syndrome, and hand tendinitis and
2 adopted to aid in the reduction of musculoskeletal injuries of the UE. Specifically, the
International Organization of Standards (ISO) has published guidelines for acceptable exposure
levels of vibration, while the automotive sector has set limitations on acceptable peak torque
magnitudes for right-angle power tool (RAPT) operation based on unpublished research.
However, these guidelines are limited as they do not account for various parameters such as
repetition, fastening strategy, joint hardness, and joint orientation. With this in mind, the present
study proposes a method to determine physical capability limits when operating RAPTs by using
a psychophysical approach.
Psychophysics is a branch of experimental psychology that studies the relationship
between cognitive sensation and physical stimuli (Gescheider, 1985). In its infancy,
psychophysics was used to determine individuals’ just noticeable differences based on their
perceptions of different physical stimuli on the senses (e.g. auditory, visual, tactile) (Gescheider,
1985). From these studies, a linear relationship was established between the physical and
cognitive domains (Stevens, 1960). One of these linear relationships was found between
perceived muscular effort and force production. With this discovery, Stover Snook used
psychophysics to determine limits and guidelines for manual material handling tasks (Snook and
Irvine, 1967). The methodology involved giving participants control over one experimental
variable, while controlling for all the others. Individuals could alter the stimulus magnitude, but at
the same time were instructed to perform the task without inducing feelings of unusual fatigue or
strain. Snook’s research provided weight limits for various manual material handling tasks which
are still used as guidelines today.
Due to the success of the study, various researchers have followed in Snook’s footsteps
to determine physical capability limits (PCLs) and guidelines for occupational tasks with the use
of psychophysics (Snook and Irvine, 1968; Snook et al., 1970; Snook and Ciriello, 1974; Ciriello
and Snook, 1978; Potvin et al., 2000; Ciriello et al., 2002; Nussbaum and Johnson, 2002; Moore
3 Moore and Wells (2005) determined PCLs for in-line power tools using psychophysics.
Researchers have reported low within-subject coefficient of variation values which indicates that
the psychophysical methodology is a reliable approach for determining human exposure limits in
a variety of occupational tasks, however, there are some limitations. Psychophysical research
relies heavily on participant subjectivity, and for this reason, participants require training to
reduce errors (Karwowksi and Yates, 1986). As a result, psychophysical studies can be lengthy
and costly. Despite this, a distinct advantage of the psychophysical methodology is that it
permits realistic simulation of industrial work. Furthermore, it allows for the integration of stimuli
when multiple variables are present in a task in order quantify permissible levels of exposure.
Another tool that has been used to assess physical demands is electromyography
(EMG). EMG is a method of measuring muscular electrical activity by recording motor unit
action potentials (MUAPs). It is believed that motor unit recruitment and firing rate modulate
muscular tension, and so the collected signals can be used to estimate muscle effort (De Luca,
1997; Criswell, 2011). Under isometric contractions, the relationship between EMG and muscle
force has been shown to be linear, and in some instances curvilinear (Lawrence and De Luca,
1983; Jensen et al., 1993). However, this relationship becomes complex under anisometric
contractions since muscle length, contraction velocity, and type of contraction alter muscle force
production (De Luca, 1997; Disselhorst-Klug, 2009; Criswell, 2011). This presents a problem
since most muscular exertions are dynamic, as is the case with RAPT operation. Due to this,
researchers that have collected EMG during power tool use have chosen to use EMG to
measure muscular effort rather than muscle force (Radwin et al., 1989; Oh and Radwin, 1997;
Oh and Radwin, 1998; Armstrong et al., 1999; Forsman et al., 2002). In these power tool
studies, EMG has proven to be a valuable means of investigating the muscular demands during
power tool operation. This is of particular importance since the surface EMG (sEMG) collected
during this study will be used to determine if a relationship exists between the PCLs chosen by
4 Taken together, the establishment of PCLs for occupational tasks like RAPT operation
will provide guidelines for professionals, such as ergonomists and engineers, to follow when
assessing or designing workstations. By doing so, PCLs can aid in limiting occupational injuries
by maintaining physical demands within the capacity of workers. Currently, only guidelines for
pneumatic RAPTs exist, which is problematic since technological advancements have led to a
shift from pneumatic to direct current (DC) power tool use. DC power tools provide greater
control over the rundown parameters which can be used to match job demands. Furthermore,
Potvin et al. (2004) reported that DC power tool use resulted in lower forearm muscle activity
and hand acceleration in comparison to pneumatic power tool use. The authors concluded that
UE musculoskeletal disorders may be reduced when using DC rather than pneumatic power
tools, since the data indicated that DC power tools were less physically demanding. However,
there are currently no PCLs for DC RAPTs which is problematic since these tools are used a
great deal in the automotive industry and have the potential to cause various musculoskeletal
disorders. The present study will fill this gap in the literature by using a psychophysical
approach to establish PCLs for DC RAPT use.
1.2 STATEMENT OF THE PURPOSE
The purpose of this study was to investigate if a relationship between the psychophysically
determined workload chosen by participants and surface electromyography existed. In addition,
physical capability limits for right-angle power tool operation were established. The physical
capability limits for torque magnitude will be determined for four variables: two joint orientations
(horizontal and vertical), two joint hardness (hard and soft), three fastening strategies (Stanley’s
Automatic Tightening Control, Atlas Copco’s Quickstep, and Atlas Copco’s Turbo Tight), and
three fastening frequencies (1, 3, and 5 min-1). These variables were chosen because they are
5
1.3 HYPOTHESES
1. Training sessions will result in low Coefficient of Variation values pertaining to within-subject
variability of the acceptable torque magnitudes chosen by participants for fastener tightening
during the testing protocol.
Participants will complete an hour of training for each experimental condition. A training
period prior to testing has been incorporated in previous psychophysical studies involving the
UE, which have reported consistent within-subject Coefficient of Variation values ranging from
4.1% to 22% (Potvin et al., 2000; Cort et al., 2006; Potvin et al., 2006; Andrews et al., 2008).
This indicates that training is effective in familiarizing participants to the instrumentation and
experimental protocol. Currently, there are no studies that have reported Coefficient of Variation
values when using a psychophysical approach to set power tool physical capability limits
(PCLs). However, based on the literature, it is expected that participants will have a thorough
understanding of each condition following training, and thus yield relatively consistent
acceptable chosen target torque magnitudes (i.e. PCLs) during testing.
2. Psychophysical and electromyography data will demonstrate that participants will accept
greater target torque magnitudes when fastening hard joints in comparison to soft joints.
There is debate in the literature of whether slow torque build-up times (i.e. soft joints) are
preferred over fast torque build-up times (i.e. hard joints), or vice-versa (Radwin et al., 1989;
Armstrong et al., 1994; Oh and Radwin, 1998; Armstrong et al., 1999; Forsman et al., 2002).
Fast torque build-up times have been shown to result in greater peak EMG and the recruitment
of the stretch reflex, thus, some studies have proposed the use of slow torque build-up times to
avoid high muscular involuntary contractions (Radwin et al., 1989; Armstrong et al., 1994;
Forsman et al., 2002). However, slow torque build-up times result in greater integrated EMG
(i.e. greater muscular effort), and so other studies have suggested the use of fast torque
6 Furthermore, Oh and Radwin (1997) reported that when fastening hard joints utilizing fast tool
spindle speeds, the inertial effects of the power tool become larger. Therefore, the tool absorbs
more of the torque reaction force, resulting in less forces transmitted to the operator. Based on
this information, it is predicted that participants will accept greater target torque magnitudes
when fastening hard joints in comparison to soft joints.
3. A strong linear relationship will exist between the force impulse and the integrated normalized
electromyography from the physical capability limits chosen by participants.
Previous psychophysical research has demonstrated a strong relationship between tool
torque impulse and subjective ratings of perceived discomfort (Freivalds and Eklund, 1991;
Freivalds and Eklund, 1993; Kihlberg et al., 1993; Oh and Radwin, 1994; Kihlberg et al., 1995).
Furthermore, tool torque impulse has been shown to have a strong relationship with integrated
electromyography (EMG) (Radwin et al., 1989; Oh and Radwin 1997; Oh and Radwin, 1998;
Armstrong et al., 1999). Tool torque impulse provides an indirect measure of the force impulse
experienced at the hands during power tool use. However, it was not until recently that the
reactionary forces at the hand were able to be directly measured. Lin and McGorry (2009) used
an instrumented handle to measure reaction forces at the hand during right-angle power tool
use; the authors found a strong relationship between force impulse collected from the hand and
ratings of perceived discomfort. Putting all of this together, force impulse collected at the hand
and integrated EMG provide great detail about the muscle effort required to counteract the
impulsive forces produced during RAPT operation. In the present study, PCLs will be based on
the target torque magnitudes participants find acceptable under various parameters. In terms of
analyses, the resultant force impulse associated with the PCLs will be used, and the EMG
collected from the seven muscles will be normalized and integrated. Therefore, it is predicted
that a strong linear relationship between the integrated %EMG and integrated force (i.e. force
7 4. The muscle with the greatest relative force contribution (i.e. integrated %EMG) during
right-angle power tool operation will be the limiting factor of the physical capability limits chosen by
participants across all experimental conditions. The last 15 minutes of data from each
experimental condition during joint fastening will produce the following relationship: the
integrated %EMG of the ‘limiting muscle’ and the resultant of the force impulse collected by the
instrumented handle will have a linear relationship.
Fischer and Dickerson (2014) have provided strong evidence supporting that PCLs
obtained from psychophysical research account for biomechanical thresholds. Specifically,
Fischer and Dickerson (2014) demonstrated that PCLs are limited by the most biomechanically
limiting joint, which they termed the ‘weakest link’. Taking it one step further, I believe there is a
‘limiting muscle’ within the weakest link which will limit the amount of torque reaction force
impulse an individual is willing to accept during RAPT operation. As to why force impulse will be
investigated, Lin and McGorry (2009) demonstrated that as force impulse at the hand-arm
system increased, rating of perceived exertion increased while task acceptability decreased.
Furthermore, greater torque reaction force impulse will require greater muscular effort by
participants to counteract those forces. Thus, the integrated %EMG of each muscle will reflect
its level of effort during RAPT operation. It is predicted that the muscle with the greatest
integrated %EMG will be the limiting factor for the torque magnitude (i.e. PCLs) chosen by
participants, and the integrated %EMG will have a linear relationship to the pertaining force
8
Chapter 2
LITERATURE REVIEW
2.1 OCCUPATIONAL MUSCULOSKELETAL INJURIES
Referred to as the father of occupational medicine, Bernardino Ramazzini identified several
health hazards that workers faced in the 18th century (Añón, 2014). Although occupational
tasks have drastically changed over the last 300 years, occupational hazards continue to afflict
workers. One particular issue are work-related musculoskeletal disorders (WMSDs) which is a
term that embodies a collection of inflammatory and degenerative conditions affecting the
muscles, tendons, ligaments, joints, peripheral nerves, and supporting blood vessels (Punnett
and Wegman, 2004).
WMSDs are responsible for over a third of all registered occupational diseases in the
U.S., causing more work absenteeism and disability than any other group of diseases in both
Canada and the U.S. (Aptel et al., 2002; Punnett and Wegman, 2004). Aside from the negative
influence on workers’ health, WMSDs have enormous financial repercussions. It is the most
expensive form of work disability, impacting both employers and society, costing billions of
dollars per annum in Canada and the U.S. alone (da Costa and Vieria, 2010; Leigh, 2011).
As a result of the negative impacts of these disorders, hazards associated with
occupational tasks have been heavily researched, leading to the identification of an abundant
amount of WMSDs risk factors. It is evident from the literature that the most prominent risk
factors in the development of WMSDs are posture, force, and repetition (Ekberg et al., 1994;
Eriksen et al., 1999; Leclerc et al., 2001; Viikari-Juntura et al., 2001; Feveile et al., 2002; Frost
et al., 2002; Haahr and Andersen, 2003; Andersen et al. 2003; Nahit et al., 2003; Descatha et
al., 2003; Eriksen et al., 2004; Smith et al., 2006; Thomsen et al., 2007; Andersen et al., 2007;
Côté et al., 2008; Sliverstein et al., 2008; Shiri and Viikari-Juntura, 2011; Herquelot et al., 2013).
9 that the distribution of WMSDs across body regions is not equal. In 2015, upper extremity
injuries accounted for 20.6% of lost time claims in Ontario, only second to low back injuries
which accounted for 22.3% (WSIB, 2016a; WSIB 2016b). Injuries that afflict the joints and
anatomical structures found between the Glenohumeral joint to the distal aspect of the digits, as
well as the cervical spine, are classified as WMSDs of the upper extremity (WMSDs-UE) (Sluiter
et al., 2001).
Due to the high prevalence of UE injuries, numerous investigators have conducted
research to find the determinants of injury. Interestingly enough, the same risk factors discussed
above - posture, force, and repetition - are also the greatest contributors to the development of
WMSDs-UE (Ekberg et al., 1994; Kilbom, 1994; Leclerc et al., 2001; Viikari-Juntura et al., 2001;
Feveile et al., 2002; Frost et al., 2002; Aptel et al., 2002; Haahr and Andersen, 2003; Andersen
et al., 2003; Nahit et al., 2003; Descatha et al., 2003; Punnett and Wegman, 2004; Smith et al.,
2006; Thomsen et al., 2007; Andersen et al., 2007; Côté et al., 2008; Sliverstein et al., 2008;
Shiri and Viikari-Juntura, 2011; Herquelot et al., 2013). Non-neutral UE postures may cause
mechanical disadvantages in force production, as well as, nerve compression and increased
friction on tendinous structures (Kilbom, 1994). This has been illustrated in multiple studies
where neck flexion >20° over a duration of ≥66% of the task cycle, shoulder flexion ≥45° over a
duration of ≥18% of task cycle, working with hands above shoulder level, and wrist deviations
have been shown to independently increase the risk of WMSDs-UE (Viikari-Juntura et al., 2001;
Feveile et al., 2002; Haahr and Andersen, 2003; Andersen et al., 2003; Nahit et al., 2003; Côté
et al., 2008; Sliverstein et al., 2008; Herquelot et al., 2013). Physical demands requiring forceful
exertions have been studied, however, the type and magnitude of effort required for the exertion
varies depending on the task, WMSD, or anatomical structure being analysed. Despite this
discrepancy, forceful exertions have been shown to increase WMSD-UE risk (Feveile et al.,
2002; Frost et al., 2002; Descatha et al., 2003; Smith et al., 2006; Thomsen et al., 2007;
10 2013). Forceful tasks in the workplace have decreased over time due to automation, however,
this has resulted in a high degree of repetitive tasks as well as awkward postures (Ekberg et al.,
1994). This poses a problem since repetitive tasks have been shown to increase the risk of
WMSDs-UE (Ekberg et al., 1994; Leclerc et al., 2001; Frost et al., 2002; Andersen et al. 2003;
Nahit et al., 2003; Thomsen et al., 2007; Andersen et al., 2007; Côté et al., 2008).
It is imperative to recognize that since each occupation has unique parameters, the risk
factors and their aetiological impact on musculoskeletal disorders will vary between
occupational tasks. Additionally, each musculoskeletal disorder has unique and specific risk
factors, which are dependent on the afflicted anatomical region. Thus, it is erroneous to assume
that there is a hierarchy for risk factors in the propagation of WMSDs for all occupational tasks
and anatomical regions. Furthermore, it has been demonstrated that risk factors can have an
interaction effect, which poses a greater risk than when they act alone (Aptel et al., 2002;
Andersen et al., 2003; Silverstein et al. 2008). For instance, Andersen et al. (2003) conducted a
four-year longitudinal study on workers in industrial and service companies. The investigators
reported that workers exposed to high force and high repetitive tasks were at greater risk of
neck and shoulder pain, than when only high force or high repetition were present.
2.2 UPPER EXTREMITY MUSCULOSKELETAL DISORDERS AND POWER TOOLS
It is estimated that approximately 55% of workers in the U.S. automotive sector use power hand
tools (Van Bergeijk, 1987). Although these tools can increase worker capacity, they can also
increase the risk of injury (Muggleton et al., 1999). The U.S. private industry had 45,630
hand-tool related injuries in 2015, which is a substantial increase from the previous year where
39,790 hand-tool related injuries were reported (Bureau of Labor Statistics, 2015; Bureau of
Labor Statistics, 2016). The great magnitude of power tool use in various occupations and their
potential to increase the risk of musculoskeletal injuries is considered problematic in the
11 Investigators have found that the injuries associated with power tools use typically afflict
the UE (Bernard, 1997; Muggleton et al., 1999). This is due to the impulsive forces that must be
counteracted by the arm, vibration transmission, as well as the mass of the tool and the possible
adaptation of awkward postures during their operation. Muggleton et al. (1999) provided
epidemiological evidence between power tool operation and various WMSDs-UE, and found
that the following musculoskeletal disorders had a strong association with power tool use:
rotator cuff syndrome (RCS), cubital tunnel syndrome, hand-arm vibration syndrome (HAVS),
carpal tunnel syndrome (CTS), and hand tendinitis and tenosynovitis.
Rotator cuff syndrome refers to tendinitis of the rotator cuff muscles and/or subacromial
nerve impingement (Sluiter et al., 2001). High hand forces and tool vibration play the largest role
in the etiology of work-related RCS, while shoulder flexion ≥45° for a prolonged period has a
moderate impact (van der Windt et al., 2000; Frost et al., 2002; Andersen et al. 2003; Silverstein
et al., 2008). When the mass of the tool is not supported by an external weight balancer, the
operator is required to produce effort to hold the tool which leads to sustained muscle force in
the shoulder region. Additionally, depending on the workstation, operators may have to adopt
non-neutral shoulder postures to complete their task. Over time, these increased muscular
efforts to meet task demands may lead to inflammation and nerve impingement at the shoulder.
Furthermore, RCS risk increases if the task involves exposure to two or more risk factors, even
if exposure to the risk factors are low (Frost et al., 2002; Andersen et al., 2003; Silverstein et al.
2008).
The cubital tunnel is a passage formed between the medial epicondyle of the humerus
and olecranon through which the ulnar nerve passes at the elbow. Cubital tunnel syndrome is
caused by ulnar nerve compression at the cubital tunnel, resulting in tingling and numbness at
the ulnar border of the palm, as well as the 4th and 5th digits (Sluiter et al., 2001). Based on a
review of the literature, only two longitudinal studies have explored the work-related factors
12 when combined with prolonged static postures, increased cubital tunnel syndrome risk
(Descatha et al., 2004; Bartels and Verbeek, 2007). Power tool operation requires high forceful
contractions to counteract torque reaction forces and to maintain hand-tool coupling.
Furthermore, the UE is typically in prolonged static postures during this process. Therefore, the
repetitive use of power tools with high impulsive forces may increase the risk of cubital tunnel
syndrome.
Hand-arm vibration syndrome refers to the disorders that afflict vascular and
neurological tissues of the upper limb from vibration exposure, particularly at the lower arm and
hand (Sluiter et al., 2001). Vibration white finger (VWF) is one of the vascular disorders, and is
considered a secondary form of Raynaud’s phenomenon (Sluiter et al., 2001). VFW occurs
when there is prolonged exposure to high frequency vibration (>100 Hz), which leads to blood
vessel endothelial damage causing the vascular tissue to thicken, thus reducing blood flow
(Woodside, 1997). Due to poor circulation, blanched fingers are a common characteristic of
VWF. Regarding neurological pathologies, vibration has been shown to induce sensorineural
impairment leading to finger numbness, as well as deterioration of tactile perception and
dexterity (Bovenzi, 1998). Furthermore, long term exposure to vibration can cause permanent
damage to skin mechanoreceptors in the hand which are essential for fine motor control
(Lundström, 1986). This presents a serious problem as a vicious cycle is created. Since
vibration reduces tactile perception, this will cause greater gripping of the tool, resulting in
greater vibration transmission (Muggleton et al., 1999). The link between HAVS and vibration
from power tool use has been firmly established (Bernard 1997; Muggleton et al., 1999).
However, the amount of permissible exposure is still up for debate.
Carpal tunnel syndrome is defined as intermittent or permanent compression of the
median nerve as it travels through the carpal tunnel of the wrist (Sluiter et al., 2001). Those
diagnosed with CTS describe tingling, numbness, and pain on the palmar side of the hand and
13 occur in some cases (Sluiter et al., 2001). Non-neutral wrist and elbow postures, high forceful
finger and hand exertions, and vibration have been shown to increase CTS risk (Bernard, 1997;
Buckle and Devereux, 2002; Feveile et al., 2002; Palmer et al., 2007). If an operator must
support the weight of the power tool, this will result in sustained forceful gripping, increasing the
risk of CTS (Muggleton et al., 1999). Depending on workstation parameters, the worker may
have to adopt prolonged awkward elbow and wrist postures throughout the day, which would
also increase CTS risk. Furthermore, vibration has been shown to increase gripping force due to
the deterioration of tactile perception (Bovenzi, 1998). Additionally, the tonic vibration reflex is
activated in muscles close to the vibration source (Radwin et al., 1987). Therefore, the muscle
spindles in the forearm will be excessively stimulated resulting in continuous increase in muscle
tone. This increase in muscular activity would increase the amount of pressure placed on the
carpal tunnel, potentially leading to CTS. Lastly, as is the case with most WMSDs-UE, when two
or more of these physical risk factors are present in a task, the risk of CTS greatly increases
(Bernard, 1997; Buckle and Devereux 2002; Palmer et al., 2007).
Hand tendinitis and tenosynovitis is defined as inflammation of the extensor and flexor
tendons, including the tendon-muscle attachments that allow for motion at the wrist and digits
(Sluiter et al., 2001). This disorder causes pain during flexion and/or extension of the wrist and
fingers, with the exclusion of the thumb. Furthermore, extensor tendinitis and tenosynovitis at
the hand has been shown to be more prevalent because the wrist extensors are more active
during wrist stabilization than the wrist flexors (Sluiter et al., 2001). Forceful exertions, high
repetitive wrist and hand movements, and extreme deviated wrist postures have been shown to
increase the risk of tendinitis at the wrist and hand (Bernard, 1997; Barr et al., 2004; Thomsen
et al., 2007). This risk is even more pronounced when high forceful exertions and high repetitive
wrist/hand motions are combined (Bernard, 1997; Buckle and Devereux, 2002; Barr et al.,
14 Currently, there are few guidelines addressing power tool use. One of these guidelines
was set by the ISO, which focused on limits for hand-arm vibration. ISO 5349-I (2001) set the
following permissible limits of frequency weighted acceleration exposure per day for vibrating
tools: 4 m/s2 (4 to 8 hours/day), 6 m/s2 (2 to <4 hours/day), 8 m/s2 (1 to <2 hours/day), and 12
m/s2 (<1 hour/day). However, these threshold values have come under criticism since they
assume all workers will be performing the same task, with the same hand-arm postures, and
with identical tools (Joshi et al., 2012). Furthermore, the automotive industry developed a
standard for acceptable peak torque magnitude. Based on work by Oh and Radwin (1998), the
standard was set such that any fastener securing that exceeded 55 Nm of peak torque when
using a RAPT would require a torque reaction bar. A torque reaction bar is an attachment that
reduces the amount of torque that the operator must counteract during fastener rundowns.
However, these attachments are large, which can limit RAPT maneuverability, and thus
affecting the ability to perform various fastening tasks. Additionally, the 55 Nm peak torque limit
was set when pneumatic tools were predominantly used. Technological advancements have
caused a shift in industry to use direct current (DC) power tools over pneumatic power tools. DC
power tools offer more control during joint fastening, since the rundown strategy can be
adjusted to match job demands, as well as require less physical demands than pneumatic tools
(Potvin et al., 2004; Johnson et al., 2008). Presently, no PCLs exist for DC RAPTs, thus there is
a need for physical guidelines to reduce the risks of WMSDs-UE associated with the use of
these tools. In the present study, we will be addressing this issue by establishing PCLs for DC
RAPT operation under various parameters.
2.3 PSYCHOPHYSICS
For centuries academics contemplated the idea of measuring human sensations, but it was not
until the mid 1800’s that this became a possibility (Gescheider, 1985). Gustav Fechner’s 1860
15 allowed for the measurement of human sensory experience, and became a branch of
experimental psychology that studies the relationship between cognitive sensation and physical
stimuli (Gescheider, 1985). A fundamental element of this science is the Principle of
Nomination, which states that there is a connection between neural activity and cognitive
perception, such that identical neural events generate identical psychological events (Marks,
1978). Physical stimuli that induce different neurological responses will provoke a different
cognitive sensory experience. Thus, it is assumed that a neural threshold must be exceeded to
induce a cognitive response (Gescheider, 1985). Such a threshold may exist since sensations
can differ in intensity, quality, extension or, duration. This was first noted by Ernst Weber’s
weight discrimination study, which is the earliest known research to use the psychophysical
method. Weber found that the mass of the weight (i.e. sensory intensity) had to change a
certain amount to be able to be discerned as different from the previous weight by participants
(Gescheider, 1985). Proceeding psychophysical studies on the senses discovered linear
relationships between the physical and cognitive domains with the use of Stevens’ power law
(Stevens, 1960). This law states that the perceived strength of sensation, Ψ(I), is linearly related
(log-log determined) to the intensity of physical stimuli, I, by means of a power function: Ψ(I) =
kIn. ‘k’ is a constant dependant on the units of measurement used and ‘n’ is dependent on the
type of stimulation (e.g. brightness, loudness, vibration). This discovery served to validate
psychophysics as a useful scientific method that can be used to comprehend the human
sensory experience.
Psychophysical studies involving RAPT use have investigated how tool and workstation
properties affect operator exertion and task acceptability (Kihlberg et al., 1993; Lindqvist, 1993;
Oh and Radwin, 1994; Kihlberg et al., 1995; Oh and Radwin, 1997; Oh and Radwin, 1998; Lin
and McGorry, 2009). Modified Borg Scales were used to measure ratings of perceived exertion
(RPE). To determine task acceptability, participants were asked if they would accept working a
16 When right-angle power tools are used to fasten parts together, the operator must resist
the torque reaction force (TRF) created by the tool. TRF is influenced by target torque
magnitude, spindle speed, joint hardness of the fastener, torque build-up time and, the shut-off
mechanism of the power tool (Oh and Radwin, 1998; Radwin et al., 2016). Some of these
factors are interdependent, and a few have been used as markers to predict what operators
may or may not find acceptable. For instance, faster spindle speeds reduce torque build-up time
during the fastening process, while softer joints result in greater torque build-up time (Oh and
Radwin, 1998; Forsman et al., 2002; Lin et al., 2007). Torque build-up time is regarded as an
important factor for subjective discomfort; the longer the build-up time, the greater the operator’s
duration of exertion, which impacts RPE (Oh and Radwin, 1994; Oh and Radwin, 1998).
Another important factor for operator discomfort is target torque; it has been shown that as
torque magnitude increases, RPE increases (Freivalds and Eklund, 1993; Oh and Radwin,
1994; Oh and Radwin, 1998; Armstrong et al., 1999; Lin and McGorry, 2009). Thus, longer
torque build-up times (i.e. low spindle speed, soft joints), greater torque magnitudes, and slow
shut-off mechanisms result in greater operator RPE.
Tool handle stability has been proposed as an indicator of operator discomfort such that,
the greater the tool handle stability the lower the RPE (Kihlberg et al., 1993; Lindqvist, 1993; Oh
and Radwin, 1994; Kihlberg et al., 1995; Oh and Radwin, 1997; Oh and Radwin, 1998; Lin and
McGorry, 2009). Tool handle stability has been quantified through peak handle displacement
(PHD) and peak handle velocity (PHV) during torque build-up. When an operator has sufficient
strength to withstand the torque reaction force, the result is low handle displacement and
velocity. If torque reaction forces exceed the operator’s capacity to produce a ‘breaking’ action,
the individual’s arm is forcefully moved at a magnitude that causes increased PHD and PHV.
This entire event has been identified to result in greater reported RPE. Kihlberg et al. (1993),
Lindqvist (1993), Oh and Radwin (1994), Kihlberg et al. (1995), and Lin and McGorry (2009)
17 However, Kihlberg et al. (1993) instructed their participants to rate discomfort based on the jerk
of the tool (i.e. tool handle instability), rather than allowing subjects to rate their overall
discomfort based on the full fastening. Potentially, Kihlberg et al.’s (1993) instructions may be
the reason as to why the authors found a strong correlation between tool handle stability
measures and RPE, whereas Oh and Radwin (1994) only found a weak correlation
(0.01>r2>0.10) between tool handle stability and RPE. In addition, Kihlberg et al. (1995) only
permitted participants to complete two rundowns for each of the four experimental conditions,
which may not be enough data from which to acquire conclusive results. Furthermore, Oh and
Radwin (1998) did not find a strong relationship between tool handle stability measures and
RPE. Although tool handle stability measures appear to affect RPE, there is a discrepancy in
the literature. Therefore, tool handle stability measures may not be the most valid method for
estimating the torque reaction forces, nor provide enough insight on operator discomfort. A
potential issue with using handle stability measures is that it only considers a brief moment in
time when hand displacement and velocity are greatest, which neglects the entire experience of
operating a power tool. Rather than analysing components of the TRF, it may be more
meaningful to analyse the entirety of the tightening process. This can be done by studying the
effects of the tool torque-time curve, also referred to as the tool torque impulse.
Torque reaction forces experienced by the operator are dependent on the tool torque
impulse, therefore, it is not surprising that the literature reports a strong correlation between
RPE and tool torque impulse, where RPE increases as impulse increases (Freivalds and
Eklund, 1991; Freivalds and Eklund, 1993; Kihlberg et al., 1993; Oh and Radwin, 1994; Kihlberg
et al., 1995). Tool torque impulse is directly influenced by the torque magnitude and duration of
fastening (i.e. torque build-up, spindle speed, joint hardness, shut-off mechanism). As was
previously stated, greater torque magnitude and torque build-up time have been shown to
increase RPE, but the other factors influencing tool torque impulse have only been briefly
18 impulse which may decrease operator discomfort (Lindqvist, 1993; Oh and Radwin, 1997).
Furthermore, quicker torque build-up times cause the inertial effects of the tool to become large
(Oh and Radwin, 1997). Consequently, the power tool absorbs more of the TRF resulting in less
force transmitted to the operator. Joint characteristics also influence torque build-up time. Joints
are classified based on the angular displacement required to fasten to completion. Hard joints
require ≤90° of angular displacement, soft joints require >360° of angular displacement, and
medium joints lie somewhere in between (Radwin et al., 2016). Since softer joints require more
angular displacement than harder joints, they inherently increase torque build-up time,
increasing tool torque impulse. This may result in an increase in operator RPE and a decrease
in task acceptability. Lastly, shut-off mechanism influences tool torque impulse; when the tool is
equipped with a fast off the tool torque impulse decreases, and when it has a delayed
shut-off it increases impulse. Kihlberg et al. (1993) first reported that RAPTs that had a slow or
delayed shut-off mechanism had significantly higher RPE than tools with a fast shut-off. This
was further solidified the Kihlberg et al. (1995) study where four different RAPTs were used to
determine operator discomfort. Two of the power tools used were essentially identical in terms
of weight, tool length, spindle speed and target torque, but differed greatly in their shut-off
mechanism. The tool with a fast shut-off resulted in a RPE of 2 from the 20-point scale used,
while the tool with a delayed shut-off resulted in a RPE of 9.
The force impulse experienced by the hand-arm system provides a greater
understanding into why operators rate power tools differently. However, the instrumentation
available in earlier studies was limited, which may be the reason as to why researchers
attempted to use indirect methods to estimate TRF rather than to measure it directly.
Technological advancements have permitted researchers to directly measure these forces in
more recent studies to investigate their effects on operator discomfort and task acceptability. Lin
and McGorry (2009) equipped their power tools with an instrumented handle equipped with
19 first study to investigate the effects of grip force on discomfort and task acceptability during
power tool use. The researchers discovered that normalized grip force prior to and during the
torque build-up were significant factors for RPE and task acceptability for both pistol grip and
right-angle power tools. The gripping force prior to the torque build-up was 86-95% of that
recorded during torque build-up, suggesting that operators are bracing themselves for the
fastener rundown. Armstrong et al. (1999) were the first to notice this through their estimation of
grip force using electromyography. The grip force during torque build-up provides some insight
into the forces exerted by the operator to maintain control of the power tool during joint
fastening. This may explain why RPE increased and task acceptability decreased as normalized
grip force increased (Lin and McGorry, 2009). Lin and McGorry (2009) also directly measured
the reactive hand moment impulse and tool torque impulse. They found a relationship between
impulse ratio, the ratio between reactive hand moment impulse to tool torque impulse, and
operator discomfort, as well as, task acceptability. During RAPT use, the impulse ratio was well
above one, meaning that hand moment impulse was greater than tool torque impulse. The
relationship found was that as impulse ratio increased, RPE increased and task acceptability
decreased. The authors suggest using the impulse ratio as a predictor of operator discomfort
and task acceptability. In a previous study, Lin et al. (2007) noted that a soft joint resulted in
greater grip effort and impulse ratio when compared to a hard joint. Furthermore, Dahalan and
Fernandez (1993) reported that frequency is significantly reduced when gripping force and
gripping duration is greater. This indicates that operator discomfort might be greater and task
acceptability may be lower when fastening frequencies are higher, as well as, during the
rundown of softer joints.
The aforementioned studies used the Borg Scale, or a modified version of it, to
approximate what workers found acceptable when operating RAPTs. However, using subjective
assessments makes it difficult to infer quantitative values for physical exposure limits.
20 of ergonomics which has been utilized to determine physical capability limits (PCLs) (Snook and
Irvine, 1967; Snook and Irvine, 1968; Snook et al., 1970; Snook and Ciriello, 1974; Ciriello and
Snook, 1978; Potvin et al., 2000; Ciriello et al., 2002; Nussbaum and Johnson, 2002; Cort et al.,
2006; Potvin et al., 2006; Andrews et al., 2008). Popularized by Snook, this method involves
allowing the participant to control and adjust one experimental variable based on their
perception of the physical exertion (Snook, 1978). Snook’s rationale for this approach utilizes
Stevens’ power law to better understand the relationship between perceived muscular effort and
force production (Snook, 1978). Snook and Irvine (1967) first applied this psychophysical
method to determine individual’s maximum weight of lift. Participants were instructed to adjust
the weight of the object until it represented their maximum weight of lift based on their perceived
feelings of exertion, while the experimenters controlled for all the other variables. Training
sessions took place before testing to allow participants to become acquainted with the
equipment, working environment and the task. Subjects were instructed to work as hard as they
could without becoming strained and without inducing unusual fatigue or feeling weak. This was
managed by allowing participants to control the weight of the boxes by adding or subtracting
loose lead shot or steel welding rod based on their perceived exertion during the lifts. Due to the
success of this study, Snook continued to use this psychophysical approach for other manual
material handling tasks (i.e. lowering, pulling, pushing, carrying) to determine PCLs (Snook and
Irvine, 1968; Snook et al., 1970; Snook and Ciriello, 1974; Ciriello and Snook, 1978). From
these studies, Snook concluded that when tasks are acceptable to less than 75% of the working
population, the risk of low back injury increases threefold (Snook, 1978). As a result, Snook
advised that manual material handling tasks accommodate 75% of the working population in
order to diminish the risk of occupational injuries.
More recent studies have determined PCLs for UE tasks using the psychophysical
approach mentioned above (Potvin et al., 2000; Ciriello et al., 2002; Nussbaum and Johnson,
21 established hand impact variables that workers found acceptable during automotive trim
installation. Participants controlled the resistance setting which was supposed to mimic how
much impact force had to be applied for the door trim panel to come together. The researchers
discovered that force impulse had the greatest correlation with the resistance setting. The
within-subject coefficient of variation (COV) ranged between 9-22%, and force impulse was the
most reliable (COV = 9%). Ciriello et al. (2002) determined the maximum acceptable torques for
screw driving and rotating hand grip tasks at different repetition rates, while controlling for UE
postures. The participants were given control over the handle resistance which they could
increase or decrease based on their perception of exertion. Nussbaum and Johnson (2002)
determined maximal acceptable limits for single-digit exertions on the horizontal plane when
using the index finger and thumb. Participants adjusted the force output under three different
frequencies (3/min, 6/min, 9/min); the authors reported that force output stabilized across all
frequencies and both digits after 5 minutes of testing. Cort et al. (2006) established maximal
acceptable frequencies for fastener initiations for different wrist postures and fastener sizes. The
participants adjusted the frequency of the task such that they worked at a steady pace that did
not induce discomfort or fatigue. Cort et al. (2006) found that maximal acceptable frequencies
decreased as wrist posture deviated from a neutral position and frequencies were higher for the
larger fastener. Furthermore, the average within-subject COV for maximal acceptable frequency
and efforts per minute were 7.5% and 4.1%, respectively. Potvin et al. (2006) determined
maximal acceptable forces for electrical connector tasks during the implementation of different
grip types, wrist postures and frequencies. Participants were willing to accept greater peak force
and force impulse for oblique grasps, when compared to finger press and pulp pinch.
Additionally, it was noted that as frequency increased, accepted peak force and force impulse
decreased; wrist posture had no significant main effects. Within-subject COV was reported to
range between 8% to 14.8% for both peak force and force impulse. Force impulse had lower
22 subjects were more sensitive to force impulse than peak force. Andrews et al. (2008)
established maximum acceptable forces for hose insertions for different UE postures and
frequencies. Subjects controlled their isometric push efforts over a 750 ms period. Andrews et
al. (2008) reported that frequency had no significant impact on force impulse, but increases in
frequency resulted in decreases in peak force, whereas posture effected both peak force and
force impulse. In addition, push efforts completed on the medial plane resulted in the lowest
acceptable peak and impulse forces, while pulling back, pushing down, and pushing forward
resulted in the greatest acceptable peak and impulse forces. Within-subject COV ranged
between 5.6-11.2% for peak force and force impulse.
As can be seen, psychophysics has proven to be a valuable methodology for
determining human exposure limits in a variety of occupational tasks. Furthermore, the low
within-subject variability demonstrates that psychophysics is a reliable research tool. However,
a limitation of psychophysical research is that it relies heavily on participant subjectivity. For
instance, for participants to produce reliable results they require training and errors can arise
from extreme frequency conditions (Karwowksi and Yates, 1986). Conversely, a distinct
advantage of using psychophysics is that it allows for realistic simulation of industrial work
(Snook, 1985). Furthermore, when multiple biomechanical and physiological factors are present
in a task, as is the case with RAPT operation, it is extremely challenging to quantify their
individual permissible levels of exposure (Fischer and Dickerson, 2014). Psychophysics
provides a solution to this obstacle by producing an integrated response using the human’s
psychological, biomechanical, and physiological feedback.
Currently, there is very little research that has used this psychophysical methodology for
tools that cause torque impulsive forces. Kim and Fernandez (1993), Davis and Fernandez
(1994), Marley and Fernandez (1995) focused on determining frequency limits for pistol grip
drills based on force application and wrist posture. However, the tools in those studies were not
23 torque, and the impulsive forces that are experienced by operators in the workplace. Moore and
Wells (2005) have been the only researchers to develop PCLs for power tool operation.
Participants in this study controlled the torque magnitude of in-line power tools while
investigators controlled for posture and duty-cycle. Subjects were asked to determine the
highest torque they felt was acceptable based on their perception of effort, without developing
pain nor discomfort. Moore and Wells (2005) found that as duty cycle increased,
self-determined target torque decreased. Moore and Wells (2005) did not report within-subject COV,
thus it is unknown how tools that cause impulsive forces on the operator will affect
within-subject variability. However, based on the aforementioned psychophysical research, it is
reasonable to predict that COV will be low. The current study will be the first to provide insight
into this question, as well as the first to implement the psychophysical method to establish PCLs
for DC RAPT operation; participants will control target torque magnitude, which they will be able
to increase or decrease at 5 Nm intervals based on their perception of each exertion.
2.4 ELECTROMYOGRAPHY
Electromyography is the recording of muscular electrical activity, specifically the motor unit
action potentials (MUAPs), using indwelling or surface electrodes which is theorized to provide
an indirect means of estimating muscle force (De Luca, 1997; Criswell, 2011). A brief
background on the mechanism behind voluntary muscular contractions is required to
understand why EMG has been proposed as a valid tool for estimating muscle force. Voluntary
muscular contractions initiate in the motor cortex, descend down the spinal cord as electrical
activity to the ventral horn where the signal is then transferred to the peripheral nervous system
(Criswell, 2011). From this site, alpha motor neurons deliver the signal to the extrafusal muscle
fibres they innervate via an electrochemical signal. An alpha motor neuron and the muscle
fibres they innervate is called a motor unit (MU). The MU innervation site (i.e. neuromuscular