The premature deterioration of RC structures is a major concern for infrastructure owners. Cracks accelerate the deterioration processes by providing preferential flow paths for water and aggressive agents. Therefore, to accurately estimate the degradation rate, methodologies to account for the effect of discrete and distributed cracks in service life prediction tools need to be developed. To account for the effect of cracks, their effect on moisture transport in concrete needs to be fully understood and quantified.
The research reported in this dissertation provides more insight to the effect of damage induced by freeze-thaw loading on moisture transport. This study includes an extensive experimental program on moisture transport in saturated and unsaturated damaged cement-based materials. Analytical study and numerical modeling are also used to determine the parameters that have significant effect on the mass transport. Furthermore, new nonlinear parameters are proposed to estimate the freeze-thaw damage in concrete using acoustic spectroscopy technique. Therefore, this study consists of four phases.
In the first phase, three objectives are studied: (i) how damage affects the saturated and unsaturated moisture transport as well as electrical resistivity of concrete. Conceptual models are developed based on the fundamentals of damage mechanics and fluid transport to
Abstract
Sharp Front Theory can explain the relationship between the saturated and unsaturated moisture transport in damaged concrete, and (iii) which transport property and therefore which measurement method is more sensitive to damage. The results show that damage differently affects each of the transport mechanisms, and saturated hydraulic conductivity is more sensitive to damage as compared to sorptivity and electrical resistivity. The 1D analysis, based on the sharp front theory, does not adequately describe the effect of damage on unsaturated transport.
In the second phase, damage was induced by freeze-thaw in mortar specimens. Mass transport properties were measured using electrical resistivity, rapid chloride permeability, sorptivity, drying, air permeability, water permeability, and desorption isotherm. The results indicate that the measured effect of damage depends on the mechanisms of transport used in the measurement technique and different techniques provide a different measure of the effect of damage. The water and air permeability are comparatively more sensitive to the presence of damage.
In the fourth phase, it is investigated whether Nonlinear Impact Resonance Acoustic Spectroscopy (NIRAS) technique can be provided a method, using nonlinear parameter and nonlinear quality factor (Qfactor) parameter, to estimate the damage in the absence of prior knowledge of intact material?
The Effect of Damage on Mass Transport in Cement-based Materials
by
Farnam Ghasemzadehsomarin
A dissertation submitted to the Graduate Faculty of
North Carolina State University
in partial fulfillment of the
requirements for the Degree of
Doctor of Philosophy
Civil Engineering
Raleigh, North Carolina
2015
APPROVED BY:
______________________________
Mohammad Pour-Ghaz, Ph.D.
Committee Chair
______________________________
Sami H. Rizkalla, Ph.D.
__________________
Rudolf Seracino, Ph.D.
Dedication
This dissertation is dedicated to my beloved family. I specially would like to thank my parents for their endless love, support and encouragement. None of this would have been
Biography
Acknowledgements
A special thanks is due to Dr. Mohammad Pour-Ghaz, my thesis supervisor for his countless hours of reflecting, reading, encouraging, and most of all for his patience throughout the past three years. His excitement and willingness to provide feedback made the completion of this research an enjoyable experience. I would like to thank Professors Sami Rizkalla, Rudi Seracino, and Eric Laber for agreeing to serve on my committee and their continued support in this research. I offer my sincere appreciation for the learning opportunities provided by my committee.
I would like also to acknowledge the support, guidance and wisdom of Dr. Gregory Lucier, CFL lab manager, during the past three years. I would like also acknowledge the contributions of the technical staff of CFL (Mr. Jonothan McEntire, and Mr. Jerry Atkinson) as well as the contributions of technical staff of AIF (Mr. Chuck Mooney and Mr. Roberto Garcia) for their assistance and help.
The financial support that I received from the Department of Civil, Construction and Environmental Engineering at North Carolina State University is greatly appreciated.
Table of Contents
List of Tables ... viii
List of Figures ... ix
1. Introduction ... 1
1.1 1.2 Objectives ... 2
Thesis organization ... 2
2. Effect of Damage on Moisture Transport in Concrete ... 5
2.1 Introduction ... 5
2.2 Material and Methods ... 8
2.2.1 Materials, mixture proportioning, and specimens preparation ... 8
2.2.2 Freeze-thaw testing ... 10
2.3 Damage Detection Methods ... 10
2.3.1 Acoustic Emission ... 10
2.3.2 Ultrasonic Pulse Velocity ... 11
2.3.3 Scanning Electron Microscopy (SEM) ... 12
2.3.4 Electrical resistivity ... 12
2.3.5 Saturated hydraulic conductivity ... 13
2.3.6 Water absorption ... 15
2.3.7 Desorption isotherm ... 15
2.4 Results ... 16
2.4.1 Damage detection methods ... 16
2.4.2 Scanning electron microscope ... 19
2.4.3 Electrical resistivity ... 22
2.4.4 Saturated hydraulic conductivity ... 23
2.4.5 Water sorption ... 24
2.4.6 Desorption isotherm ... 25
2.5 Discussion ... 26
2.5.1 Phenomenological explanation of the effect of damage on the initial and secondary sorptivity ... 26
2.5.2 The correlation between saturated and unsaturated flow in damaged concrete based on Sharp Front Theory ... 31
2.5.3 Conceptual damage models ... 37
2.6 Cluster Explanation ... 43
2.7 Chapter Conclusions ... 48
3. A Comparison of Methods to Evaluate Mass Transport in Damaged Mortar ... 50
3.1 3.2 Introduction ... 50
Material and Methods ... 53
3.3 3.4 3.5 4.3 4.4 4.5 5.3 5.4 5.5
Background ... 95
5.2.1 Nonlinear Resonance Vibration ...95
5.2.2 Axisymmetric Flexural Vibration of a Thick Circular Plate ... 98
Materials and Methods ... 103
5.3.1 Materials ... 103
5.3.2 Freeze-thaw test ... 104
5.3.3 Acoustic emission measurements ... 104
5.3.4 Nonlinear impact resonance acoustic spectroscopy measurements ... 105
Results and discussion ... 107
5.4.1 Passive and active acoustic emission ... 107
5.4.2 Nonlinear impact resonance acoustic spectroscopy ... 109
Chapter Conclusion ... 111
3.2.3 Methods...54
Results and Discussion ... 59
3.3.1 Acoustic Emission... 59
3.3.2 Rapid Chloride Penetration Test (RCPT)... 62
3.3.3 Electrical resistivity... 64
3.3.4 Sorptivity ... 66
3.3.5 Permeability...67
3.3.6 Drying:... 68
3.3.7 Desorption isotherm... 71
Evaluating transport methods...72
Chapter Conclusion ... 74
4. Numerical Simulation of Unsaturated Moisture Transport in Damaged Mortar and Concrete ... 75
4.1 4.2 Introduction... 75
Numerical Methods ... 77
4.2.1 2.1 General ... 77
4.2.2 van Genuchten – Maulem Model ... 77
4.2.3 Numerical Simulation and Experimental Corroboration... 80
Materials and Methods... 82
4.3.1 Materials... 82
4.3.2 Desorption Isotherm ... 83
4.3.3 Saturated Hydraulic Conductivity... 84
Results and Discussion ... 84
4.4.1 Material Parameters... 84
4.4.2 Simulation of Unsaturated Mass Transport in Mortar ... 87
4.4.3 Simulation of Unsaturated Mass Transport in Concrete... 90
Chapter Conclusion ...92
5. Estimating Freeze-Thaw Damage in Concrete using Nonlinear Acoustic Spectroscopy ... 93
List of Tables
Table 2-1: Mix proportion of concrete... 9
Table 2-2: The saturation water content, the initial water content, the wetting front suction head, and the normalized wetting front suction head for concrete with different degree of damage ... 34
Table 2-3: Computed values of the Brooks and Cory model for concrete with different degree of damage ... 36
Table 3-1: Summary of previous studies on mass transport in cracked cement-based materials ... 52
Table 3-2: List of test methods and the number of specimens and their dimensions ... 54
Table 3-3: Change in water content in specimens with different degrees of damage. ... 70
Table 3-4: Comparison of different transport measurement methods ... 73
Table 4-1: Mix proportions of concrete and mortar... 83
Table 4-2: Saturated hydraulic conductivity, saturation water content, and van Genuchten model parameters for mortar specimens ... 86
Table 4-3: Saturated hydraulic conductivity, saturation water content, and van Genuchten model parameters for concrete specimens ... 86
List of Figures
Figure 2-1: Photograph of sealed concrete specimens used in acoustic ... 11 Figure 2-2: Saturated hydraulic conductivity measurement equipment: (a) photograph of the
equipment; (b) schematic illustration of the equipment ... 14 Figure 2-3: (a) Degree of damage calculated based on reduction in elastic modulus monitored
using active acoustic emission and ultrasonic pulse velocity; (b) amplitude of captured acoustic events during the freeze-thaw loading using passive acoustic emission ... 17 Figure 2-4: Scanning Electron Microscope (SEM) Images of concrete specimens with
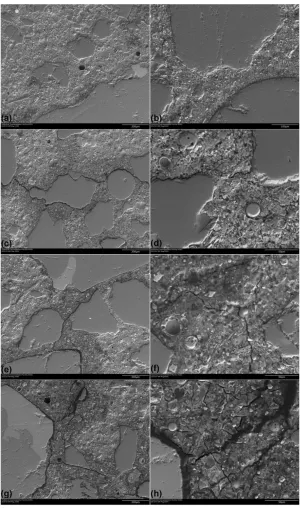
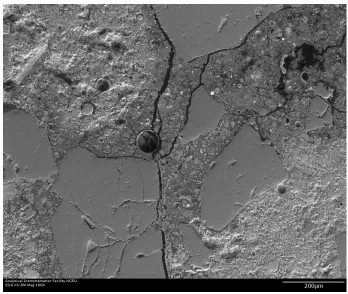
different degrees of damage (D) with two magnifications: (a) D=0,100X; (b) D=0, 200X;(c) D=10.1%, 100X; (d) D=10.1%, 500X; (e) D=28.6%, 100X; (f) D=28.6%, 500X; (g) D=47.2%, 100X; (h) D=47.2%, 500X. ... 20 Figure 2-5: Scanning Electron Microscope (SEM) image of concrete with 47.2% damage
illustrating the connectivity of the cracks with an air void ... 21 Figure 2-6: Reduction of the normalized electrical resistivity of concrete samples with
increased damage; the normalized values are obtained by dividing the resistivity in damaged specimens to the resistivity of the undamaged samples ... 23 Figure 2-7: Increase in normalized saturated hydraulic conductivity of damaged concrete
samples; the normalized values are obtained by dividing the SHC in damaged specimens to the SHC of the undamaged samples ... 24 Figure 2-8: (a) Water sorption of concrete specimens during the first 90 days; (b) normalized
initial and secondary water sorptivity of concrete as a function of degree of damage; the initial and secondary sorptivity values are normalized to the initial and secondary
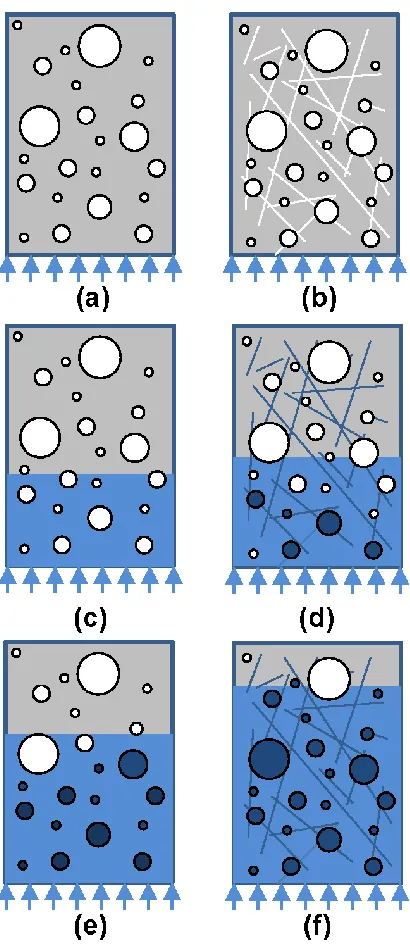
sorptivity of undamaged concrete respectively... 25 Figure 2-9: Desorption isotherm of concrete specimens with different degrees of damage .. 26 Figure 2-10: Schematic illustration of the effect of damage on water absorption in concrete;
the left and right column, respectively, illustrate the undamaged and damaged materials; cracks act as additional porosity, provide access to capillary pores away from the
exposed surface of the specimen, and provide access to air-filled voids during the first absorption period; therefore, the initial sorption rate is higher in damaged materials as compared to undamaged materials; during the secondary sorption period, a smaller fraction of air-filled voids are empty in the damaged material and therefore the
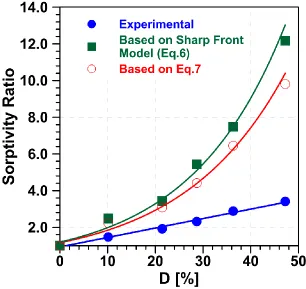
secondary sorption rate decreases with increase of damage. ... 29 Figure 2-11: Comparison of experimentally obtained sorptivity ratios with the sorptivity
ratios calculated based on sharp front theory using Eqs. (6) and (7) ... 37 Figure 2-12: Schematic illustration of an idealized damaged porous material with unit cross
section (𝐰. 𝐝 = 𝟏) and 𝓝 idealized parallel plate cracks with an average crack width of
lines) illustrate the dangling ends. Dashed lines illustrate the loops of the backbone (after Stanley 1977)... 44 Figure 3-1: Damage formation during the freeze-thaw loading monitored by passive acoustic
emission: (a) first 5 cycles in 25 mm sample, (b) last 5 cycles in 25 mm sample, (c) the total number of events in each freeze-thaw cycle in 25 mm sample, (d) first 5 cycles in 50 mm sample, (e) last 5 cycles in 50 mm sample, (f) the total number of events in each freeze-thaw cycle in 50 mm sample... 61 Figure 3-2: Damage measurement based on acoustic emission (AE) ... 62 Figure 3-3: The results of Rapid chloride penetration test (RCPT): (a) transferred current
during the RCPT, (b) change in total charge passed. ... 64 Figure 3-4: (a) Normalized bulk electrical resistivity, to the resistivity of undamaged mortar,
of mortar specimens, (b) normalized surface resistivity as a function of damage. ... 65 Figure 3-5: (a) Water sorption of mortar specimens with different degrees of damage during
the first 150 days; (b) degree of saturation of mortar specimens with different degrees of damage; (c) normalized initial and secondary water sorptivity of mortar specimens as a function of damage. ... 67 Figure 3-6: Normalized change of permeability with damage. (a) air permeability, (b) water
permeability. ... 68 Figure 3-7: Change in water weight in mortar specimens with different degrees of damage
during the first 60 days. ... 70 Figure 3-8: Desorption isotherm of mortar specimens with different degrees of damage. .... 72 Figure 4-1: Schematic of numerical procedure and experimental corroboration of unsaturated
moisture transport modeling. ... 81 Figure 4-2: Desorption isotherm of specimens with different degrees of damage; (a) mortar,
(b) concrete ... 85 Figure 4-3: Experimental and numerical sorption results for mortar specimens with different
degrees of damage; a) D=0%, b) D=18%, c) D=30%, d) D=48% ... 88 Figure 4-4: Initial sorptivity of mortar as a function of damage ... 89 Figure 4-5: Experimental and numerical sorption results for concrete specimens with
different degrees of damage; a) D=0%, b) D=10%, c) D=21%, d) D=29%, e) D=36 %, f) D=47% ... 91 Figure 4-6: Initial sorptivity of concrete as a function of damage ... 92 Figure 5-1: (a) Schematic illustration of linear frequency shift, ΔF, and nonlinear frequency
shift, (b) Schematic illustration of quality factor, Q, calculation. ... 97 Figure 5-2: Flowchart of the semi-analytical approach for computing dimensionless
resonance frequency parameter, Ω0. ... 102
Figure 5-3: Resonance frequency parameter, Ω0, for disks with different diameters and thicknesses. a) 𝝑 = 0.20, b) 𝝑 = 0.25. ... 103 Figure 5-4: a) Nonlinear impact resonance acoustic spectroscopy measurement test setup. b)
Aluminum resonance frequency shift and dynamic elastic modulus values. ... 106 Figure 5-5: Passive acoustic emission: a) for samples during first five cycles. b) for samples
Figure 5-6: a) Normalized resonance frequency shift and b) normalized Q-factor shift, with increased accelerations. ... 110 Figure 5-7: (a) Increase of nonlinear parameter 𝛃 with damage, (b) Change in nonlinear
1.
Introduction
The deterioration rate of concrete structures is directly influenced by the ingress of moisture. Therefore, moisture transport influences the majority of deterioration mechanisms of concrete structures. Cracks accelerate the moisture transport and therefore deterioration processes by providing preferential flow paths for movement of water and aggressive agents. To accurately estimate the degradation rate, methodologies to account for the effect of discrete and distributed cracks in service life prediction tools need to be developed. To account for the effect of cracks, their effect on moisture transport in concrete needs to be fully understood and quantified.
While previous studies have enhanced the understanding of the role of cracks and damage, the majority of these studies have investigated the role of cracks and damage in saturated systems. There is a lack of data on the effect of cracks and damage on unsaturated transport. A literature survey also indicates a lack of models that can adequately describe the experimental observations. This research provides fundamental insight to the effect of damage on saturated and unsaturated moisture transport.
rarely interpreted in the light of transport mechanisms used in the measurement methods. Third, it is unclear which transport mechanism, and subsequently which measurement method, is more sensitive to the presence of damage. Therefore, this research investigates how do different measurement techniques show the effect of damage on mass transport, and which transport measurement method is more sensitive to the presence of damage.
1.1
Objectives
The objectives of present research are to:
Investigate the effect of damage (distributed cracks) on mass transport properties of concrete and understand how damage changes the mechanisms of mass transport in cement-based materials,
Understand how damage affects different mass transport mechanisms,
Understand whether classical unsaturated transport can be used to model unsaturated transport in damaged materials.
Develop a new method to estimate damage in cement-based materials using Nonlinear Acoustic Spectroscopy in the absence of prior knowledge of the undamaged properties.
1.2
Thesis organization
In Chapter 2, three objectives were studied: (i) how damage affects the saturated and unsaturated moisture transport as well as electrical resistivity of concrete. Conceptual models were developed based on the fundamentals of damage mechanics and fluid transport to analytically describe the effect of damage, (ii) whether one-dimensional analyses based on the Sharp Front Theory can explain the relationship between the saturated and unsaturated moisture transport in damaged concrete, and (iii) which transport property and therefore which measurement method is more sensitive to damage. This chapter in the present format is published in Ghasemzadeh and Pour-Ghaz (2014).
In chapter 3, it is investigated which transport measurement method appropriately quantify the effect of damage in mass transport. Therefore, mass transport properties were measured using electrical resistivity, rapid chloride permeability, sorptivity, drying, air permeability, water permeability, and desorption isotherm. This chapter in the present format is submitted for publication (Ghasemzadeh and Pour-Ghaz 2015).
In chapter 5, it is investigated whether Nonlinear Impact Resonance Acoustic Spectroscopy (NIRAS) technique can provide a method, using nonlinear parameter and nonlinear quality factor (Q-factor) parameter, to estimate the damage in the absence of prior knowledge of intact material. This study in the present format is submitted for publication (Rashetnia et al. 2015).
2. E
ffect
of
D
amage
on
M
oisture
T
ransport
in Concrete
2.1
Introduction
The premature deterioration of reinforced concrete (RC) structures is a major concern for infrastructure owners (Ghasemzadeh et al. 2013, Shekarchi et al. 2012a). Cracks accelerate the deterioration processes by providing preferential flow paths for water and aggressive agents. Therefore, to accurately estimate the degradation rate, methodologies to account for the effect of discrete and distributed cracks in service life prediction tools need to be developed. To account for the effect of cracks, their effect on moisture transport in concrete needs to be fully understood and quantified.
Cracking can be classified into discrete (or localized) or distributed cracking (network of micro-cracks). Discrete cracks are typically a result of mechanical loading, thermal or shrinkage cracking in concrete. Distributed cracking (referred to as “damage” hereafter) is often associated with cracking due to moisture gradient, freeze-thaw, and Alkali Silica Reaction (ASR) (Langton 2012). Discrete cracking and damage often coexist. While both accelerate the fluid ingress, due to the significant geometric differences between them, they are generally separately dealt with in modelling efforts.
Damage can also accelerate the ingress of water and aggressive agents in concrete (Chung et al. 2010, Yang et al. 2006, Yang et al. 2004, Jacobsen 1998, Wiens et al. 1997, Jakobsen et al. 1996, Saito et al. 1994, Ghassemzadeh et al. 2010, Shekarchi et al. 2012b). Jacobsen et al. (1996) observed that freeze-thaw induced damage reduces the compressive strength and increase the chloride penetration rate up to 7.9 times. Fagerlund (1996) showed that water absorption increases with increased micro-cracking due to freeze-thaw. Wiens et al. (1997) also showed that micro-cracking due to freeze-thaw increases the rate of water and deicing salt penetration. Yang et al. (2006) reported a linear increase of water absorption and bilinear increase of electrical conductivity with damage caused by freeze-thaw. Chung et al. (2010) also showed that concretes that experienced freeze-thaw damage show a high chloride transport rate.
moisture transport in damaged concrete, and (iii) which transport property and therefore which measurement method is more sensitive to damage. Material constants are also provided for numerical modelling of unsaturated transport in the specific damaged concrete investigated in this paper.
In this work damage was induced by freeze-thaw and is quantified using Ultrasonic Pulse Velocity (UPV) and active acoustic emission. Passive acoustic emission measurements were also performed to monitor damage development during the freeze-thaw cycles. The water permeability (Saturated Hydraulic Conductivity – SHC) of damaged concrete specimens were measured using a newly developed equipment. Desorption isotherm, sorption, and electrical resistivity measurements were performed.
In the following of this chapter, materials and methods used in this research are presented. This is followed by the results section. Then the results are discussed in detail and analytical calculations and the conceptual damage models are presented. Finally the conclusions of this study are presented.
2.2
Material and Methods
2.2.1 Materials, mixture proportioning, and specimens preparation
Crushed limestone aggregate with a maximum aggregate size of 19 mm and natural river sand with a fineness modulus of 2.67 were used. The concrete was produced by a local ready-mix producer according to ASTM C94. Table 2-1 provides the concrete mixture proportion.
Table 2-1: Mix proportion of concrete
Cement Fly ash Type (F) Water Coarse Aggregate
Fine Aggregate
Water Reducer
kg/m3 kg/m3 kg/m3 kg/m3 kg/m3 kg/m3
261 83 132.5 1073 747 0.50
2.2.2 Freeze-thaw testing
An air-cooled freeze-thaw chamber was used. Each cycle was 12 hours including a 2-hour cooling period from 20°C to -23ºC, a 4-hour rest period at -23ºC, 2-hour heating period from -23ºC to 20°C, and a 4-hour rest period at 20ºC. The slow transition period and the rest periods were considered to ensure that the core temperature of all samples with different thickness reach to equilibrium with the air. All specimens were wrapped in a water saturated cloth and were sealed using a thin plastic sheet to keep them saturated during the freeze-thaw testing (Li et al. 2011). A total of five cycles were used and after each cycle a set of specimens were removed from the chamber while other specimens were left to undergo further freeze-thaw cycles.
2.3
Damage Detection Methods
2.3.1 Acoustic Emission
rigid stainless steel frame that was isolated from the chamber to minimize vibration and noise. A stainless steel rod was also used as a “reference” specimen to monitor the environmental noise during the test and to ensure that the coupling agent did not degrade during freeze-thaw (Li et al. 2011).
Figure 2-1: Photograph of sealed concrete specimens used in acoustic emission test; a stainless steel rod that does not undergo freeze-thaw
damage was used as a reference sample
2.3.2 Ultrasonic Pulse Velocity
robust contact between the transducers and the specimen. Similar approach was previously used by Jacobsen et al. (1996).
2.3.3 Scanning Electron Microscopy (SEM)
Scanning Electron Microscopy (SEM) specimens were dried in an oven at 50°C for 48 hours. To minimize cracking during cutting /polishing of the specimens, they were impregnated with an ultra-low viscosity epoxy (200-350 centipoise) under high pressure vacuum pump (0.015 mm Mercury). Impregnated specimens were then cured in an oven at 50° C for 10 hours and were then cut and polished with silicon carbide sand papers (60, 120, 240, 320, 400, 600, 800 and 1200 grits) and a half-micron diamond suspension. Backscattered mode was used for SEM imaging with pressure and accelerating voltage of 30 Pa and 20.0 kV.
2.3.4 Electrical resistivity
Electrical Impedance Spectroscopy (EIS) was used to measure the bulk electrical resistivity of the specimens. Measurements were performed with 500 mV amplitude over a frequency range of 1 Hz to 1 MHz. A total of seven specimens for each degree of damage was measured. To minimize the effect of temperature, specimens were placed in a large water bath at 23+1oC,
2.3.5 Saturated hydraulic conductivity
In this research, it is intentionally used the term “saturated hydraulic conductivity (SHC)” instead of permeability to avoid confusion with different definitions, terminologies, and units that have been used in literature for “permeability” of concrete. The authors define the SHC,
𝐾𝑠 with dimensions [LT-1], for a homogeneous isotropic material per Darcy’s law (𝑞 =
−𝐾𝑠 ∇ℎ) where 𝑞 is the Darcy flux and ∇ℎ is the hydraulic gradient (Charbeneau 2006).
Figure 2-2: Saturated hydraulic conductivity measurement equipment: (a) photograph of the equipment; (b) schematic illustration of the equipment
2.3.6 Water absorption
Water absorption measurements were carried out similar to the ASTM C1585 procedure with the difference that the specimens were 25 mm (1 inch) thick instead of 50 mm. A total of three specimens were used for each degree of damage. The water absorption tests were carried out for 90 days.
2.3.7 Desorption isotherm
The concrete specimens were conditioned at six relative humidities using four saturated salt solutions (MgCL2 (32.8% RH), NaCL2 (75.3% RH), KCL (85.1% RH), and KNO3 (93.6%
2.4
Results
2.4.1 Damage detection methods
Figure 2-3a shows the measured degree of damage with active acoustic emission and UPV. The damage index (D) is calculated based on the wave travel time in damaged and undamaged specimens and calculating the relative elastic modulus based on equation 2-1.
D = 1 − Et
Eo= 1 − ( to
tt) 2
Eq. 2-1
where Et is the dynamic elastic modulus after freeze-thaw, Eo the initial dynamic elastic
modulus before freeze-thaw, tt is the signal transmission time after freeze-thaw, and to is the
Figure 2-3: (a) Degree of damage calculated based on reduction in elastic modulus monitored using active acoustic emission and ultrasonic pulse velocity; (b) amplitude of captured acoustic events
during the freeze-thaw loading using passive acoustic emission
the rest of this paper the damage index measured by UPV-250-1" were used in analyzing the data.
Figure 2-3b illustrates the peak amplitude of the captured acoustic emission events (average of three specimens). In all cycles, acoustic emission events start at the temperatures below -10oC with a small number of events observed at temperatures above -10oC. The events captured
at temperatures below -10oC are mainly due to cracking of the concrete. Pore solution freezes
at temperatures lower than 0oC due to the effect of dissolved salts in the pore solution as well
as the effect of pore confinement (Fagerlund 1973 and Helmuth 1960).
2.4.2 Scanning electron microscope
Figure 2-4: Scanning Electron Microscope (SEM) Images of concrete specimens with different degrees of damage (D) with two magnifications: (a) D=0,100X; (b) D=0, 200X;(c) D=10.1%, 100X;
Figure 2-5 illustrates a SEM image of a concrete specimen with 47.2% damage. It can be seen that cracks are connected to an air void. A similar observation has been previously reported by Yang et al. (2006). The connectivity of the cracks to air voids significantly affects the transport properties of concrete, specifically, it affects the secondary water sorptivity of the specimens as will be discussed later.
2.4.3 Electrical resistivity
Figure 2-6 illustrates the change in the normalized electrical resistivity with damage. The normalized resistivity was obtained by dividing the resistivity of each specimen to its initial resistivity (ρo =150.03 Ohm.m average of seven specimens). A “slight” bilinear reduction is
Figure 2-6: Reduction of the normalized electrical resistivity of concrete samples with increased damage; the normalized values are obtained by dividing the resistivity in damaged specimens to the
resistivity of the undamaged samples
2.4.4 Saturated hydraulic conductivity
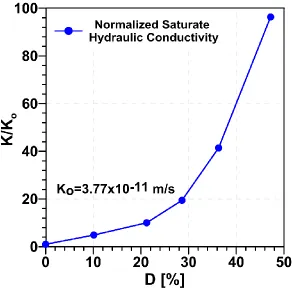
Figure 2-7 illustrates the normalized SHC of the specimens where the SHC values are normalized to the average SHC of the undamaged concrete (Ko=3.77x10⁻¹¹ m/s). The SHC
Figure 2-7: Increase in normalized saturated hydraulic conductivity of damaged concrete samples; the normalized values are obtained by dividing the SHC in damaged specimens to the SHC of the
undamaged samples
2.4.5 Water sorption
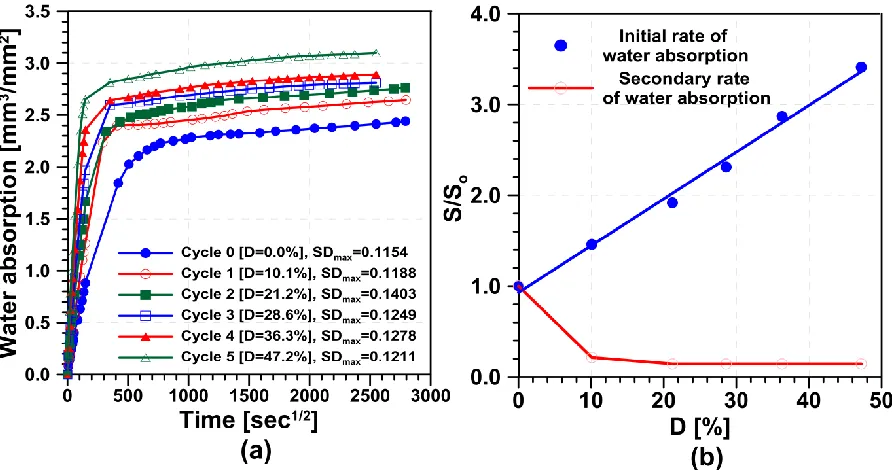
sorptivity of concrete to those of the undamaged sample. The initial sorptivity increases linearly with damage. The secondary sorptivity initially decreases with damage and then remains approximately independent of damage (although slight decrease can be observed). Note that in Figure 2-8a damage mainly affects the transition period between the two linear regions.
Figure 2-8: (a) Water sorption of concrete specimens during the first 90 days; (b) normalized initial and secondary water sorptivity of concrete as a function of degree of damage; the initial and secondary sorptivity values are normalized to the initial and secondary sorptivity of undamaged
concrete respectively
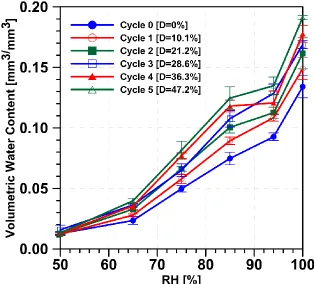
2.4.6 Desorption isotherm
showing that cracks act as capillary porosity and retain more water within the material. The isotherm suggests that the cracks from freeze-thaw cover a rather wide range of sizes below what is observed in SEM images (illustrated in Figure 2-4 and Figure 2-5).
Figure 2-9: Desorption isotherm of concrete specimens with different degrees of damage
2.5
Discussion
2.5.1 Phenomenological explanation of the effect of damage on the initial and secondary sorptivity
of the capillary pores by capillary suction and the second linear portion (secondary sorption period) is attributed to the slow water transport to larger (as compared to capillary pores) air -filled pores by air-dissolution process (Fagerlund 2012). Secondary sorptivity is also attributed in part to micro-structural changes such as swelling of calcium silicate hydrate (C-S-H) gel and rehydration (Hall et al. 1995). Counterarguments, however, have also been made against swelling of C-S-H (Hanzic et al. 2010).
The authors explain the effect of damage on both water absorption stages using the abovementioned mechanisms by Fagerlund (2012). The distributed cracks affect the initial sorptivity by three mechanisms: (i) cracks act as capillary tubes increasing the porosity of the material. The desorption isotherms in Figure 2-9 support this concept showing that the distributed cracks may be considered as additional capillary porosity with a wide size distribution; (ii) cracks act as preferential flow paths providing access to capillary pores away from the exposed surface of the specimen; and (iii) cracks provide access to the larger air-filled pores, and therefore, some of these pores (that are generally filled during the secondary sorption period) will be filled during the initial sorption period. The SEM image in Figure 2-5 which shows that some of the cracks are connected to an air void supports this concept.
It should be noted that air voids do not produce a significant capillary suction due to their large size. Therefore, during the first sorption period, in damaged material, only very small air voids are filled with water by capillary suction. Cracks also accelerate the air-dissolution process in air voids. Thus, during the first sorption period, a portion of air voids are filled by a combination of capillary suction and accelerated air-dissolution process. It is also possible that, during the first sorption period in damaged materials, water forms a thin film on the wall surface of large pores that lack capillary suction (Hanzic et al. 2010).
2.5.2 The correlation between saturated and unsaturated flow in damaged concrete based on Sharp Front Theory
In this section, analyses based on the Sharp Front (SF) model are performed to understand whether the effect of damage on saturated flow (saturated hydraulic conductivity – SHC) can be used to describe the effect of damage on unsaturated flow. The SF model is based on simplifying assumptions that enable obtaining a closed-form solution. The SF model was originally developed by Green and Ampt (1911) and has been improved since (e.g., Hall and Hoff 2011 and the references therein). The fundamental assumptions in SF model include: (i) flow is one-dimensional and uniformly progresses in an semi-infinite domain, (ii) the initial water content is uniform throughout the material and remains uniform and equal to the initial water content ahead of the wetting front, (iii) the water content is uniform behind the wetting front and is equal to the saturation water content or some value very close to it, and (iv) the wetting front is sharp (e.g., step function) and changes abruptly from the water content behind the wetting front to the initial water content.
function. For simplicity, the gravitational effects, the effect of air flow, and air compressibility are ignored herein. Gravitational effects are negligible in this case due to the small pore size distribution of concrete and small height of the samples (Hall 1994). Variations of SF model that account for the gravitational effect (Hall 1994), air displacement by water (Wang et al. 1998) and air compressibility (Culligan et al. 2000) have been proposed by others. The SF model can be written as equation 2-2 (Charbeneau 2006)
I(t) = Knst + (θns− θi)(H + ψf) ln (1 +
I(t)
(θns− θi)(H + ψf))
Eq.2-2
where I(t) is the cumulative absorption at time t per unit area of the specimen, Knsis the SHC of the wetted region, θns is the water content of the wetted region, θi is the initial water content,
H is the height of the ponding water, and ψf is the wetting front pressure head. Note that
Knsand θnsare some value close to (but not equal to) the SHC, Ks, and the saturation water content, θs. For simplicity, it is assumed Kns≈ Ks and θns≈ θs. Using logarithmic expansion, equation 2-2 is reduced to the short-term expression in equation 2-3 (Charbeneau 2006)
I(t) = √2Ks(θs− θi)(H + ψf)t Eq.2-3
S = √2Ks(θs− θi)(H + ψf) Eq.2-4
Since equations 2-3 and 2-4 are obtained by short-term expansion, equation 2-4 corresponds to the initial sorptivity. In sorption test, in general H = 0 (since absorption is upward) and equation 2-4 reduces to
S = √2Ks(θs− θi)ψf Eq.2-5
While simple, equation 2-5 provides significant insight to the behaviour of the material: (i) sorptivity increases linearly with square root of SHC, (ii) difference between saturation and initial water content (i.e., θs− θi) indicates that the sorptivity decreases as the initial water content increases; this was experimentally shown in (Castro et al. 2011a, Parrott 1994, and Parrott 1991), (iii) if the information about ψf (the wetting front pressure head) is available,
equation 2-5 can be used to estimate the SHC of concrete from sorption data. Equation 2-6, below, is obtained by taking the ratio of the sorptivity for two materials using equation 2-5:
S2
S1 = √
Ks,2
Ks,1 √
θs,2− θi,2
θs,1− θi,1 √
ψf,2
ψf,1
Eq.2-6
increases linearly with square root of ratio of SHC. By considering undamaged and damaged concrete as material 1 and 2, respectively, a theoretical initial sorptivity ratio is obtained. Equation 2-6 can be further simplified by neglecting the contribution of the last two factors on the right hand side and can be written in the form of equation 2-7
S2 S1 = √
Ks,2
Ks,1 Eq.2-7
To calculate the sorptivity ratio based on equation 2-6, the values of SHC shown in Figure 2-7 are used. The saturation and the initial water content for concrete with different degree of damage are experimentally obtained and reported in Table 2-2: The saturation water content, the initial water content, the wetting front suction head, and the normalized
wetting front suction head for concrete with different degree of damage to calculate the second term on the right hand side of equation 2-6.
Table 2-2: The saturation water content, the initial water content, the wetting front suction head, and the normalized wetting front suction head for concrete with different degree of damage
Damage (%) θs [mm3/mm3]
θi
[mm3/mm3]
𝜓𝑓 [𝑐𝑚 − 𝐻2𝑂]
ψf,2 ψf,1
0 0.134 3.14x10⁻³ 34.55x10³ 1.00
10.1 0.149 3.75 x10⁻³ 38.38 x10³ 1.11
21.2 0.162 4.15 x10⁻³ 35.64 x10³ 1.03
28.6 0.169 3.25 x10⁻³ 41.45 x10³ 1.20
36.3 0.178 3.13 x10⁻³ 34.83 x10³ 1.01
ψf= ∫ kr(ψ)dψ ψi
0
Eq.2-8
where ψ is pressure head , ψi is the pressure head at the initial water content, and kr is the
relative hydraulic conductivity which can be described 𝑘𝑟using van Genuchten (Van Genuchten 1980) or Brooks and Cory (1964) models. Both models require the desorption isotherm that are provided in Figure 2-9. In general, ψi can be considered as infinity (ψi = ∞)
since the initial pressure head of material is very large (Charbeneau 2006). In this work, Brooks and Cory model is used. The pressure head values were calculated from the relative humidity values in the desorption isotherm (Pour-Ghaz 2011). The Brooks and Cory model was then used in Burdine equation (Charbeneau 2006) to calculate 𝑘𝑟. The expression for 𝑘𝑟 was then used in equation 2-8 and the closed-from solution presented in equation 2-9 was obtained (Charbeneau 2006).
𝜓𝑓=
2 + 3𝜆
1 + 3𝜆 𝜓𝑏 Eq.2-9
Table 2-3: Computed values of the Brooks and Cory model for concrete with different degree of damage
Degrees of Damage (D) [%]
0 10.1 21.2 28.6 36.3 47.2
𝜓𝑏(𝑐𝑚 − 𝐻2𝑂) 5.03 x10⁴ 5.60 x10⁴ 5.13 x10⁴ 6.04 x10⁴ 4.98 x10⁴ 5.32 x10⁴
𝜆 0.559 0.566 0.525 0.559 0.500 0.520
Figure 2-11: Comparison of experimentally obtained sorptivity ratios with the sorptivity ratios calculated based on sharp front theory using Eqs. (6) and (7)
2.5.3 Conceptual damage models
The authors propose new conceptual models that are based on the definition of damage in damage mechanics and fluid transport to describe the effect of damage on SHC, electr ical resistivity, and water absorption. These models are based on an idealized damaged porous material shown in Figure 2-12 with a unit cross sectional area (for simplicity assume 𝑤 =
Figure 2-12: Schematic illustration of an idealized damaged porous material with unit cross section (𝐰. 𝐝 = 𝟏) and 𝓝 idealized parallel plate cracks with an average crack width of 〈𝐇〉 that are equally
spaced throughout the material with an average crack spacing of 𝐛̅.
In classical damage mechanics, damage (D) is defined as the area ratio of the discontinuities to the total area of the materials (Lemaitre and Lippmann 1996).
𝐷 = area of discontinuities
𝑤. 𝑑 =
𝒩(〈𝐻〉. 𝑑)
𝑤. 𝑑 = 𝒩〈𝐻〉 Eq.1-10
cracks decreases at the later freeze-thaw cycles however damage continues to increase (Figure 2-3a). According to equation 2-10, therefore, at later freeze-thaw cycles where 𝒩 does not increase significantly, the average crack width, 〈𝐻〉, should increase.
Alternately, the damage parameter can be expressed by 𝐷 = 〈𝐻〉 𝑏̅⁄ where in deriving this expression it is assumed that the average crack width is significantly smaller than the average crack spacing (i.e., 〈𝐻〉 ≪ 𝑏̅ ) and a large number of cracks (i.e., 𝒩 + 1 ≈ 𝒩) exists in the materials. Using the schematic illustration in Figure 2-12, the volume fraction of cracks, 𝑓𝑓 =
𝒩〈𝐻〉, and the volume fraction of undamaged concrete matrix 𝑓𝑚 = 1 − 𝒩〈𝐻〉 is obtained.
2.5.3.1 The effect of damage on saturated hydraulic conductivity The effect of cracks on SHC can be described by a simple composite model
𝐾 = 𝑓𝑚𝐾𝑜+ 𝑓𝑓𝐾𝑓 Eq.2-11
𝐾 = (1 − 𝒩〈𝐻〉)𝐾𝑜+ 𝒩〈𝐻〉 {𝜌𝑔
12𝜇〈𝐻〉2} = (1 − 𝐷)𝐾𝑜+ 𝐶̅1 𝐷 〈𝐻〉2 Eq.2-12
where 𝐶̅1= 𝜌𝑔
12𝜇 is a constant. Equation 2-12 clearly illustrates the importance of crack width on SHC. The results of acoustic emission along with equation 2-10 suggest that crack width increases at the later stages of damage due to freeze-thaw. Therefore equation 2-12 suggests that SHC of damaged material should initially increase linearly with damage (when 〈𝐻〉 is small) and then the rate of increase of SHC should increase rapidly when 〈𝐻〉 becomes larger. This is observed in Figure 2-7 where, for example, with increase of damage from 36.3% (fourth cycle) to 46.2% (fifth cycle), the SHC increases drastically. While this is the largest increment of increase in SHC, the results of the acoustic emission test (Figure 2-3b) shows that the least number of events occur between the fourth and fifth cycle emphasizing the effect of crack width. Alternately, the increment of increase of SHC from zero to 10.1% damage is the smallest while the number of acoustic emission events is the largest.
2.5.3.2 The effect of damage on electrical resistivity
of the undamaged concrete matrix, 𝜎𝑚, and average conductivity of a crack, 〈𝜎𝑓〉 by equation 2-13:
𝜎̅
𝜎𝑚 = 𝑓𝑚 + 𝑓𝑓
〈𝜎𝑓〉 𝜎𝑚
Eq.2-13
In saturated systems, 〈𝜎𝑓〉 may be approximated by the conductivity of the pore solution, 𝜎𝑜, and some factor to account for tortuosity of the cracks. As a first order approximation
〈𝜎𝑓〉 𝜎⁄ 𝑚 = 𝜎𝑜⁄𝜎𝑚 can be considered as the formation factor, F (Rajabipour 2006). Using
𝑓𝑓 = 𝐷 = 𝒩〈𝐻〉, equation 2-13 can be rewritten
𝜎̅
𝜎𝑚 = 1 + 𝐷 ( 〈𝜎𝑓〉
𝜎𝑚 − 1) Eq.2-14
Inverse of equation 2-14 provides the resistivity ratio illustrated in Figure 2-6. Since
2.5.3.3 The effect of damage on capillary sorption
The volumetric flow rate, 𝑄, in a single parallel plate crack can be expressed by (Witherspoon et al. 1980):
𝑄 = 𝐶̅1
𝑃𝑐
ℎ 〈𝐻〉3 Eq.2-15
where 𝑃𝑐= 2𝛾 cos 𝜃
〈𝐻〉 represent the capillary suction pressure within the crack with the assumption of (〈𝐻〉 ≪ 𝑑 in Figure 2-12) , γ is the surface tension of the fluid, θ is the contact angle, and ℎ is the height of material (Figure 2-12). Since 𝑄 = 𝑑𝑉 𝑑𝑡⁄ where 𝑉 is the total volume of fluid entering into a crack, equation 2-15 can be integrated with respect to time to obtain the total volume of fluid entering into a single crack at time 𝑡 as 𝑉 = 〈𝐻〉3/2𝐶̅2√𝑡 (Pour-Ghaz 2014). The total volume of water, 𝑉𝑇, entering into N-cracks therefore can be expressed as
𝑉𝑇 = 𝒩〈𝐻〉3/2𝐶̅2√𝑡 = [𝐷〈𝐻〉1/2𝐶̅2]√𝑡 Eq.2-16
where 𝐶̅2=𝜌𝑔𝛾 cos 𝜃
width, 〈𝐻〉, in capillary sorption is less significant as compared to its effect on SHC (equation 2-12) – note the exponent of 〈𝐻〉. This explains the deviation of equations 2-6 and 2-7 (that are based SF model) from the observed linear increase in initial sorptivity in Figure 2-11: The SF model does not account for the contribution of crack width especially the contribution of large cracks.
To quantitatively use the proposed models, an estimate of average crack width is required which may be obtained, for example, using SEM imaging. In the absence of such information, these models can provide only qualitative insight to the experimental data.
2.6
Cluster Explanation
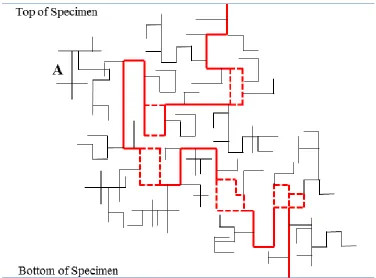
the thin (black lines) show the dangling ends. Dangling ends are the “dead-ends” and they do not contribute to the current flow (Stanley 1977).
Figure 2-13: Schematic illustration of a network of micro-cracks after percolation. Thick lines (red solid and dashed lines) show the backbone of the cluster. Thin lines (black lines) illustrate the
dangling ends. Dashed lines illustrate the loops of the backbone (after Stanley 1977).
flow. As the degree of damage increases, the number of dangling ends increases. The dangling ends merge and form more loops in the backbone, resulting in strengthening the conduction in backbone.
The percolating cluster, contributes to the increase of water sorptivity. The micro-cracks of the cluster act as capillary tubes and absorb water by capillary suction resulting in increased initial sorptivity. The dangling ends in the cluster also act as capillary tubes contributing to increase of water absorption. In addition, the dangling ends, facilitate access to the capillary pores that are far from the water absorbing surface (e.g., bottom of the specimen). For example, the dangling end A in Figure 2-13 provides rapid access to the capillary pores in its vicinity while these pores are far from the bottom of the specimen (assuming the water is absorbed from the bottom of the specimen). The percolating cluster will provide access to the air-filled pores and therefore some of the air-filled pores will be filled with water during the initial sorption period; and therefore, the rate of water absorption decreases during the secondary sorption period. This phenomenological explanation is in line with the effect of damage on the initial and secondary sorptivity that was discussed in section 2.5.1 and shown schematically in Figure 2-10.
is higher than the electrical conductivity of the undamaged cement paste due to the larger size of micro-cracks, less tortuosity of the micro-cracks, and more connectivity of the micro-cracks as compared to capillary pores. However, due to the contribution of the cement paste to electrical conductivity, the contribution of the micro-cracks to electrical conductivity is less pronounced as compared to the contribution of the cracks to saturated hydraulic conductivity (permeability). As the percolating cluster forms in the concrete, the electrical conductivity of the concrete increases. Due to the contribution of the cement paste itself to the conductivity (background conductivity), the systems containing clusters that are close to the critical percolating cluster size will also behave similar to the systems containing a percolating cluster and therefore, it is expected that “percolated behavior” for electrical conductivity to occur with smaller cluster size (smaller degree of damage).
The backbone is the main contributor to hydraulic conductivity, however, the dangling ends do not contribute to the hydraulic conduction. Another main contributing factor to hydraulic conduction is the crack width. The effect of crack width however is not considered in the percolation model shown in Figure 2-13. It is well known that the hydraulic conductivity of a crack increases linearly with square of crack aperture. Therefore, the rate of increase of saturated hydraulic conductivity should be higher than the rate of increase of electrical conductivity (decrease of electrical resistivity) because of the contribution of crack width.
2.7
Chapter Conclusions
In the present work, the effect of damage due to freeze-thaw on saturated and unsaturated moisture transport as well as electrical properties of concrete was experimentally investigated. The following summarizes the findings of this study.
The initial sorptivity increases linearly with degree of damage because (i) cracks act as capillary tubes that absorb water rapidly, (ii) cracks provide access to capillary pores within the specimen and away from the exposed surface (preferential flow paths), and (iii) cracks provide access to the larger air-filled pores, and therefore, some of these air-filled voids are filled with water during the initial sorption period resulting in higher initial sorption rate.
The secondary sorptivity initially decreases with damage, and then remains almost constant because cracks provide access to the larger filled voids and therefore some of these air-filled voids are air-filled with water during the initial sorption period leaving a smaller fraction of these air-filled voids empty for the secondary sorption period.
The Electrical resistivity shows a slight bilinear decreased with damage: The electrical resistivity initially decreases with a higher rate due to the formation of cracks and then the rate of decrease of resistivity decreases with further damage development since in the later stages the connectivity is enhanced but smaller number of new cracks are developed. The conceptual damage model developed approximates the bilinear decrease with a linear decrease.
The effect of damage and discrete cracking on the transport properties of cement-based materials has been studied in numerous investigations (Ghasemzadeh and Pour-Ghaz (2014), Samaha and Kenneth (1992), Aldea et al. (1999), Zhou et al. (2012), Akhavan et al. (2012), Zhou et al. (2012), Picandet et al. (2009), Yang et al. (2006), Torrijos et al. (2010), Wang and Ueda (2014), M’Jahad et al. (2014), Rashetnia et al. (2015), Gerard and Marchand (2000), De la Varga et al. (2014), Bentz et al. (2013), Fagerlund (2012), Jacobsen et al. (1996), Langton
3. A C
omparison of
M
ethods to
E
valuate
M
ass Transport in
D
amaged
M
ortar
3.1 Introduction
Different measurement methods have been used in these works and they all show that damage and cracking increases the mass transport. Table 3-1 summarizes previous works that studied the effect of discrete cracking and damage on transport properties of cement-based materials. These works, in Table 3-1, are classified based on the type of cracking: discrete cracking or damage. Three conclusions can be drawn from Table 3-1. First, the effect of discrete cracking is studied in more detail as compared to the effect of damage. Second, the effect of damage has been rarely interpreted in the light of transport mechanisms used in the measurement methods. Finally, it is unclear as which transport mechanism, and subsequently which measurement method, is more sensitive to the presence of damage.
In this study, damage was induced by freeze-thaw loading in mortar specimens. Active acoustic emission (AE) was used to quantify the degree of damage. Passive AE was also used to monitor damage formation during the freeze-thaw cycles. Electrical Impedance Spectroscopy (EIS) and four-electrode Wenner methods were used to measure the bulk and surface electrical resistivity, respectively. Rapid Chloride Penetration Test (RCPT) measurement was also used. Soprtion, drying, air permeability, water permeability and desorption isotherm measurements were also carried out.
Table 3-1: Summary of previous studies on mass transport in cracked cement-based materials
Study
Mechanism of
cracking
Material Measurement methods Highlights
Discrete cracking
Samaha and Hover (1992)[2]
Compressive load-induced cracking
Concrete
Mortar RCPT and Water absorption
The water absorption and chloride ion penetration differently reflect the effect of damage on transport properties of concrete as load levels increases.
Aldea et al. (1999) [3]
Split tensile
load-induced cracking Concrete
Water and chloride permeability
Water permeability is a more sensitive parameter, than chloride permeability, to crack width.
Chunsheng et al. (2012)[4]
Compressive
load-induced cracking Concrete
Air permeability, sorptivity and electrical resistivity
While gas permeability correlated with damage, sorptivity and electrical resistivity correlated with open porosity – the connected pores available for fluid flow.
Akhavan et al. (2012) [5]
Split tensile
load-induced cracking Mortar
Water permeability and image analysis on cracks
Permeability is a function of square of crack width. Crack tortuosity and roughness reduce the permeability.
Chunsheng et al. (2012)[6]
Compressive
load-induced cracking Concrete
Water absorption, gas permeability, electrical resistivity and crack geometry analysis
Crack geometry (i.e., length, orientation, and connectivity) and crack density have strong impact on transport properties.
Picandet et al. (2009) [7]
Split tensile
load-induced cracking Concrete Gas and water permeability
Cracks provide direct path to convey a large portion of flow, with no influence from saturation degree. Permeability could be considered as an intrinsic parameter to evaluate the global effect of load-induced damage on concrete durability.
Distributed cracking
Yang et al. (2006)
[8] Freeze-thaw loading Concrete
Water absorption and electrical resistivity
Sorptivity increases linearly with damage; electrical conductivity increases in a bilinear fashion.
Torrijos et al. (2010) [9]
Low RH with high
temperature and ASR Concrete
Water absorption and water permeability
Depending on the main transport mechanism, crack width, type of cracks and crack density differently affect the transport properties.
Wang and Ueda
(2014) [10] Freeze-thaw loading Concrete
Water absorption and chloride ion penetration
Water absorption and chloride penetration is faster in damaged specimens compared with undamaged concrete. The total amount of absorbed water in damaged specimens is more than undamaged specimens.
Jahad et al.
(2014) [11] Freeze-thaw loading Concrete
Mercury intrusion porosimetry, desorption isotherm, relative gas permeability, and gas breakthrough pressure
Gas breakthrough pressure seems to be a more sensitive indicator of damage than other studied methods.
Ghasemzadeh
and Pour-Ghaz Freeze-thaw loading Concrete
Water absorption, electrical resistivity, desorption isotherm and saturated hydraulic
The rate of moisture transport increases with damage. The extent to which damage affects the rate of transport is dependent on the mechanism of transport.
3.2
Material and Methods
3.2.1 Materials, mixture proportioning, and specimen preparation
Ordinary Portland cement Type I and river sand with a fineness modulus of 2.65 were used. The mortar mixture had a water-to-cement ratio (w/c) of 0.42. The amount of cement, fine aggregate, and water reducer in the mixture were 609 kg/m3, 1466 kg/m3, and 0.50kg/m3,
respectively. The mortar was made according to ASTM C192-07.
After casting mortar in 102 mm x 204 mm cylindrical molds, all of the samples were kept sealed for 24 hours. The samples were then demolded and cut into appropriate geometries (for different experiments as shown in Table 3-2) using a diamond-tipped wet saw. The top and bottom ends of the cylindrical specimens (roughly 25 mm) were not used to minimize possible end-effects. All of the specimens were cured in lime-saturated water at 25±1ºC for 18 months after cutting.
3.2.2 Freeze-thaw testing
testing, they were wrapped in a water saturated cloth and then were sealed with a thin plastic sheet. A total of 25 freeze-thaw cycles were used and specimens were removed from the chamber for testing after 2, 5, 10, 15, and 25 cycles.
3.2.3 Methods
A number of tests based on different mechanisms were performed. In Table 3-2, the number and the dimensions of the specimens used in each are provided. Detailed description of the testing equipment and processes are provided below.
Table 3-2: List of test methods and the number of specimens and their dimensions
Method Specimen details Number of Specimens* Diameter [mm] Thickness [mm]
Acoustic Emission (AE) 3 102 25&50 Rapid Chloride Penetration
Test (RCPT) 4 102 50
Electrochemical Impedance
Spectroscopy (EIS) 4 102 50
Surface Resistivity (SR) 3 102 204
Sorptivity 2 102 25
Drying 2 102 50
Air permeability 3 102 25
Water Permeability 4 102 25
Desorption isotherm 2 Specimens with 0.50-1.5 mm thick and 50-100 mg in weight**
3.2.3.1 Acoustic Emission
Active AE was used to monitor damage in mortar specimens at the end of each freeze-thaw cycles and passive AE was used to continuously monitor damage during the freeze-thaw cycles. AE sensors with a peak frequency of 375 kHz were used. Flat surfaces for mounting the sensors were created by trimming the side surfaces of specimen tangent to the perimeter. AE sensors were coupled to the specimen using vacuum grease. Specimens were placed on a layer of acoustic mat resting on a rigid stainless steel frame which was isolated from the chamber to minimize vibration and noise. A stainless steel rod was also used as a reference specimen to monitor the environmental noise during the test and to ensure that the coupling agent did not degrade during freeze-thaw. Further detailed information regarding the application of AE system on damage monitoring in cement-based materials can be found elsewhere (Ghasemzadeh and Pour-Ghaz (2014), Rashetnia et al. (2015), Kim and Weiss (2003), Li et al. (2011), and Farnam et al. (2014)).
3.2.3.2 Rapid Chloride Penetration Test (RCPT)
Rapid chloride penetration test (RCPT) was carried out according to the ASTM C1202-10.
3.2.3.3 Surface Resistivity
equilibrium with the ambient temperature (approximately 24 hrs). After each measurement, specimens were placed back in chamber to undergo more freeze-thaw cycles.
3.2.3.4 Electrical Resistivity
Bulk electrical resistivity was measured on 50 mm thick disk specimens, using EIS, after a given number of freeze-thaw cycles. Three different arrangements were used in measuring bulk electrical resistivity. First, the specimens were sandwiched between two stainless steel plate electrodes; to improve electrode contact, a copper-based conductive gel was used and measurement was performed using EIS ((Pour-Ghaz (2011), Spragg et al. (2011)). Second, specimens were installed in a RCPT cell and EIS was used to measure the bulk resistivity (Akhavan and Rajabipour 2011). Finally, the initial current from the RCPT measurements were utilized to measure the bulk electrical resistivity (Snyder et al. 2000). To provide a better comparison, the same specimens were used in all three methods for each degree of damage. EIS measurements were performed with amplitudes of 500 mV over the frequency range of 1 Hz to 1 MHz. Before measurements, specimens were kept in a large water container until they reach to thermal equilibrium with the ambient temperature (6-8 hours).
3.2.3.5 Sorptivity
3.2.3.6 Drying test
The drying rate of mortar specimens with different degree of damage were measured by monitoring mass loss in a chamber with a relative humidity of 50±5 % at 23±1°C. Prior to weight loss measurements, specimens were saturated under high vacuum (0.015 mm Mercury). Weight loss was continuously recorded with one minute intervals for the first 10 hrs and then the measurements were continued daily, up to 7 days, and weekly up to 60 days. Only one surface of the sample was subjected to drying and all other surfaces were sealed.
3.2.3.7 Air permeability
The air permeability of mortar specimens were measured using the method in (Schonlin and Hilsdorf (1988), Dilek and Leming (2008)). The vacuum pressure was induced using a vacuum pump. A vacuum pressure of 736 mm Hg was induced and then the time to reach to vacuum pressure at 635 mm Hg was recorded. Depending on the permeability of the specimens, measurements were completed in 1–30 min. To ensure air tightness of the equipment seals, tests were performed on a 25 mm thick aluminium disk and no pressure decay observed.
cracking (Villani et al. 2014). A thin strip of soft clay was also used to seal the chamber to the face of specimen.
The Boyle-Marriotte law was used to calculate the air permeability assuming the specimen is a homogeneous porous material. Air permeability is calculated per Eq. 3-1 (Dilek and Leming 2008).
𝐾(𝑎𝑖𝑟)= (𝑃𝑓− 𝑃𝑖) 𝑉𝑠
(∆𝑡) (𝑃𝑎−𝑃𝑖 + 𝑃2 𝑓)
𝐿
𝐴 𝐸𝑞. 3 − 1
where 𝐾(𝑎𝑖𝑟)is the air permeability index (m2/s), 𝑃𝑖 and 𝑃𝑓 are the initial and final vacuum pressure in the chamber (Pa) respectively, 𝑉𝑠 is the volume of vacuum chamber (m3), ∆𝑡 is the duration of measurement (s), 𝑃𝑎 is the atmospheric pressure (Pa), 𝐿 is the thickness of specimen (m), and 𝐴 is the cross section of the specimen (m2).
3.2.3.8 Water Permeability
3.2.3.9 Desorption Isotherm
The desorption isotherm of mortar specimens with different degrees of damage were measured using an automated vapour sorption analyzer. Measurements were performed at 23˚C. The specimen was equilibrated at 97.5% RH and the relative humidity was sequentially dropped from 97.5% to 0% RH, in 5% RH increments to 2.5% and then to zero RH. The sample was held at each RH step until it reached to equilibrium. Equilibrium was defined as a mass change less than 0.001 mg within 15 min (Pour-Ghaz et al. 2010). The specimens were 0.50-1.5 mm thick and 50-100 mg in weight. A full description of desorption isotherm experiment using automated sorption analyzer has been discussed in Pour-Ghaz et al. (2010), and Villani et al. (2014)).
3.3
Results and Discussion
3.3.1 Acoustic Emission
Figure 3-2 shows the degree of damage measured with active acoustic emission (AE) after a given number of freeze-thaw cycles. The damage index (D) is calculated based on the wave travel time in damaged and undamaged specimens (Ghasemzadeh and Pour-Ghaz (2014)). In Figure 3-2 results for specimens with 50 mm and 25 mm thickness are labelled by AE-50 and AE-25 respectively. A linear increase of damage with the number of freeze-thaw cycles is observed. Slightly higher damage is observed in 25-mm thick samples. This is in part a result of a lower core temperature in 25-mm thick disks as compared to 50-mm thick samples.
Figure 3-2: Damage measurement based on acoustic emission (AE)
3.3.2 Rapid Chloride Penetration Test (RCPT)
makes the reliability of RCPT questionable. There are three possible explanations for this observation. First, in the presence of high degree of damage, the chloride concentration reduces in the NaCl solution cell due to the transfer of high amount of chloride ions to the NaOH solution cell. This in turn reduces the amount of current transfer by chloride ions through the specimen. Second, the chloride concentration may be reduced in the system due to the chloride binding of hydration products (Spiesz and Brouwers 2012)). In the presence of high degree of damage, a higher amount of chloride ions can move into the specimen, thus increasing the chance of chloride binding, and thus, decreasing the amount of current transfer by chloride ions (Yuan et al. 2009). Third, during the chloride binding a portion of chloride ions can be replaced by the OH ˉ ions. Once OH ˉ ions are released, simultaneous diffusion and migration occurs and therefore OH ˉ ions could either move to the catholyte solution (NaCl solution) side through diffusion mechanism or to the anolyte solution (NaOH solution) side through the migration mechanism (Andrade 1993). The OH ˉ ions movement mechanism depends on the concentration of OH ˉ ions in the pore solution. According to the results in Figure 3-3, it seems that the OH ˉ ions movement mechanism changes into diffusion mechanism during the experiment in specimens with high level of damage, thus reducing the current passed through the specimen.
Figure 3-3: The results of Rapid chloride penetration test (RCPT): (a) transferred current during the RCPT, (b) change in total charge passed.
3.3.3 Electrical resistivity
methods. This is mainly due to reduce contact impedance when RCPT cells are used in measurements (Halaji et al. 2015).
Figure 3-4: (a) Normalized bulk electrical resistivity, to the resistivity of undamaged mortar, of mortar specimens, (b) normalized surface resistivity as a function of damage.