Development, Energy Status, Intestinal Maturation, Gene Expression and Post-hatch Development. (Under the direction of Peter R. Ferket.)
by
JEAN EDUARDO DE OLIVEIRA
A dissertation submitted to the Graduate Faculty of North Carolina State University
in partial fulfillment of the requirements for the Degree
of Doctor of Philosophy
Nutrition
Raleigh, North Carolina 2007
APPROVED BY:
_________________________________ Dr. Christopher Matthew Ashwell (Biotechnology Minor Representative)
_________________________________ Dr. Zehava Uni
_________________________________ Dr. Michael Wineland
________________________________ Dr. Peter R. Ferket
Biography
Acknowledgements
I would like to express my gratitude to Dr. Peter Ferket, the Chairperson of my Advisory Committee, for his guidance, attention, assistance and friendship during the journey that resulted in this dissertation. I would like to thank the other members of my committee, Dr. Chris Ashwell, Dr. Zehava Uni and Dr. Mike Wineland for their review, and critical input of my dissertation.
I also would like to give a very special thanks to our Nutrition Laboratory Manager Annette Israel for assisting me in carrying out the animal experiments, and also to Shelly Nolin and Audrey O’nan, the Animal Genomic Laboratory assistants for their patience during my molecular biology work. Very special thanks to Dr. Shelly Druyan for her friendship, and for sharing with me the pains and glory of working with microarrays. Thanks to Drs Anael and Fernanda Santos for being such great friends and fellow students throughout these years. I must also thank my fellow graduate students and post-docs for sharing this experience with me.
Table of Contents
Page
List of Tables………. ix
List of Figures……… xii
Chapter 1 Introduction and Literature Review……… 1
Poultry Production Overview………. 1
Historic advances in poultry industry………. 1
Poultry industry challenges……… 4
Starting turkey poults………. 5
Hatchery Holding Period……… 7
Egg storage time………. 9
Egg size/breeder age………... 10
Hatch window……… 11
Consequences of selection………. 13
Poultry Embryo Development……… 15
Embryonic use of egg nutrients……….. 15
Egg composition………. 15
Egg structure……….. 16
Embryo development during incubation……….... 17
Turkey poult peculiarities………... 22
Late-term embryo tissue specificities………. 23
Ways to improve Early Development……… 28
Assessing Poult Quality………. 30
Aiding Embryo Nutrition in Ovo………... 33
In ovo feeding concept………... 33
In ovo feeding constraints……….. 38
Effects of in ovo feeding……… 39
Preliminary in ovo feeding research………... 39
Chicken in ovo feeding research……… 42
Turkey in ovo feeding research……….. 44
Important Metabolic Pathways Associated with Perinatal Nutrition……. 46
Glycolysis and gluconeogenesis………. 47
TCA Cycle……….. 49
Glycogenesis and glycogenolysis……… 51
Pentose phosphate pathway……… 54
Fatty Acid synthesis and beta oxidation………. 56
Metabolic pathways interaction………. 58
Hormonal control of poultry embryo metabolism……….. 60
Studying Nutrition Through Gene Expression………... 63
Era post chicken genome……… 63
Methods of measuring gene expression………. 64
Microarray technology and its application in nutritional studies... 68
RNA extraction and quality control………... 69
Array construction……….. 70
Hybridization……….. 72
Scanning………. 72
Data procession and statistical analysis………. 73
Application in nutritional studies………... 78
Chicken arrays……… 80
Dissertation Research Outline………. 83
Preliminary research………... 83
Phase 1: Evaluation of hydrolyzed soy as an IOF solution ingredient……… 85
Phase 2: Determining IOF volume and osmolality constraints….. 87
Phase 3: Late-term turkey embryo gene expression survey……... 87
Phase 4: Effect of in ovo feeding on turkey embryo gene expression – energy metabolism and intestinal development…… 89
Conclusions……… 90
List of References…..……… 91
Chapter 2 Effect of carbohydrates, hydrolyzed soybean protein and methionine fed in ovo on turkey poult hatchability and energy status at hatch………. 105
Abstract……… 105
Introduction………. 106
Material and Methods……… 107
Experiment 1……….. 107
Experiment 2……….. 108
Tissue Sampling and Glycogen Determination……….. 110
Feeding Behavior Test………... 110
Statistical Analysis………. 110
Results and Discussion……….. 111
Experiment 1……….. 111
Experiment 2……….. 113
Conclusions………. 115
References……… 116
Chapter 3 Effect of in ovo feeding saline solutions with or without carbohydrate and protein on turkey poult hatchability, energy status and growth up to 14 days of age……….. 118
Abstract……… 118
Introduction………. 119
Materials and Methods……….. 120
Tissue Sampling and Glycogen Analysis………... 121
Housing and Animal Care……….. 121
Statistical Analysis………. 122
Results……….. 122
Discussion……… 127
Conclusions……… 130
Chapter 4
Effect of in ovo feeding and incubation conditions on energy status and
performance of turkey poults from 25 days of incubation to 14 days of age……. 133
Abstract………. 133
Introduction………. 134
Material and Methods……… 136
Incubation and IOF………. 136
Animal Husbandry………. 137
Tissue Sampling and Glycogen Analysis………... 138
Feeding Behavior Test………... 138
Statistical Analysis………. 139
Results……….. 140
Discussion……… 146
Conclusion………... 148
References……… 149
Chapter 5 Effect of in ovo feeding on glycogen status of perinatal turkeys………... 151
Abstract………. 151
Introduction………. 152
Material and Methods……… 153
Tissue Sampling and Glycogen Analysis………... 154
Housing and Animal Care……….. 155
Statistics Analysis……….. 156
Results……… 156
Discussion………. 165
References………. 171
Chapter 6 Late-term turkey embryo survey of amnion fluid proprieties and its implication to in ovo feeding studies………. 173
Abstract………. 173
Introduction……….. 174
The role of water during incubation of avian eggs………. 175
Amniotic fluid influence on hatch……….. 179
Turkey embryo and amnion survey……….. 182
Material and Methods………. 182
Statistical Analysis………... 184
Results………. 184
Discussion………... 189
Conclusion……….. 195
References………. 196
Chapter 7 Survey of energy metabolism and intestinal development gene expression in late-term turkey embryos using microarrays……….. 199
Abstract………. 199
Introduction……….. 200
Incubation and sampling………. 202
RNA extraction and quality control……… 203
Microarray manufacturing……….. 204
Sample labeling………... 206
Hybridizing and image scanning……….... 206
Array data procession and statistical analysis………. 207
Embryonic growth and glycogen concentration statistical analysis……… 207
Results and Discussion………... 208
Embryonic development and energy status……… 208
Microarrays………. 217
Cluster analysis………... 218
Liver……… 228
Pectoral muscle………... 232
Hatching muscle………. 234
Duodenum………... 236
Conclusion……… 238
References……… 239
Chapter 8 Effects of in ovo feeding on late-term turkey embryo growth, intestinal morphology, poult quality, energy status, and their association to differences in gene expression observed by microarrays……….. 242
Abstract………. 242
Introduction……….. 243
Materials and Methods……….. 246
Incubation and sampling………. 246
RNA extraction and quality control……… 247
Microarray manufacturing……….. 248
Sample labeling………... 251
Hybridization and image scanning………. 251
Data processing, normalization and statistical analysis……….. 252
Differences in gene expression between IOF and control poults... 252
Embryonic growth, glycogen concentration and poults quality statistical analysis………... 252
Results and Discussion……….. 253
Glycogen Concentration………. 254
Poult quality……….... 257
Array results……… 259
Liver……….... 259
Pectoral muscle………... 261
Hatching muscle………. 261
Duodenum……….. 262
Ileum………... 263
Conclusion……… 267
Chapter 9
Conclusions………... 272 Appendices….……… 277
Appendix 1
The effect of various forms of administration of nutritive solutions on
turkey performance………. 278
Appendix 2
The effect of osmolality and protein sources of nutrition solutions
injected in ovo……… 282
Appendix 3
Genes printed on NCSU_JArray_1………. 290 Appendix 4
List of Tables
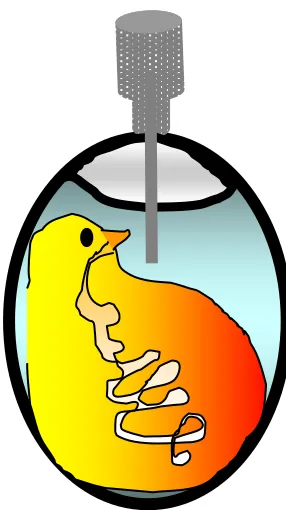
Page Table 1.1. Approximate composition of a 60g chicken egg……… 16 Table 1.2. Approximate composition of a 90g turkey egg……….. 16 Table 1.3. Summary of research papers mentioning in ovo administration of
substances……….. 34
Table 2.1. Effect of IOF treatment on hatchability and mortality rates of turkey
embryos (Experiment 1)……… 112
Table 2.2. Effect of IOF treatment on body weights poults after hatch
(Experiment 1)……….. 112
Table 2.3. Effect of IOF treatment on yolk-free body mass and yolk sac size
relative to total body weight of poults at hatch (Experiment 1)……… 113 Table 2.4. Effect of IOF treatment on liver weights and liver glycogen
concentration of poults at hatch (Experiment 1)………... 113 Table 2.5. Effect of IOF treatment on hatchability and mortality rates of turkey
embryos (Experiment 2)……… 114
Table 2.6. Effect of IOF treatment on body weights poults after hatch
(Experiment 1)……….. 115
Table 2.7. Effect of IOF treatment on yolk-free body mass and yolk sac size
relative to total body weight of poults at hatch (Experiment 1)……… 115 Table 2.8 – Behavioral activity expressed as time spent to consume pre-starter feed by day old turkey poults in-ovo fed with different nutritive solutions…….. 115 Table 3.1 – Effects of in ovo feeding (IOF) and gender on body weight of
turkey poults at hatch (experiments 1 and 2)……… 124 Table 3.2 – Effect of in ovo feeding (IOF) treatment on weights and glycogen
concentration of hatching muscle, breast muscle, and liver in poults at hatch
(Experiments 1 and 2)………... 125
Table 3.3 – In ovo feeding treatment and gender main effects on body weight
of turkey poults at 7d of age (Experiment 1 and 2)………... 125 Table 3.4 – In ovo feeding treatment and gender main effects on body weight
of turkey poults at 14d of age (Experiment 1 and 2)………. 126 Table 3.5 – Main effects of in ovo feeding treatment and gender on weight
gain of turkey poults during1-7d, 7-14d and 1-14d of age (Experiments 1 and
2)………... 126
Table 3.6 – Breast muscle weight at 7 days of age of male and female in ovo
fed (IOF) turkeys of treatment 1………... 127 Table 3.7 – Effects of in ovo feeding and sex on breast muscle weight of
turkey poults at 14d of age on experiment 11, and at 7d and 14d of age in
experiment 2……….. 127
Table 4.1. Incubator temperature profiles in hatcheries 1 and 2……….. 142 Table 4.2. Number of eggs external pipped, hatched poults, and dead embryos
at hatch from turkey poults in ovo fed (IOF) saline or a carbohydrate-protein
Table 4.3. Number of eggs external pipped, hatched poults, and dead embryos from day 25 of incubation (E) to day of hatch, from turkey poults in ovo fed (IOF) saline or a carbohydrate-protein solution (CHP) and non-injected poults
incubated (hatchery 2)……….. 143
Table 4.4. Main effects of IOF treatment and hatchery on hatching muscle size and liver glycogen concentration at 25E………... 144 Table 4.5. Effect of in ovo feeding (IOF) treatment on liver weights of 25E
embryos incubated in two different hatcheries………. 145 Table 4.6. Main effects of IOF treatment and hatchery on hatching muscle
weight and glycogen concentration, and yolk as percent of body weight at
hatch……….. 145
Table 4.7. Effect of IOF treatment on pectoral muscle weight and glycogen
concentration of poults incubated in hatcheries 1 and 2 at day of hatch………... 145 Table 4.8. Main effects of IOF treatment, hatchery, and gender on body weight (BW) and weight gain (WG) from hatch (0d) to 14 days of age (14d)………… 146 Table 4.9. Effect of IOF treatment on the growth performance of male and
female turkey poults from hatch to 14 days of age………... 146
Table 5.1. Effect of in ovo feeding (IOF) treatment on percentage of internal
pipping of eggs sampled at 25 days of incubation……… 158
Table 5.2. Effect of in ovo feeding (IOF) treatment on hatchability of fertile
eggs………... 158
Table 5.3. Effect of in ovo feeding (IOF) treatment on body weight and weight gain of poults at 7 and 14 days post-hatch……… 158
Table 5.4. Effect of gender on body weight and weight gain of turkey poults at 7 and 14 dayspost-hatch……… 159 Table 6.1. Average volume, pH and osmolality of the amniotic fluid from
Hybryd turkey egg from 21 to 24 days of incubation (Uni and Ferket, 2003)…. 181 Table 6.2. Effect of embryonic stage of development of BUT turkeys on
embryo weight, amnion flid volume, and amnion fluid osmolality……….. 186 Table 6.3. Effect of embryonic stage of development of NIC turkeys on
embryo weight, yolk sac weight, and allantoic fluid volume………... 187 Table 6.4. Effect of embryonic stage of development of NIC turkeys on
amniotic fluid volume, amniotic fluid osmolality and embryonic osmolality….. 187 Table 6.5. Effect of embryonic stage of development of HYB turkeys on
embryo weight and amnion fluid volume………. 188 Table 8.1. Genes that were significantly affected1 by in ovo feeding (IOF) in
Table A2.2. Percent hatchability of turkey eggs in ovo fed with different
solutions……… 283
Table A2.3. Percent of turkey poults that piped the egg shell but did not hatch.. 283 Table A2.4. Body weight of day old turkey poults in ovo fed with solutions
with different protein sources………... 284 Table A2.5. Body weight of day old turkey poults in ovo fed with solutions
with different osmolalities……… 284 Table A2.6. Parameter estimates for quadratic regression of day old turkey
poults………. 284
Table A2.7. Body weight of day old turkey poults……….. 286 Table A2.8. Pectoral muscle of day old turkey poults as percent of body mass.. 286 Table A2.9. Yolk present in day old turkey poults as percent of body mass…... 286 Table A2.10. Weight of turkey eggs sampled on different days of incubation… 286 Table A2.11. Alantois of turkey eggs sampled on different days of incubation
as percent of egg weight……… 287
Table A2.12. Turkey embryo mass from eggs sampled on different days of
incubation as percent of egg weight……….. 287 Table A2.13. Extra-embryonic fluid collected from turkey eggs sampled on
different days of incubation as percent of egg weight……….. 287 Table A2.14. Yolk of turkey eggs sampled on different days of incubation as
percent of egg weight……… 287
Table A2.15. Osmolality of the amnion from turkey eggs sampled on different
days of incubation………. 288
Table A2.16. Osmolality of turkey embryos sampled on different days of
incubation……….. 288
Table A2.17. Amnion volume of turkey embryos sampled on different days of
incubation………... 288
Table A3.1. Genes printed on NCSU_JChichen_Array_1………... 290 Table A4.1. Genes printed on NCSU_JSChichen_Array_2………. 293 Table A4.2. Preparation of IOF formulation used in Chapter VIII (Array_2)
List of Figures
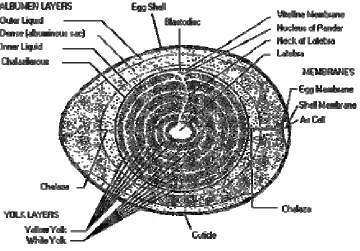
Page Figure 1.1. Structure of the hen’s egg shown by a section through the long axis 17 Figure 1.2. Schematic representation egg compartmentalization during
incubation……….. 19
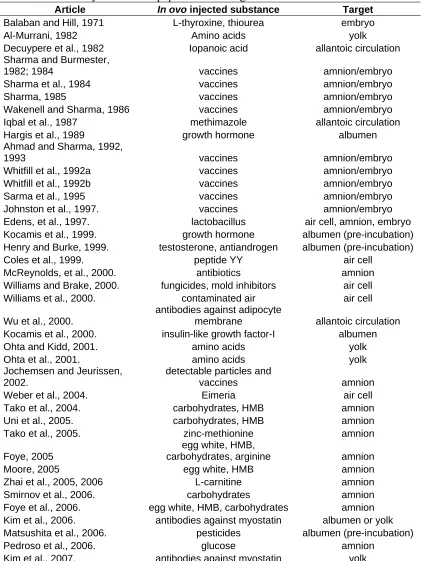
Figure 1.3. Schematic representation on in ovo injection…… ………... 37 Figure 1.4. Glycolysis (red) and gluconeogenesis (blue) pathways and
enzymes………. 48
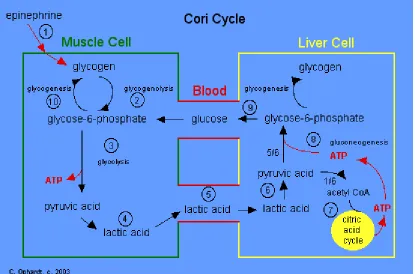
Figure 1.5. The Cori cycle………... 49 Figure 1.6. The TCA cycle showing enzymes, substrates and products………. 51 Figure 1.7. Pathway of glycogen synthesis (glycogenesis)………. 53 Figure 1.8. Glycogenolysis and the fate of glycogen in the liver……… 53 Figure 1.9. Glycogenolysis and the fate of glycogen in muscle………. 54 Figure 1.10. Pentose phosphate pathway intermediaries and enzymes………... 55 Figure 1.11. Malonyl-CoA synthesis from acetyl-CoA and bicarbonate……… 56 Figure 1.12. Formation of the first bond on fatty acid synthesis……… 57 Figure 1.13. Fatty acid elongation pathway……… 57 Figure 1.14. Fatty acid beta oxidation………. 58 Figure 1.15. Graphic representation of metabolic major pathways and how
they relate to each other……… 59 Figure 1.16. Common array experimental designs………. 78 Figure 2.1. Influence of % hydrolyzed soy protein dissolved in 0.4% saline
solution on osmolality (mOsm)………. 109 Figure 4.1. Feed intake of control and in ovo fed (IOF) turkey poults [saline or carbohydrate-protein solution (CHP)] during the first four hours after
placement……….. 144
Figure 5.1. Effect of in ovo feeding treatment at 23 days of incubation on
hatching muscle weight of turkey embryos at 25 days of incubation…………... 159 Figure 5.2. Effect of in ovo feeding treatment at 23 days of incubation on
hatching muscle glycogen concentration of turkey embryos at 25 days of
incubation……….. 160
Figure 5.3. Effect of in ovo feeding treatment at 23 days of incubation on liver glycogen concentration of turkey embryos at 25 days of incubation……… 161 Figure 5.4. Effect o in ovo feeding treatment at 23 days of incubation on body
weight turkey poults at hatch……… 162 Figure 5.5. Effect of in ovo feeding treatment at 23 days of incubation on
hatching muscle glycogen concentration of -fed turkey poults at hatch………... 163 Figure 5.6. Effect of in ovo feeding treatment at 23 days of incubation on liver glycogen concentration of turkey poults at hatch………. 164 Figure 5.7. Effect of in ovo feeding treatment at 23 days of incubation on
pectoral muscle glycogen concentration of turkey poults at hatch………... 165 Figure 6.1. Changes in volume of amniotic fluid of avian species……….. 177 Figure 6.2. Effect of embryonic stage (age) of development of turkeys from
different strains on amnion fluid volume relative to total egg mass (mL
Figure 7.1. Scanned image of a Cy5 sample using the microarray produced in
this study………... 205
Figure 7.2. Turkey embryo growth during the last week of incubation………... 210 Figure 7.3. Turkey embryo yolk sac weight during the last week of incubation 211 Figure 7.4. Turkey embryo tissue development during the last week of
incubation……….. 212
Figure 7.5. Changes in turkey embryo duodenum mass during the last week of
incubation……….. 213
Figure 7.6. Turkey embryo hatching muscle growth during the last week of
incubation……….. 214
Figure 7.7. Turkey embryo liver glycogen concentration during the last week
of incubation………. 215
Figure 7.8. Turkey embryo pectoral muscle glycogen concentration during the
last week of incubation………. 216
Figure 7.9. Turkey embryo hatching muscle glycogen concentration during the
last week of incubation………. 217
Figure 7.10. Clustering of genes significantly affected by time in embryonic
liver………... 220
Figure 7.11. Parallel plots of cluster analysis for turkey embryo liver………… 221 Figure 7.12. Clustering of genes significantly affected by time in embryonic
pectoral muscle………. 222
Figure 7.13. Parallel plots of cluster analysis for turkey embryo pectoral
muscle………... 223
Figure 7.14. Clustering of genes significantly affected by time in embryonic
hatching muscle……… 224
Figure 7.15. Parallel plots of cluster analysis fro turkey embryo hatching
muscle………... 225
Figure 7.16. Clustering of genes significantly affected by time in embryonic
duodenum……….. 226
Figure 7.17. Parallel plot of cluster analysis for turkey embryo duodenum…… 227 Figure 8.1. Scanned image of the “NCSU_JSARRAY_2” Focused Chicken
Microarray slide stained with Syto 61 fluorescent dye………. 250 Figure 8.2. Embryonic development of turkey embryos from 22E until hatch
expressed as yolk-free body weight (g)……… 254 Figure 8.3. Liver glycogen concentration (mg/g) of turkey embryos from 20E
until hatch……….. 256
Figure 8.4. Pectoral muscle glycogen concentration (mg/g) of turkey embryos
from 20E until hatch………. 257
Figure 8.5. Poult quality scores of in ovo fed and control turkey poults at hatch 258 Figure 8.6. Leg shanks relative asymmetry of control and in ovo fed turkey
poults at hatch………... 259
Figure 8.7. Volcano plots showing difference in gene expression between
control (NC) and in ovo fed (IOF) turkey embryos……….. 265 Figure 9.1. Comparison between precocial versus altricial birds at hatch……... 274 Figure 9.2. Summary of embryonic development stages emphasizing energy
Figure A2.1. Regression analysis of body weight by osmolality of in ovo
Chapter 1
Introduction and Literature Review
Poultry Production Overview
Historic advances in poultry industry
Poultry meat and eggs are high-quality protein, and during the last 50 years they
have become among the most affordable food staple for people throughout the world. As
technological development advanced during the twentieth century, the world’s population
became more urbanized (Lobo, 2006) and dependent upon concentrated large-scale food
production that can be easily and efficiently transported to metropolitan areas. The
poultry industry led this transformation from subsistence agriculture to integrated
production to feed this growing urbanized society, elevating the consumption of poultry
products ahead of other animal products as the least expensive and most popular animal
protein source (Hammerstedt, 1999).
Modern chickens were domesticated from the Red Jungle Fowl (Gallus gallus) over the last four or five thousand years for eggs and meat, for game and for exhibition
(Winter and Funk, 1960; Roberts, 1998; Klasing, 2005). Chickens were imported to the
new world from Europe and Asia during the 1800’s, where they were raised for eggs and
meat in the backyards of most homes. Indeed, the most profitable part of the poultry
business until the early 1920’s was for competitive exhibitions rather than for food
(Winter and Funk, 1960; Hanke et al., 1972). But then the profit on poultry production
(Winter and Funk, 1960; Hanke et al., 1972). Emphasis on poultry meat and egg
production accelerated after Herbert Hoover’s 1928 presidential campaign promise of “A
chicken in every pot…and a car in every garage.” The outcome was so successful that
since 1992 poultry meat has been the most-consumed meat in the US, surpassing beef
and pork, based in the retail weight series (Smith, 2006b).
Modern turkeys are native to North America and were domesticated from
Meleagris gallopavo by the Aztec Indians in what is now Mexico as far back as AD1000 (Roberts, 2002, Klasing, 2005). Early European explorers brought turkeys back to their
noble underwriters who further selected them for show and feasts. Commercial rearing
became important in early 19th century, after domesticated turkeys were brought back
from Europe and backcrossed with wild turkeys (Hanke et al., 1972; Roberts, 2002;
Klasing, 2005).
The growth of the poultry industry during the last 7 decades has been
phenomenal. In 1939, 660.5 million chickens and 27.9 million turkeys were raised in the
United States (Winter and Funk, 1960). In 2006, 10.9 billion broiler chickens (20 billion
kg) and 261.9 million turkeys (3.3 billion kg) were produced (USDA National
Agriculture Statistics Service, 2007). The average consumption of chicken in the US
today is 36.3 kg per capita (Lefens, 2007), and per capita consumption of turkey is
growing faster then chicken during the last five years (Smith, 2007a). Worldwide 67.6
billion kg of chicken meat is produced every year (van der Sluis, 2005), and the biggest
poultry meat exporter is Brazil with 2.85 million metric tons in 2006, followed by the US
the USA and throughout the world, any small percentage change in poultry production
has an economic impact worth millions of dollars to the poultry and associated industries.
There are several reasons for the success of the poultry industry and the
phenomenal growth in consumer demand for its products, including rapid application of
scientific discoveries, specialization into integrated production systems, and free
acceptance in world market.
Since its’ beginning, the poultry industry has being strongly dependent on
research (Smith, 2006b). Large scale production was only possible after the discovery of
vitamins, improvement of artificial incubation, introduction of disease test kits,
vaccination, and breeder genetic selection application (Winter and Funk, 1960; Hanke et
al., 1972; Morris, 1980). This continuous industry progress is based on the application of
scientifically-proven technologies that help poultry growers improve production yield,
bird health and nutrition, housing, genetics and reproduction, food quality, safety, and
efficiency (Smith, 2006b). The best example of dramatic advances can be seen in animal
performance, especially improvements in body weights at market. A typical 1957 chicken
strain reached 539 g of body weight at 42 days of age, while a 2001 commercial broiler
chicken strain reached 2,672 g at the same 42 days of age, which constitutes remarkable
progress (Havenstein et al., 2003). The production characteristics of turkeys have also
improved significantly during the last 4 decades. Modern 2003 strains were observed to
weigh approximately twice the weight of the 1966 turkey strain from 112 to 196 days of
age (Havenstein et al., 2007). This improvement in growth performance and meat yield
was driven by costumer preference for white breast meat products, and the industry’s
broilers slaughtered in the US reached a record high of 2.54 kg in 2006 (Smith, 2006a).
Today, most of the broiler and turkey carcasses are deboned and further processed and
the amount of poultry meat produced are sustained by heavier birds, even when the
number of birds decreases (Smith, 2006a). Such accomplishment could only be reached
by constant research and innovation to overcome challenges, and there is still more room
for improvement.
Another reason why the poultry industry has grown so much is attributed to
having a refined and specialized segmentation. A few breeding companies provide elite
genetic stock, while production companies grow out hybrid crosses to produce the final
product (Hammerstedt, 1999). The grower receives a technology package and mainly
concentrates on managing the birds, while genetic companies concentrate in producing a
more efficient bird every generation.
Finally, the phenomenal growth of the poultry industry would not have occurred
if not for few social and trade barriers. There are no barriers against poultry meat, like
religious or cultural impediments that exist to other meats. This allied to attractive prices,
led exports to boom world wide, providing to the industry an even greater incentive for
growth. In conclusion, poultry is the perfect animal product to feed a globalized world.
Poultry Industry challenges
The challenges that the poultry industry faces are the opportunities for research
and development. According to Smith, (2006b), the poultry industry must commit and
coordinate with research to remain as the leading food animal sector. A global
commitment to solving the poultry industry challenges is necessary because multinational
poultry products. The main issues forecasted by specialists are disease pandemic, feed
stuff contamination, environmental impact, shortage of carbohydrate sources, metabolic
diseases, and increasing production costs (Shelton, 2006; Smith, 2006b).
To reduce production costs, it is important to improve early growth performance
characteristics in poultry. As demands for decreasing market weight for age continue, it
will become more important to improve growth and development during the brooding
phase (Hulet, 2007). This is especially important to the turkey industry, where fertile eggs
and day old poults cost more than they do in the chicken industry (Schaal and Cherian,
2007). Genetic selection has created a more efficient bird, driving costs down
(Hammerstedt, 1999), but that would negated if poults do not survive the first week of
life. Therefore, early survival of is a major concern for high-yield poultry strains,
particularly to the turkey industry.
Starting turkey poults
Turkey industry’s main challenges are to improve poult yield and quality from
hatcheries, reduce mortality and stunted growth during brooding, and have a more
uniform bird at market age independent of the season. Management-related problems
during brooding and growing account for over 6% of flock mortality, and for 10 to 30%
depression in growth relative to the genetic potential. Weak poults suffer from metabolic
disorders related to the transition from egg to the precocial poult (Noble et al., 1999;
Christensen et al., 2003c; Christensen et al., 2007).
Hammerstedt, (1999) pointed out that production effectiveness starts with
reproduction, including hatchability and post hatch survival. Because market weight for
the incubation period has increased to represent 30 to 40% of the productive life of meat
poultry (Hulet, 2007). Therefore, the incubation and brooding periods has gained more
relative importance to a successful rearing of meat poultry than ever before, and this
trend is expected to continue as increases in post-hatch growth rate are achieved.
Early mortality and stunted growth is not only costly to the turkey industry, but it
negatively impacts animal welfare concerns. Two common conditions have been reported
as responsible for these losses, starve-outs and flip-over poults. Poults that do not develop
and eventually die during the first 5 days post-hatch are commonly called “starve-outs”
(Christensen et al., 2003c). ”Starve-out” poults typically have exhausted their
carbohydrate reserves, which adversely affects their ability to thermoregulate and use
their yolk reserves (Donaldson, 1995). This inability to utilize yolk reserves to support
tissue growth and development consequently increases the incidence of unabsorbed yolk
sacs observed at carcass processing of surviving birds (Buhr et al., 2006). Thus, high
mortality is usually seen 5-7 days post hatch, and the ones that survive never recover
(Horrox, 2003), causing increased size variation at slaughter that adversely affects the
uniformity of meat cuts (Horrox, 2006b).
Poor poult quality at hatch can also be exhibited by an increased incidence of
poults that flip on their back, paddle their feet, and cannot get back on their feet without
assistance. If these “flip-over” poults are put back on their feet, they cannot regain
balance, they are weak, and they vocalize loudly, indicating loss of neurological control,
distress, and lethargy (Noble et al., 1999). The same authors reported high mortality rates
among flip-overs (37.8% of the flock) during the 2 days post-hatch. Christensen et al.,
concentration of thyroid hormones than normal poults. Moreover, the incidence of
flip-overs poults is higher among poults that have delayed hatch from small eggs (Noble et
al., 1999).
Christensen et al., (2007) proposed a solution to avoid starve-outs, flip-overs and
improve early development and uniformity in turkey poults by feeding them readily
available carbohydrates as soon as possible after hatching. Early access to feed, as it will
be discussed later, improves post-hatch survival and growth (Uni and Ferket, 2004) by
improving gut development, digestion and absorption capacity, thereby overcoming some
of the challenges faced by the neonatal poult during the first week post hatch. For the
neonatal poult to initiate feeding and early growth, an appetite and a functional digestive
system is necessary (Christensen et al., 2007).
Hatchery Holding Period
It is common practice in the poultry industry to hold poults without feed and
water for many hours after hatch. Poults may remain for up to 36 hours after hatching
before they are pulled from the hatching cabinet, and then it may take an additional 72
hours before they are be serviced and transported to brooder farms where they finally
have access to feed and water. Poult servicing includes sexing, toe trimming, snood
removal, beak trimming, and injection of antibiotics (Donaldson and Christensen, 1991,
Donaldson et al., 1991). After enduring this stress of servicing poults are often held in
transportation boxes stacked in a dim room for up to 24 hours so they can recover and
endure the stress of transport and placement. Donaldson et al., (1991) confirmed that
poults recuperate liver glycogen concentration to levels prior to servicing when held for
own protein reserves (Donaldson, 1995; Keirs et al., 2002) since they have no access to
feed or water during this time.
Several studies were performed to evaluate the impact of this early fasting period
on poult development, comparing hatchlings that were held for 24 hours with those given
ad libitum access to feed and water immediately after they were removed from the hatcher. Careghi et al., (2005) observed that broiler chicks fed immediately after hatch
showed higher weight gain later in life as compared to the held chicks, and that late
hatchers benefit more from early access to feed. Uni et al., (1998) demonstrated that early
fasting clearly delays gut maturation, affecting the development of mucosal morphology
and intestinal enzyme activity. Fed poults and chicks also have more goblet cells per
villus, and more proliferating enterocytes, in contrast to more apoptotic cells in fasted
birds (Uni et al., 1998; Potturi et al., 2005; Smirnov et al., 2006). According to (Potturi et
al., 2005), poults fed immediately after hatch had 5.0µm longer and 6.8µm wider
intestinal villi, and 5.6µm deeper villi crypts than fasted-held poults. These fasted poults
also had more aerobic bacteria in their small intestine (Potturi et al., 2005). Feed
restriction early in life also programmed birds for obesity later in life (Zhan et al., 2007)
by permanently altering energy related enzyme production and function. Velleman and
Mozdziak, (2005) found reduced muscle growth among chicks that experienced a 72 hour
of fasting after hatch. Because of the literature sited above, there is great interest in ways
to aid poult nutrition before placement, as Careghi et al., (2005) suggested to provide an
There are several other management practices and conditions that can accentuate
the adverse effects of a long post-hatch holding period, including egg storage period, egg
size, and hatch window.
Egg storage time
The adverse effects of post-hatch holding time on poult vigor can be accentuated
by long pre-incubation egg storing time. Careghi et al., (2005) reported that extended egg
storage time (over 7 days) and hatchery holding time negatively affect poult early growth.
Eggs stored for over a week causes increased number of embryonic abnormalities,
mortality, slower embryonic metabolism, and delays or prolongs the internal pipping
stage (Decuypere and Bruggeman, 2007).
By the time of oviposition, the chicken embryo has already developed inside the
hen for 18 to 21 hours, having about 40,000 to 60,000 cells (Fasenko, 2007). Turkey
embryos are at less mature stages of development than chickens at time of lay (Gupta and
Bakst, 1993, Fasenko, 2007). Fertile eggs will continue development if adequate
incubation conditions are provided. Edwards determined that chicken embryos do not
develop but still survive if stored at 21oC (Edwards, 1902). The temperature below which
embryonic development does not occur is termed physiological zero, but the preferred
term is embryonic diapause (Fasenko, 2007). Bakst and Gupta, (1997) found that the
turkey embryo physiological zero is lower than chickens, at 15oC. Even though the
embryo is not growing during storage, the young embryo, who depends on glucose to
survive, is still consuming the limited amount of available glucose. Embryos from eggs
stored for 14 days are not behind in development, but their metabolism is slower
hormones, and reduced efficiency in maintaining glycogen reserves in muscle and heart
(Christensen et al., 2001b; Fasenko, 2007). As a consequence, the energy stores of such
embryos are smaller, contributing to even lower energy status at hatch. Mather and
Laughlin, (1977) observed that embryos from eggs stored for more than seven days may
take up to 12 hours to resume development when set at the incubator. This observation
was later confirmed with turkeys by Fasenko, (2007).
Egg size/breeder age
Breeder hen age and egg size are two other factors that can aggravate holding
time. These two factors are often associated since older hens lay bigger eggs (Decuypere
and Bruggeman, 2007). The first egg laid of each clutch is also bigger than subsequent
eggs (Zakaria et al., 2005). Embryos from hens at the end of the lay cycle hatch earlier,
and thus, these hatchlings stay longer in the incubator, depleting their energy stores
(Joseph and Moran, 2005b). Eggs from older hens also have higher egg conductance due
to larger eggshell pores, losing more weight during incubation, and stimulating embryos
to hatch earlier (Christensen et al., 1996; Funderbunk et al., 2005). Eggs that loose weight
at an accelerated rate during incubation yield embryos and hatchlings that are more
dependent on gluconeogenesis and are more adversely affected by nutrient deprivation
and poor brooding conditions (Peebles et al., 2005).
As the embryo growths tissues demanding oxygen are formed, but oxygen supply
is fixed. At a certain point a plateau in oxygen consumption is reached. This plateau stage
is essential for maturation of several processes in embryo development. Christensen et
al., (1996) showed that because eggs from older hens have higher shell conductance their
grow muscle more efficiently. Because muscle requires more oxygen, embryos from
older hens have less liver glycogen available for hatching and post-hatch survival.
Breeder hen age also affect circulating thyroid hormone levels of embryos, T4, which
stimulates growth, was higher in embryos from older hen, whereas T3, which promotes
glycogen metabolism, was higher in embryos from younger hens. This hen age effect on
thyroid function in embryos may be a direct consequence of the nutrients available in the
egg. The hen deposits more yolk at expense of egg white as she ages. Because yolk lipids
supply energy for growth and carbohydrate plays a major role at hatching, a hatching egg
with more yolk and less albumen yields heavier poults that do not always survive the
rigors of hatching until feed intake initiates (Christensen et al., 1996). Consequently,
hatchability declines as hens get older (Nestor et al., 1972). Research is needed to
alleviate the adverse effect of age and egg size by helping these troubled embryos to
accumulate and utilize glycogen to fuel hatch.
Hatch window
Hatch window is defined as the time it takes from the first embryo hatched to the
time the hatch is pulled. A broad hatch window may exceed a duration of 36 to 48 hours,
which further delays the access to feed in addition to the 24 hours or more required for
poult servicing, holding, and transport to the brooder farm (Careghi et al., 2005). The
optimum time to pull the poults from the hatcher is often difficult to determine among
hatches with a wide hatch window because embryos do not hatch all at the same time. If
the poults are pulled from the hatcher too soon, many late-hatched poults are
unnecessarily disposed; but if the poults are pulled too late, many early-hatched poults
and final weight (Bamelis et al., 2005; Careghi et al., 2005). In contrast, determining the
optimum hatch pull time is much easier for hatching with a narrow hatch window, and
there are fewer poult quality problems (Careghi et al., 2005; Joseph and Moran, 2005b).
Depending on incubation conditions the hatch window of time can be 24 to 36 hours, or
more.
Hatch window duration may be affected by several factors, including breeder age,
incubation temperature, egg storage time, and location in the incubator Wyatt, et al.,
(1985) reported that broiler chicks from older hens began hatching 6 hours sooner than
chicks from younger flocks. In a similar experiment, Joseph and Moran, (2005b) reported
that early hatches stayed in the hatcher up to 32 hours post-emergence, while late hatches
were held up to 6 hours. Eggs incubated in higher temperatures hatch earlier (Christensen
et al., 2001a; Christensen et al., 2003a; Christensen et al., 2003b; Hulet et al., 2007).
Position in the incubator affects egg temperature because of differences in air flow. Egg
shell temperature may be higher than incubator temperature, especially after mid
incubation when the embryo is producing heat, thus subjecting the embryos to heat stress
(Hulet et al., 2007). We have already discussed the effects of egg storage time on length
of incubation, an extended hatch window is expected if eggs are stored for different
amounts of time and then are set together.
In summary, there are many factors that may delay the initiation of feeding, and it
is a challenge to manage all these factors to reduce their impact on hatchability, viability
and performance. New technologies are welcome and necessary to address these
problems, but their implementation will not be easy. Some hatchery management experts
delay to feed intake initiation. The eggs are transferred to special units were they hatch
with feed and water available, and where they stay for a couple of days before being
shipped out. This results in chicks and poults equivalently one day ahead in development
compared to standard industry practice (Horrox, 2006a), but this new hatchery
technology would require heavy investments in new equipment by hatcheries.
Consequences of Selection
Great advances in poultry breeding and genetic selection for valuable production
traits have been achieved during the last 50 years. Many have predicted that the genetic
limit for growth was reached and slower progress will be seen from then on (Shelton,
2006), but we still see advances every year. The formula for success depends on two
main branches of research, genetics and nutrition. The first creates a bird with higher
potential, and the second has to find a way to help that bird to achieve as much of that
potential as possible.
Constant selection for performance, especially heavier weights, has its
consequences. One big setback is that selection for higher post-hatch growth is negatively
correlated with embryo survival (Nestor and Noble, 1995; Christensen et al., 2000).
Collin et al., (2007) pointed out that selection for breast meat yield leads to poor visceral
system. This phenomenon was explained by Foye (2005), who said that selection for
growth is pushing precocial poultry to become more altricial by directing resources to
growth stead of viscera maturation.
One of the consequences of the reduction of visceral capacity relative to body size
among modern broilers selected for rapid growth is exemplified by the increasing
animal to attend body demands. One of the strategies to reduce the incidence of ascites is
to slow down early growth by feed restriction; but if it is too severe, the restriction may
not be compensated later in life, resulting in lower weights and yields at processing
(Ozkan et al., 2006). Selection for weight gain also increases risk of obesity, lower
fertility, and lower hatchability (Joseph and Moran, 2005a).
The value of poultry industry has increased tremendously in the last twenty years.
The broiler industry has grown from $5.68 billion in 1985 to $20.9 billion in 2005.
Turkey production has grown 77% during the same period. Associated with this increase
in meat poultry production was annual increase in broiler and turkey eggs set in
hatcheries of 98% and 33%, respectively. Although considerable progress was been made
in the performance characteristics of breeders and commercial poultry, hatchability rate
has improvement little during the last twenty years. Indeed, 20% of chicken and turkey
hatching eggs do not yield hatchlings, and the combined monetary losses of low
hatchability represented $500 million to the industry in 2005. Each 1% increase in
hatchability would result in $25 million in return, so finding ways to improve hatchability
and early survival have a significant economic impact (Schaal and Cherian, 2007).
According to Keirs et al., (2007), only a small portion of non-hatched embryos have
anatomical abnormalities, so the majority of them should have hatched and survived.
Most of the knowledge on embryonic development is based on research conducted over
60 years ago. It is now apparent that more emphasis on optimizing the growth and
maturity of the developing embryo is needed to maximize post-hatch growth and
Poultry Embryo Development
Embryonic use of egg nutrients
Egg composition
Embryo development apart from the hen allows poultry producers to handle large
number of animals, but on the down side all nutrients must be present in the egg to
sustain embryonic development by the time the egg is laid (Fasenko, 2007). Composition
of a typical chicken egg is presented on Table 1.1. There is much less information
available on the composition of turkey egg, mostly because they are only produced for
the purpose of turkey reproduction rather than as a human food source. An 80g turkey
egg comprises of about 30% yolk and 55-60% albumen (Applegate and Lilburn, 1998).
Reidy et al., (1994) determined egg composition from two of the three major turkey
breeds, and the average composition values among breeds over different hen ages are
presented in Table 1.2. Although the relative composition of eggs from chickens and
turkeys are similar, turkey eggs have higher total nutrients because of their larger size.
These egg nutrients will be all that is available to nurture the developing embryo.
However, it is noteworthy that there is very little energy reserves as carbohydrates in the
egg (Romanoff, 1967), being most of lipids in the yolk fraction. Ninety eight percent of
the free carbohydrates are present as 0.5% glucose in the albumen (Davis and Reeves,
Table 1.1. Approximate composition of a 60g chicken egg Egg
weight
Water Protein Lipids Carbohydrate Minerals
% % % on dry matter basis
Egg yolk 31 51 30 60 1.2 2.2
Egg white 58 88 75 0.08 4.2 1.7
Egg shell 11 0.3 0.7 - - 98
Total 100
Adapted from: Davis and Reeves (2002)
Table 1.2. Approximate composition of a 90g turkey egg
Egg weight Water Protein Lipids
% % % on dry matter basis
Egg yolk 30.1 46.3 28.6 59.5
Albumen 59.2 88.7 78.3 -
Egg shell 10.7 - - -
Total 100 - - -
Adapted from: Reidy et al. (1994).
Egg structure
A schematic structure of the avian egg before incubation is illustrated by Figure
1.1. These structures simply keep the little embryo alive and protected until incubation
starts.
Beginning with the outside of the egg moving inward, the egg shell has a porous
calcium carbonate structure that allows gas exchange and two membranes. The outer
membrane is attached to the shell, while the inner membrane retracts when egg cools
down forming the air cell space on the large end of the egg. The next component is the
egg white, composed of three layers of protein generally called albumen. The albumen
layers are named based on their density as outer thin, dense or thick and inner thin. The
membrane. Resting on top of the yolk is the blastodisc where the embryo resides after the
egg is fertilized. Concentric yolk layers can be differentiated by the amount of pigment
deposited depending whether they were formed during daylight or night darkness.
Linking the yolk to each end of the egg are the chalazas that act like bungee cords to keep
the yolk horizontally centered in the egg. These rudimentary structures are present at the
time of lay but they rapidly change once incubation proceeds.
From http://www.msstate.edu/dept/poultry/avianemb.htm#stages (Smith, 2007b)
Embryo development during Incubation
Moran, (2007) presented a comprehensive review on the development of the avian
establishment of the germ; 2) completion of embryonic formation; and 3) preparation for
emergence.
During the establishment of the germ, the embryo and its sustaining structures
resume cell proliferation from the 40,000 to 60,000 cells already present at oviposition
(Fasenko, 2007). The energy expended at this time arises by glycolysis of glucose present
at the outer thin layer of the albumen. The embryo metabolism is mainly anaerobic,
accumulating lactate because of low O2 diffusion of the primitive hemoglobin. The
vascular system is rapidly established and germ invaginations lead to formation of the
chorionic sac and the allantoic cavity. The different egg compartments during incubation
are illustrated by Figure 1.2. Egg turning is crucial during this period to allow proper
formation of egg compartments and to give embryonic access to glucose present in the
outer thin. The inner cell layer of the amniotic membrane secretes amniotic fluid in which
the embryo floats, keeping the embryo from drying and protecting it from shock. The
chorion surrounds all embryonic structures and serves as a protective membrane. The
allantois grows larger as the embryo grows, until it fuses with the chorion forming the
chorio-allantoic membrane, responsible for exchanging oxygen and carbon dioxide with
the environment, and for storing nitrogenous waste (Smith, 2007b). The yolk sac
membrane selects the nutrients being up taken from yolk sac reserves, which includes
lipids, protein, minerals and vitamins. The yolk sac membrane can also modify these
nutrients and serve as their short-term storage. Egg storage and storage conditions prior to
incubation can impair formation of a fully functional choriallantois, affecting recovery of
Figure 1.2. Schematic representation egg compartmentalization during incubation. From: http://www.biology.eku.edu/RITCHISO/avianreproduction.html (Ritchison, 2007)
The second third of incubation is marked by a fully developed vascular system,
with the choriallantois able to assure O2-CO2 exchange. The embryo then undergoes the
first drastic switch of its metabolism, from carbohydrate to fully dependent on lipid
oxidation as the energy source. The embryo grows very fast in size during this phase.
Essential fatty acids are preserved for cell membrane synthesis while saturated fatty acids
are consumed to sustain the increasing caloric needs of formed tissues. Turkey embryos
are structurally complete by 24 days of incubation, when choriallantoic respiration
capacity is reached in the previously mentioned plateau stage (Christensen et al., 1996).
The embryo then undergoes another critical period: the transition for emergence.
In preparation for emergence, embryonic size and movements cause rupture of the
membrane that separated the albumen and amniotic fluid, causing them to mix. The
embryo then orally consumes the amniotic fluid, which passes through the
duodenum and jejunum are able to absorb macromolecules of protein, in a process similar
to mammalian absorption of colostrums. Such consumption continues until the
albumen-amniotic fluid disappears and internal pipping begins. Since embryonic skeletal tissue
development is complete at this point, the nutrients absorbed are used for visceral organs
maturation and most of it is stored as glycogen. The main protein present in the fluid is
called ovomucoid, which has extensive amounts of carbohydrate. Gluconeogenesis from
albumen proteins is channeled to form glycogen, while the amino acids are spared for
protein synthesis. Glycogen is deposited in liver and muscle. Some residual
albumen-allantoic fluid ingested enters the yolk and continues to express digestive enzymes
obtained while passing through gastrointestinal systems. Digestion of nutrients then can
occur in the yolk and be absorbed by yolk sac cell villi, especially VLDL, which
accumulates triglycerides in sub-dermal locations of the embryo. Cholesterol accumulates
in the liver, causing it to grow in size and become yellow in appearance. At the same time
HDL aggregates in granules and are covered with calcium from circulation. These
granules remain in the yolk sac until pipping. Dissolution of mammary knobs adjacent to
the choriallantois-shell membrane interface mobilizes great amounts of calcium, which
rises in the circulation favoring calcification of the skeleton, which was mainly cartilage
until then. Now the embryo is ready to start pipping the weakened shell and membranes
(Moran, 2007).
Emergence starts when the embryo breaks the choriallantois and the inner shell
membrane near the air cell, in what is called internal pipping. At this point the embryo
must initiate pulmonary respiration, since the outer shell membrane is loosing contact
continuing use of lipids as energy, so metabolism switches again to the anaerobic
catabolism of glucose from glycogen reserves producing lactate. The remaining yolk sac
is retracted into the abdominal cavity, and peripheral blood is recovered into the embryo.
A relatively great amount of energy is used to sustain embryonic pipping movements to
break the shell, and body rotation. Shell piercing is achieved by the coordination of
pipping muscle movements and the egg tooth of the beak. The pipping or hatching
muscle is a specialized muscle located in the back of the head. Hatching muscle fibers
are exclusively anaerobic and relay on glycogen stored there previously. It also has a
special nervous system to coordinate its movements. External air access now provides
enough oxygen for oxidation of fatty acids and lactate recovery in the liver. At this point
the choriallantois can not longer extract calcium from the shell, so calcium mobilization
begins from HDL granules. The embryo continues breaking the shell, rotating and using
the feet to push until it is free from the shell (Moran, 2007). The blood vessels linking the
navel to the shell membrane are detached, and the hatching process is over.
Although yolk sac lipoproteins continue to be an important nutrient source at this
time, fatty acid recovery from preformed body depots appears to dominate. Extensive
hepatic cholesterol in place at hatch rapidly dissipates along with the depots. Cholesterol,
together with depot essential fatty acids, enables continued membrane formation and
growth. A high concurrent demand for glucose appears to reside with its need to support
growth of glycolytic muscle. In the intestine, cell proliferation is stimulated by feed
intake to replace embryonic enterocytes, able to absorb macromolecules, by mature ones,
transition may take up to two weeks post-hatch, and is delayed if feeding is delayed
(Moran, 2007).
Turkey poult peculiarities
Genetic advances are forcing commercial poultry towards altricial development,
as was pointed out by Foye, (2005). Early nutrition and incubation have become key
factors for successful poultry production and it offers the greatest opportunity for
improvement (Hulet, 2007). The development of body functions starts early during the
embryonic phase in precocial birds, especially poultry. This early and very sensitive
developmental phase is of high significance for the adaptability of the organism later in
life (Tzschentke, 2007).
The turkey is more prone to perinatal problems than chickens because of it has a
thicker egg shell (lower conductance), longer incubation period (28 versus 21 days), and
longer hatching window (exacerbated by longer storage since less eggs are available).
These disadvantages often increases the incidence of weak poults by the time of
placement, resulting in 2-5% mortality during brooding phase (Carver et al., 2000;
Christensen et al., 2003c; Uni and Ferket, 2004). Bakst et al., (1997) described that we
can not use the same staging procedure for chickens and turkeys because there are several
differences between their developments. Chicken morphogenetic development is more
advanced by the time of oviposition (Gupta and Bakst, 1993; Bakst et al., 1997), but
more research is necessary to confirm if this is related to higher hatchery losses among
turkeys compared to chickens.
It has been well documented that weaker poults are associated with depleted
Donaldson et al., 1991; Donaldson, 1995; Christensen et al.; 2001b, Christensen et al.,
2003c), and recovering glycogen reserves is done at the expense of muscle degradation
by gluconeogenesis (Keirs et al., 2002). These poults may be too weak to eat and drink
thus initial losses may never be compensated.
Late-term embryo tissue specificities
To study turkey embryo and poult nutrition and metabolism, it is important to
identify which are the most metabolic active tissues: liver, pectoral muscle, hatching
muscle, and intestines. The following is a brief explanation why these tissues are
metabolically important for the perinatal turkey.
As in all animals, the liver is the most metabolically active tissue in the body of
turkey embryos. It is the only organ in which all metabolic pathways and metabolic
enzymes are active; some of them are present exclusively in the liver. Blood coming from
vitelline circulation, digestive tract or peripheral tissues pass though the liver. In the liver
nutrients absorbed can be stored, modified or exported to other parts of the body, while
waste components from other tissues can be metabolized for excretion, or recycled back
into useful metabolites. Major energy metabolic pathways like glycolysis,
gluconeogenesis, tricarboxylic acid cycle (TCA), pentose phosphate, glycogenesis and
glycogenolysis are most active in the liver, due to its role in controlling energy
homeostasis. Extensive lipid metabolism also occurs in the liver, like exporting stored
and de novo synthesized cholesterol, triacylglycerol and phospholipids packaged or repackaged as low-density lipoproteins (LDL), very low density lipoproteins (VLDL) and
high-density lipoproteins (HDL). To keep energy homeostasis, hepatic cells are under
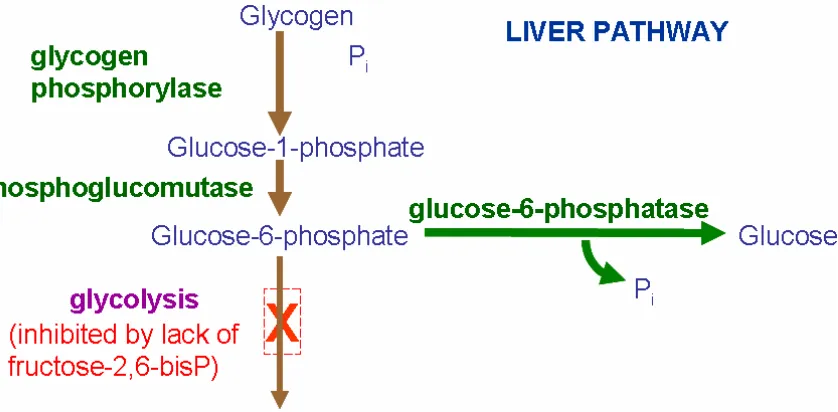
thyroid hormones. In poultry embryos, the liver is especially important to produce
glucose through gluconeogenesis. The major gluconeogenic organ in animals is the liver,
with small contributions from the kidney cortex (Matthews and Holde, 1990a). This is
crucial because from when internal pipping begins until the poult is fed, gluconeogenesis
is the only source of glucose production for the embryo and poult (Donaldson, 1995), and
only the liver has glucose-6-phosphatase, the enzyme needed to export glucose
(Matthews and Holde, 1990a). This is in contrast to what happens in mammals, which
have a constant supply of maternal glucose (Pearce and Brown, 1971). For example,
gluconeogenesis and glycogenesis rapidly develop in rats only after birth (Pearce and
Brown, 1971). Some cells of the brain, blood, heart, and muscle depend exclusively on
glucose as their energy substrate under anaerobic conditions (like hatching) (Krebs,
1972). Gluconeogenesis from amino acids also require deamination and the liver plays a
key role in metabolizing nitrogen to be transported in a less toxic form to the kidney
where it can be excreted (Matthews and Holde, 1990b), or to the allantois in the case of
the embryo. Because of its increased role in late-term embryo metabolism, the liver
shows extensive growth during the last phase of incubation, growing proportionally faster
than the rest of the embryo (Romanoff, 1967). The avian’s liver has an even greater
importance in carbohydrate metabolism because their hearts lack the enzymes of the Cori
cycle, so lactate produced during increased glycolysis can only be recycled by hepatic
tissue (Pearce and Brown, 1971; Christensen et al., 2003c).
The breast muscle (Pectoralis major) of the avian embryo is metabolically important mainly because of its relatively large size. Even though the pectoral muscle
glycogen stored in the body (Foye et al., 2006). Therefore, it is important to study the
pectoral muscle when tracking the destiny of circulating glucose during late incubation.
The pectoral muscle is also the tissue of highest economic value (Smith, 2006a). Genetic
selection of turkeys for increased breast meat yields may have contributed to some of the
metabolic challenges the poults are experiencing nowadays. Larger breasts retaining
constant concentration of glycogen may reduce glucose available for liver storage. Since
genetic selection keeps increasing pectoral muscle size, this trend is not going to stop.
New technologies opened the door to even greater emphasis in breast meat. Geneticists
may include some selected key genes into selection strategy to improve pectoral muscle
(Velleman, 2007). The pectoral muscle is also the possible source of protein mobilized to
supply amino acids for gluconeogenesis if energy reserves are depleted after hatch
(Donaldson, 1995; Keirs et al., 2002; Warner et al., 2006). This could mean less pectoral
muscle at market age, and consequently economic losses. Thus, there is a need to study
the role the pectoral muscle plays in embryonic metabolism during embryo development,
hatching and brooding.
The importance of the hatching muscle to the developing embryo was already
discussed above, but it is worth emphasizing some more key points. The Complexus muscle or hatching muscle is a large paired neck muscle that overlies the spinalis and biventer cervicus muscles (Gross, 1985), extending from the dorsal surface of the transverse process of some of the anterior cervical vertebrae to the occipital crest of the
skull (George and Berger, 1966). Each half is divided into three segments with
neuromuscular junctions in between them. It acts by extending the head dorsally and
pipping, and then shrinking during 3 to 8 days post-hatch (John et al., 1987). The
function of this muscle is to help the embryo pierce the membranes and the shell (Moran,
2007). Enlargement of the hatching muscle forces the egg-tooth to push against the shell,
thereby causing the shell to crack (Smail, 1964). There are not many studies on structural
and metabolic aspects of this muscle in relation to its function, but what is known is that
it has two types of muscle fibers. The majority of the fibers are glycolytic only (able to
use glucose exclusively), and a few are oxidative-glycolytic (able to use glucose and fatty
acids). The muscle swelling happens with accumulation of high amounts of water and
glycogen granules, which is reduced by half after hatch (John, et al., 1987). Glycolytic
fibers produce lactate and are more active during pipping and hatching, while
oxidative-glycolytic fibers are active after hatch, coinciding with rising amounts of free fatty acids
in this tissue (John et al., 1987). The complexus muscle has its independent nerve control (Gross, 1985; Moran, 2007) to coordinate its movements. Because it is one of the most
active muscles during emergence, it has higher energy demands than any other tissue of
the body. So the hatching muscle is an important tissue to consider when studying
late-term embryo energy metabolism and hatchability.
During egg incubation bird embryos do not invest much into gut development, but
at the end of the incubation period rapid visceral growth and maturation occurs. The
hatched poult must have a functional digestive system, because their nutrient reserves are
limited (Christensen et al., 2007), and it must start eating. The sooner the gastrointestinal
tract achieves its functional capacity, the sooner the young bird can utilize dietary
nutrients and efficiently grows to its genetic potential (Uni et al., 2006). It is