University of Windsor University of Windsor
Scholarship at UWindsor
Scholarship at UWindsor
Electronic Theses and Dissertations Theses, Dissertations, and Major Papers
2010
A Nano-Scale Chemical and Structural Characterization of
A Nano-Scale Chemical and Structural Characterization of
Chinook Salmon (Oncorhynchus tshawytscha) Otoliths Using a
Chinook Salmon (Oncorhynchus tshawytscha) Otoliths Using a
FIB and HRTEM
FIB and HRTEM
Desirée E. Chevalier University of Windsor
Follow this and additional works at: https://scholar.uwindsor.ca/etd
Recommended Citation Recommended Citation
Chevalier, Desirée E., "A Nano-Scale Chemical and Structural Characterization of Chinook Salmon (Oncorhynchus tshawytscha) Otoliths Using a FIB and HRTEM" (2010). Electronic Theses and Dissertations. 8000.
https://scholar.uwindsor.ca/etd/8000
A Nano-Scale Chemical and Structural Characterization of Chinook Salmon
(Oncorhynchus tshawytscha) Otoliths Using a FIB and HRTEM
by
Desiree E. Chevalier
A Thesis
Submitted to the Faculty of Graduate Studies
Through the Great Lakes Institute for Environmental Research In Partial Fulfillment of the Requirements for
The Degree of Master of Science at the University of Windsor
Windsor, Ontario, Canada
2010
1*1
Library and Archives Canada Published Heritage Branch Bibliothgque et Archives Canada Direction duPatrimoine de l'6dition
395 Wellington Street Ottawa ON K1A 0N4 Canada
395, rue Wellington Ottawa ON K1A 0N4 Canada
Your file Votre reference ISBN: 978-0-494-70587-2 Our file Notre r6f6rence ISBN: 978-0-494-70587-2
NOTICE: AVIS:
The author has granted a
non-exclusive license allowing Library and Archives Canada to reproduce, publish, archive, preserve, conserve, communicate to the public by
telecommunication or on the Internet, loan, distribute and sell theses
worldwide, for commercial or non-commercial purposes, in microform, paper, electronic and/or any other formats.
L'auteur a accorde une licence non exclusive permettant a la Bibliotheque et Archives Canada de reproduire, publier, archiver, sauvegarder, conserver, transmettre au public par telecommunication ou par I'lnternet, preter, distribuer et vendre des theses partout dans le monde, a des fins commerciales ou autres, sur support microforme, papier, electronique et/ou autres formats.
The author retains copyright ownership and moral rights in this thesis. Neither the thesis nor substantial extracts from it may be printed or otherwise reproduced without the author's permission.
L'auteur conserve la propriety du droit d'auteur et des droits moraux qui protege cette these. Ni la these ni des extraits substantiels de celle-ci ne doivent etre imprimes ou autrement
reproduits sans son autorisation.
In compliance with the Canadian Privacy Act some supporting forms may have been removed from this thesis.
While these forms may be included in the document page count, their removal does not represent any loss of content from the thesis.
Conformement a la loi canadienne sur la protection de la vie privee, quelques
formulaires secondares ont ete enleves de cette these.
Bien que ces formulaires aient inclus dans la pagination, il n'y aura aucun contenu manquant.
ABSTRACT
We used a focused ion beam (FIB) to create thin sections from the
post-hatch and core regions of Chinook salmon (Oncorhynchus tshawytscha)
c
otoliths. The nano-scale chemistry and structure of these regions was
characterized in thin section using scanning electron microscopy (SEM) in
conjunction with cathodoluminescence (CL) and high resolution transmission
electron microscopy (HRTEM). The results constrained the relative
distribution of several elements; silicon-enriched nodules were found in the
post-hatch otolith, and manganese, an element known to be enriched in the
greater otolith core, was most concentrated at the center of primordia and at
the primordia-core interfaces. Calcium was less abundant and carbon was
observed in greater relative concentrations in the primordia relative to the
surrounding core. HRTEM revealed a lack of crystallinity in the core relative to
the post-hatch otolith. This is the first study to successfully thin-section an
Declaration of Co-Authorship I Previous Publication
I. Co-Authorship Declaration
I hereby declare that this thesis incorporates material that is result of joint research, as follows: This thesis incorporates the outcome of a joint research undertaken in collaboration with Dr. Joel Gagnon, Dr. Todd Simpson, and Dr. Christopher Weisener. The collaboration is covered in Chapter 2 of the thesis. In all cases, the key ideas, primary contributions, experimental designs, data analysis and
interpretation, were performed by the author, and the contribution of co-authors was primarily through the provision of assistance with the development of methodology and assistance with instrumentation.
I am aware of the University of Windsor Senate Policy on Authorship and I certify that I have properly acknowledged the contribution of other researchers to my thesis, and have obtained written permission from each of the co-author(s) to include the above material(s) in my thesis.
I certify that, with the above qualification, this thesis, and the research to which it refers, is the product of my own work.
II. Declaration of Previous Publication
This thesis includes one original paper that has been previously submitted for publication in peer reviewed journals, as follows:
Thesis Chapter
Publication title/full citation Publication status*
Chapter 2 The nano-scale chemical and structural characterization of Chinook salmon
(Oncorhynchus tshawytscha) otolith cores using a FIB and HRTEM
Submitted to Environmental Science and Technology
I certify that I have obtained a written permission from the copyright owner(s) to include the above published material(s) in my thesis. I certify that the above material describes work completed during my registration as graduate student at the University of Windsor.
I declare that, to the best of my knowledge, my thesis does not infringe upon anyone's copyright nor violate any proprietary rights and that any ideas, techniques, quotations, or any other material from the work of other people included in my thesis, published or otherwise, are fully acknowledged in accordance with the standard referencing practices. Furthermore, to the extent that I have included copyrighted material that surpasses the bounds of fair dealing within the meaning of the Canada Copyright Act, I certify that I have obtained a written permission from the copyright owner(s) to include such material(s) in my thesis.
ACKNOWLEDGEMENTS
I would like to dedicate this work to my father, whose love of nature and
learning continue to inspire me even in his absence.
First, I would like to acknowledge Dr. Joel Gagnon and Dr. Christopher
Weisener for their continual support and guidance throughout this project.
With their help, I was able to design and apply a new methodology that
encompassed several disciplines and was both challenging and endlessly
fascinating. I would also like to thank my committee members, Dr. Brian
Fryer, Dr. lain Samson and Dr. Phil Graniero, for their interest and support of
this project. In addition, I would like to thank Dr. Todd Simpson from the
University of Western Ontario for his interest in our project and all his
assistance developing the FIB methodology. Support for TEM analysis was
graciously provided by Dr. Carmen Andrei, at McMaster University.
Assistance with SEM analysis and imaging was provided by Ms. Sharon
Lackie, whose expertise and dedication have been greatly appreciated. I
would also like to express my sincere thanks to Ms. Christina Smeaton for her
assistance with data analysis and support throughout the writing process.
Assistance with data analysis and sample preparation was kindly provided by
Ms. Melissa Price, Dr. Sonia Melancon, Dr. Zhe Song and Dr. Derek Hogan.
A special thanks to Dr. Brian Fryer, Dr. Yolanda Morbey at the University of
Western Ontario and Dr. Daniel Heath and Yellow Island Aquaculture for
Mrs. Connie laquinta and Dr. Aaron Fisk for all their help during my time at
GLIER. Lastly, I would like to thank my family and friends for all their love and
TABLE OF CONTENTS
ABSTRACT iii DECLARATION OF CO-AUTHORSHIP/PREVIOUS PUBLICATION iv
ACKNOWLEDGEMENTS v
LIST OF TABLES viii LIST OF FIGURES ix
CHAPTER 1: Introduction 1
1.1 THE PROBLEM 2
1.2 BACKGROUND 3
1.2-1 The function and composition of otoliths 3 1.2-2 The teleost otolith: Use in elemental "fingerprinting" 4
1.2-3 The otolith core: Microchemistry and microstructure 5
1.2-4 Resolving scale-based limitations 8
1.3 OBJECTIVES 12
1.4 LITERATURE CITED 14
CHAPTER 2: A nano-scale chemical and structural characterization of Chinook salmon (Oncorhynchus tshawytscha) otolith core using a FIB
and HRTEM 20
2.1 INTRODUCTION 21
2.2 MATERIALS AND METHODS 23
2.2-1 Extraction and sectioning of otoliths 24
2.2-2 Application of reference marks 24
2.2-3 SEM-CL and SEM-EDS analysis 25
2.2-4 FIB/SEM analysis 26
2.2-5 HRTEM analysis 29
2.3 RESULTS 29
2.3-1 Identification and preliminary micro-scale chemical characterization of core region using CL and
SEM-EDS 29
2.3-2 Thin sectioning and preliminary micro-scale chemical
characterization using FIB/SEM 31
2.3-3 Nano-scale characterization of otolith chemistry and
structure using HRTEM 33
2.4 DISCUSSION 36 2.5 LITERATURE CITED 38
CHAPTER 3: Summary, suggestions for future work and
conclusions 42
3.1 SUMMARY 43 3.2 SUGGESTIONS FOR FUTURE WORK 44
3.3 CONCLUSIONS 45
3.4 LITERATURE CITED 48
LIST OF TABLES
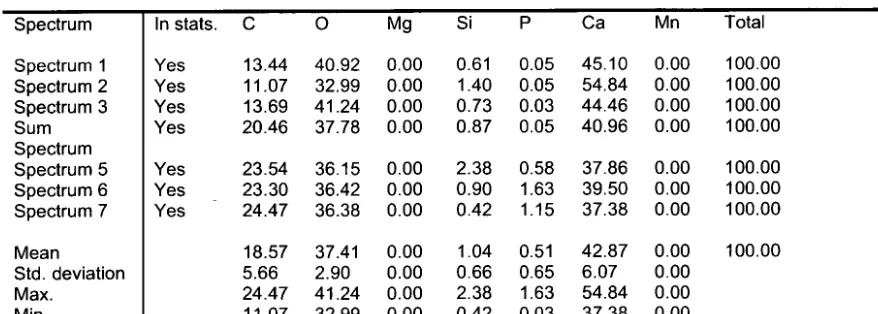
Table 1 EDS spectra collected from thin section milled from the 49 post-hatch otolith (6 locations)
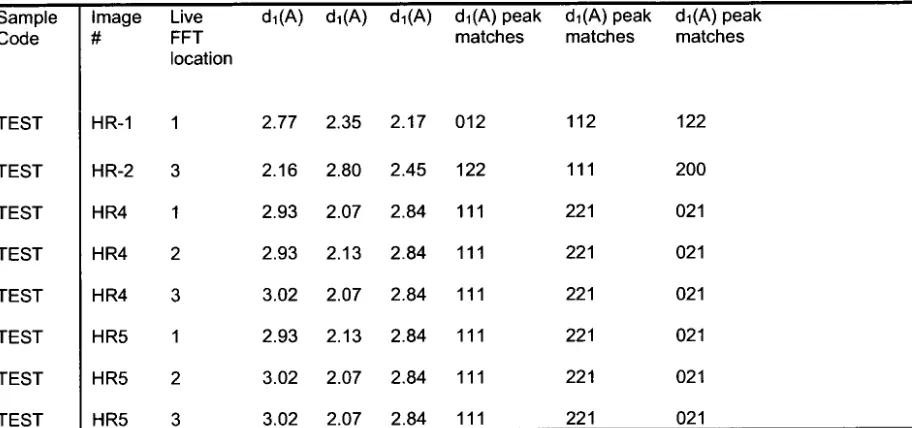
Table 2 D-spacing values collected from a thin section milled from 50 the post-hatch otolith (8 locations)
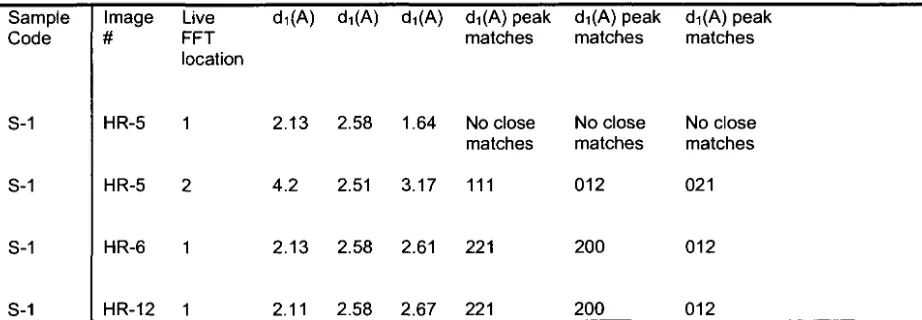
Table 3 D-spacing values collected from a thin section milled of the 51 otolith core region (4 locations)
LIST OF FIGURES Figure 1 Figure 2 Figure 3 Figure 4 Figure 5 Figure 6 Figure 7 Figure 8
SEM-SE image of sample surface with FIB-milled grid 53 surrounding the otolith core.
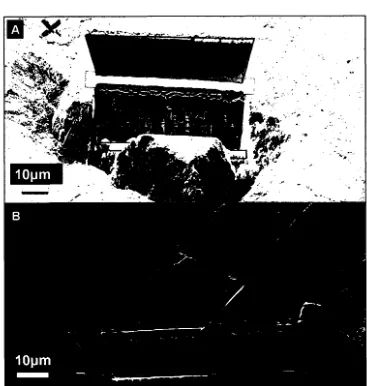
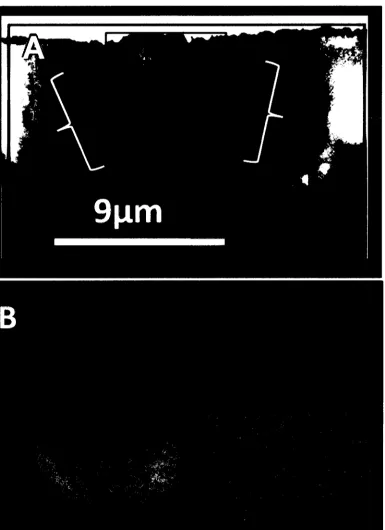
A) SEM-SE image of two trenches milled using a FIB on 54 either side of a created thin section prior to lift-out.
B) Thin-section lift-out using a pair of tines cut in the tip of a TEM grid-sized Mo foil.
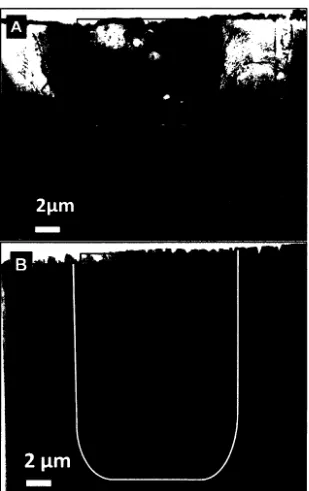
A) SEM-BSE image of the core region after collection of 55 SEM-EDS maps noting some electron beam damage that
was incurred.
B) SEM-BSE image of core region prior to SEM-EDS
mapping highlighting a porous region thought to be the result of loss of organic content during storage.
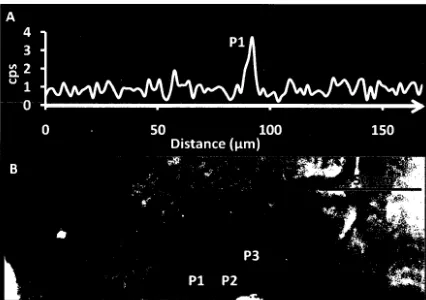
A) SEM-BSE image of an otolith after polishing showing the 56 distribution of manganese (cps) across an SEM-EDS line
scan region through the otolith core and several primordia. B) SEM-CL image of the region shown in Figure 4A showing the luminescence of first few daily increments and three luminescent primordia.
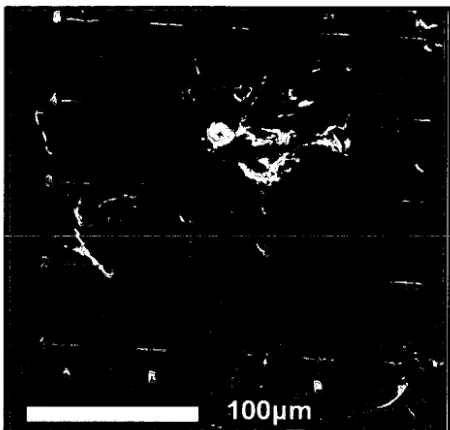
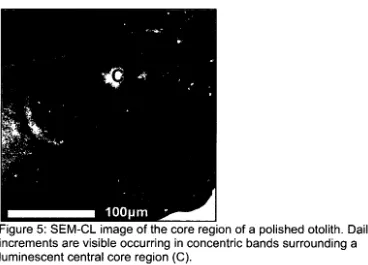
SEM-CL image of the core region of a polished otolith. Daily 57 increments are visible occurring in concentric bands
surrounding a luminescent central core region.
A) SEM-BSE image of otolith core region. 58 B) SEM-EDS maps of C, O, Ca and Mn collected from
sample surface shown in Figure 6A.
A) TEM-HAADF image of thin section milled from a region of 59 the post-hatch otolith highlighting round, silicon-enriched
nodules in the sample.
B) TEM-HAADF image of nodules and locations where EDS spectra were collected.
Figure 9 A) TEM-BF image of thin section milled to include the otolith 61 core showing multiple primordia throughout the region with
numbered regions indicating locations where high resolution images were collected.
B) TEM-BF image of the interface between a primordium and the rest of the otolith core with FFT images and d-spacings calculated from images of the area.
Figure 10 FFT of locations denoted in Table 3. 62
Figure 11 A) TEM-HAADF image of a single primordium in the thin 63 section milled to include the otolith core region. Numbered
CHAPTER 1
1.1 THE PROBLEM
The otolith has quickly become regarded as one of the most important
tools in modern fisheries research. Providing a record of age and
environmental exposure throughout life in teleost fish, this information can
reveal life history events and be used to discern stock populations. The otolith
also possesses information regarding the embryonic life offish (i.e., the otolith
core). Formed in some species just a few days after fertilization, the otolith
core is the pre-hatch portion of the otolith and contains valuable chemical
information because it incorporates elements from both the natal habitat site
as well as maternal associations via the yolk sac. Understanding core
chemistry in particular is important for conservation management and
provides insight into the mechanisms of early otolith formation.
Although high resolution microscopy methods, such as transmission
electron microscopy (TEM), are commonly used for nano-scale chemical and
structural characterization in minerals, these high resolution methods require
the creation of thin sections only a few hundred nanometers thickness.
Biominerals, such as otoliths, do not possess the same structural integrity as
most minerals due to the presence of organics in the structure, which makes
the creation of such thin sections difficult or impossible. Physical methods of
creating thin sections cannot produce sections of appropriate thickness due to
fracturing during the toming process. The only prior alternative to the creation
sample preparation that often involved the loss of mineral or biological
content from the otolith through grinding or demineralization of the sample
and subsequent chemical treatment.
The use of a focused ion beam (FIB) for production of thin sections
was originally developed in materials science but has recently become
popular in the creation of thin sections in biominerals as well. Despite the
presence of organic content in these biominerals, the use of a FIB has
enabled users to mill thin sections without damaging the sample and without
complex sample preparation. Additionally, this method does not result the
de-mineralization of the sample or loss of organic content. A FIB is also used
commonly in conjunction with scanning electron microscopy (SEM), which
uses an electron beam to provide images immediately before or after thin
section milling using a FIB.
The goal of this study is to develop a method for creating thin sections
from both the core and the post-hatch regions of Chinook salmon
(Oncorhynchus tshawytscha) otoliths using a FIB in conjunction with SEM
and to provide the first nano-scale chemical and structural characterization of
FIB-milled thin sections using high resolution transmission electron
1.2 BACKGROUND
1.2-1 The function and composition of otoliths
Otoconia are biominerals found in the inner ear of vertebrates and are
necessary for hearing and balance (HUGHES et al., 2 0 0 4 ) . Composed largely
(~ 97%) of calcium carbonate (CaC03) in an organic matrix of glycoprotiens
and proteoglycans (~ 0.2 to 10%), the otoconia form during the embryonic
stage and are maintained throughout life (BORELLI et al., 2 0 0 3 ; DEGENS et al.,
1 9 6 9 ; HUGHES e t a l . , 2 0 0 4 ; MURAYAMA e t a l . , 2 0 0 0 ; MURAYAMA e t a l . , 2 0 0 2 ) . I n
teleost (bony) fish, the otoconia are termed otoliths. Although otoliths have a
function and composition similar to the otoconia of other vertebrates, they
have a different structure and grow throughout life by forming daily layers
accreted from the endolymph fluid of the inner ear (BORELLI et al., 2 0 0 3 ;
HUGHES e t a l . , 2 0 0 4 ) .
1.2-2 The teleost otolith: Use in elemental "fingerprinting"
The chemistry of the endolymph fluid has been shown to be influenced
by the ambient environment. As water passes through the gills of the fish to
provide oxygen to the blood, trace elements, along with calcium, carbonate
and bicarbonate ions and dissolved inorganic carbon are incorporated into the
blood and then into the endolymph fluid (CAMPANA, 1 9 9 9 ) . As a result, an
individual otolith will possess a trace element "fingerprint" (< 1% of whole
(CAMPANA et al., 2000). The presence of this trace element signature, along
with the fact that the inorganic components of teleost otoliths (unlike human
otoconia) are thought not to be subject to re-absorption after incorporation,
makes otoliths a valuable and commonly-used tool in fisheries science
(CAMPANA, 1 9 9 9 ) .
Otolith micro-chemical assays using LA-ICP-MS (laser ablation
inductively coupled plasma mass spectrometry) have applications for stock
delineation of fish as well as for the assessment of population migration,
structure and mixing, and life-history strategies (CAMPANA, 1 9 9 9 ; THRESHER,
1 9 9 9 ) . Additionally, the microchemistry of the otolith core, which is the portion
of the otolith that forms during the embryonic stage, has become the focus of
several recent studies because its chemistry is considered reflective of natal
habitats and maternal signatures in individuals (BROPHY et al., 2 0 0 4 ; CAMPANA
e t a l . , 2 0 0 0 ; MILLER a n d KENT, 2 0 0 9 ; SECOR e t a l . , 2 0 0 1 ; V O L K e t a l . , 2 0 0 0 ;
WARNER etal., 2 0 0 5 ) .
1.2-3 The otolith core: microchemistry and microstructure
Typically less than 20 pm in diameter, the core houses the
primordium, which is the site of initial nucleation in the otolith (0.5 to 1 pm
diameter) (KALISH et al., 1 9 9 5 ) . In some fish species, such as salmonids,
there are multiple primordia (which may be separate or fused), whereas in
other species, only one is present (SOKOLOWSKI, 1 9 8 6 ) . Chemical assays of
has a resolution capable of differentiating the composition of the otolith core
from the remainder of the otolith, it cannot provide a nano-scale chemical
characterization of the core.
Studies by several authors have provided evidence that the core
possesses a greater concentration of organic content, an amorphous
structure, as well as a significantly higher concentration of the element
manganese (Mn) compared to the post-hatch otolith (BEIER and ANKEN, 2 0 0 6 ;
BROPHY e t a l . , 2 0 0 4 ; CARLSTROM, 1 9 6 3 ; DEGENS e t al., 1 9 6 9 ; FREEMAN e t a l . ,
2 0 0 8 ; JOLIVET e t a l . , 2 0 0 8 ; MELANCON e t a l . , 2 0 0 8 ; MURAYAMA e t a l . , 2 0 0 4 ;
POUGET e t a l . , 2 0 0 9 ; RUTTENBERG e t a l . , 2 0 0 5 ; SOKOLOWSKI, 1 9 8 6 ; ZHANG a n d
RUNHAM, 1 9 9 2 ) . The determinations of element concentrations using L A I C P
-MS typically assume that the otolith core comprises exclusively inorganic
material (i.e., 100% aragonite). Therefore, it is necessary to fully understand
otolith core composition to ensure: 1. the accuracy of elemental data obtained
using LA-ICP-MS and 2. the validity of interpretations regarding the early life
history offish that are inferred from these data.
There are several reasons why more organic content might be
observed in the otolith core compared with the region of the otolith formed
later after hatch. Degens et al., (1969), presented the first research on otolith
proteins. Their isolation of a 150,000 molecular weight (MW) protein, which
they termed otolin, led them to the conclusion that proteins found in the
organic matrix of the otolith (which comprises about ~ 0.2 to 10% of the
al., 1 9 6 9 ) . They presented a theory that protein was associated with
mineralization because it contained a large proportion of oxygen-rich amino
acids that were bound to calcium ions (DEGENS et al., 1 9 6 9 ) . The subsequent
nucleation and crystal growth produced the aragonite polymorph of calcium
carbonate (DEGENS et al., 1 9 6 9 ) . Later studies would provide evidence to
support the theory presented by Degens et al. ( 1 9 6 9 ) by showing that
proteins (and their associated enzymes) were necessary for normal formation
of mollusk shells and otoliths (BELCHER et al., 1 9 9 6 ; MURAYAMA et al., 2 0 0 4 ;
SOLLNER et al., 2 0 0 3 ) . The enzyme carbonic anhydrase (CAH), which
provides carbonate for CaCC>3 formation, is an example of such a protein
product (BEIER and ANKEN, 2 0 0 6 ) .
While higher organic concentrations may be the cause of the lack of
crystallinity observed in the otolith core, some research has suggested the
early core is composed of a mineraloid called amorphous calcium carbonate
( A C C ) (FREEMAN e t a l . , 2 0 0 8 ; LOWENSTAM, 1 9 8 1 ; NEUMANN a n d EPPLE, 2 0 0 7 ;
POUGET e t al., 2 0 0 9 ; ROSAUER a n d REDMOND, 1 9 8 5 ; SOKOLOWSKI, 1 9 8 6 ) . It is
thought that ACC nanoparticles nucleate as a precursor phase in carbonates
before undergoing a rearrangement event to crystalline CaC03 (FREEMAN et
a l . , 2 0 0 8 ; LOWENSTAM, 1 9 8 1 ; NEUMANN a n d EPPLE, 2 0 0 7 ; POUGET e t a l . , 2 0 0 9 ;
ROSAUER and REDMOND, 1 9 8 5 ; SOKOLOWSKI, 1 9 8 6 ) . These studies also
suggest that the ACC that composes the early otolith is reduced to only trace
quantities by adulthood (LOWENSTAM, 1 9 8 1 ; NEUMANN and EPPLE, 2 0 0 7 ;
The evidence for abundant organics and an amorphous structure in the
core is not found in the post-hatch otolith. In particular, the identification of Mn
peaks in the cores of otoliths illustrates the compositional differences between
the otolith core and the post-hatch otolith. Ruttenberg et al. (2005) found
using LA-ICP-MS that otolith cores analyzed across six different species of
fish were shown consistently to have elevated concentrations of Mn in
comparison with the region adjacent to the otolith core region. The core was
considered to have a Mn spike if the Mn concentration was at least three
times greater than the previous site of ablation (RUTTENBERG et al., 2005).
The presence of an increased concentration of Mn in the otolith core implies a
relationship between the early development offish and Mn. Studies in the
otoconia of other vertebrates, including rats, birds and reptiles, have shown
Mn deficiencies during development to cause otolith defects and subsequent
detrimental effects on animal behavior and survival (ERWAY et al., 1 9 7 1 ;
ERWAY e t a l . , 1 9 8 6 ; HORI a n d IWASAKI, 1 9 7 6 ) .
Melancon et al. (2008) also noted in their study of otolith
micro-chemistry using LA-ICP-MS that the calculated concentration of Mn at the
centre of the core (the primordia) might be underestimated due to
technological limitations of LA-ICP-MS (a volume of material larger than the
otolith primordia itself was sampled). While LA-ICP-MS is useful for
differentiating the core from the post-hatch otolith, it cannot be used to
further insights into otolith development, natal habitat, and the
characterization of maternal associations.
1.2-4 Resolving scale-based limitations
The development of a high-resolution methodology that limits or does
not require the loss of any organic or inorganic components is desirable for
the characterization of the nano-scale structure and chemistry of the otolith
core.
While wavelength-dispersive electron microprobe (WD-EM) and
energy-dispersive electron microprobe (ED-EM) have both been used for targeted
elemental analysis in fish otoliths, only LA-ICP-MS and nuclear microscopy
using proton-induced x-ray emission (pPIXE) methods have been found to
provide the resolution necessary for the analysis of trace elements within the
otolith structure (with the exception of Sr, which could also be detected and
analyzed using WD-EM) (CAMPANA et al., 1 9 9 7 ) . LA-ICP-MS spot size is too
large for nano-scale chemical analysis and results in permanent loss of the
sample, while the results of pPIXE in otoliths can be difficult to interpret due to
interference from sodium (Na) (LIMBURG et al., 2 0 0 3 ; LIMBURG et al., 2 0 0 7 ) .
Electron microprobes, while able to provide micro-scale maps, can only
detect elements with a concentration in the parts per thousand range, which
is significantly more concentrated than the levels that most trace elements
Scale-based limitations have been identified in the analysis of other
biominerals as well (i.e., teeth and shells). In these studies, HRTEM and
synchrotron x-ray fluorescence (XRF) methods have been used to provide
improved spatial resolution of the chemistry and structure present without
damage to the sample (KUDO et al., 2 0 1 0 ; LIMBURG et al., 2 0 0 7 ; NALLA et al.,
2 0 0 5 ; SAUNDERS e t a l . , 2 0 0 9 ; TEMPLETON a n d KNOWLES, 2 0 0 9 ; WIRTH, 2 0 0 9 ) .
The challenge in pursuing these methods of analyses is in the sample
preparation. Resolving the structure of the sample requires the sample to be
in a thin section (ideally ~ 150 nm thick) to allow the penetration of either an
electron beam (HRTEM) or x-rays (synchrotron XRF) (TEMPLETON and
KNOWLES, 2 0 0 9 ) . The production of a thin section ~ 1 5 0 nm thick cannot
easily be achieved through physical sectioning methods (toming), likely due to
structural instability in the sample as a result of the organic content present.
A possible solution to this dilemma is the use of a FIB. This approach
uses a beam of gallium (Ga) ions approximately 2 to 5 nm in diameter that
interacts with the sample surface causing a sputtering of atoms, which allows
for the selective milling of thin sections (STOKES et al., 2 0 0 6 ; WIRTH, 2 0 0 9 ) .
Additionally, most FIBs are also equipped with an SEM that allows real-time
imaging of the sample through the interaction of a beam of electrons with the
sample surface, which causes ions and secondary electrons to be emitted
and used to form an image (STOKES et al., 2 0 0 6 ) . A FIB has already been
used successfully to create thin sections from several biominerals including
al., 2009), although it has not yet been used in the creation of thin-sections
from otoliths.
In principle, the production of a thin section from an otolith using a FIB
does not present a challenge. The challenge, however, lies in developing a
methodology to create a thin section from a specific site of interest, in this
case, the otolith core. A method of identifying the approximate location of the
core compatible with the SEM imaging used in real time while FIB milling the
thin section is required. Otolith growth structures (daily growth rings and
primordia) are not easily imaged using SEM because the trace element
variation is often below the detection limit. SEM used in conjunction with a
cathodoluminescence (CL) detector, however, could be used to successfully
image growth textures in otoliths. CL uses a photon beam to excite the
electrons at the sample surface causing the emission of electromagnetic
radiation from the sample (luminescence) within the visible range (HALDEN et
al., 2004). Halden et al. (2004) demonstrated using CL and PIXE, that otolith
regions with the highest Mn concentrations had the brightest luminescence,
making the otolith core one of the most visible growth features using CL
based on the Mn-enrichment in the core relative to the post-hatch otolith
(BROPHY et al., 2004; HALDEN et al., 2004; MELANCON et al., 2008;
RUTTENBERG et al., 2005). SEM-CL also possesses an advantage over
traditional CL because it can be combined with energy dispersive x-ray
spectroscopy (EDS) on the SEM, producing pg/g range chemical maps of an
favoured for the characterization of growth textures in minerals such as quartz
(LANDTWING and PETTKE, 2 0 0 5 ) , and was also used to discriminate between
CaCC>3 polymorphs in otoliths (BEAREZ et al., 2 0 0 5 ) . An inherent problem with
imaging otolith cores using SEM-CL is the low success rate associated with
the exposure of the otolith core via manual polishing with lapping film.
SEM-CL is a surface technique and if the otolith core is not exposed, luminescence
may not be observed. This could potentially necessitate the preparation of a
relatively large number of samples for SEM-CL analysis.
Using SEM-CL to locate the otolith core and successive milling using a
FIB constitutes a new methodology for the production of thin sections suitable
for high resolution microscopy that potentially does not involve any loss of
organic or inorganic content in the otolith. HRTEM is a relatively accessible
technology that can be used to perform a nano-scale chemical and structural
characterization of the FIB-milled otolith thin section. High-resolution EDS
can be conducted using HRTEM to provide chemical information about the
sample and fast Fourier transform (FFT) of the images can be used to
characterize crystalline phases present (BENDERSKY and GAYLE, 2001).
HRTEM is not a technique that has been used in otoliths in recent years for
the purpose of characterizing chemistry possibly due to the extensive sample
preparation that would be required to ready the sample for imaging. Without a
method of creating a thin-section through some means of physical milling, the
only way to gain insight into the nano-structures and chemistry of the sample
otolith-derived supernatant (Li et al., 2 0 0 9 ) . When contrasted with the method
of FIB sectioning for HRTEM analysis, which has been conducted in
geomaterials and several biominerals, there is a wealth of structural and
mineralogical data to be gathered without loss of organic or inorganic
components and complex sample preparation ( K U D O et al., 2 0 1 0 ; NALLA et al.,
2 0 0 5 ; SAUNDERS e t a l . , 2 0 0 9 ; WIRTH, 2 0 0 9 ) .
1.3 OBJECTIVES
The objectives of this study are:
1) The development of a methodology that can be used to;
i) Identify the otolith core
ii) Provide a preliminary micro-scale chemical
characterization
iii) Produce a thin section from the otolith using a FIB
2) Conduct nano-scale chemical and structural characterization
of otoliths using thin sections created following the methodology
outlined in (1) in conjunction with HRTEM.
3) Interpret this data in the context of the current understanding
of otolith formation and structure.
This information may be useful for those seeking higher-resolution
alternatives to typical LA-ICP-MS analyses in otolith trace element assays.
and management specialists often rely on core microchemistry in the
identification of natal habitats and life history characteristics in juveniles to
make management decisions (KALISH, 1 9 9 9 ; VoLKet al., 2 0 0 0 ; WARNER et al.,
2 0 0 5 ; ZHANG and BEAMISH, 2 0 0 0 ) . Additionally, if the otolith core can be
successfully thin-sectioned, the structural and chemical information obtained
will provide further data on the development of the early otolith which may
facilitate an improved understanding of early otolith formation and
1.4 LITERATURE CITED
Bearez P., Carlier G., Lorand J. P., and Parodi G. C. (2005) Destructive and non-destructive microanalysis of biocarbonates applied to anomalous otoliths of archaeological and modern sciaenids (Teleostei) from Peru and Chile. Comptes Rendus Biologies 328(3), 243-252.
Bendersky L. A. and Gayle F. W. (2001) Electron diffraction using
transmission electron microscopy. Journal of Research of the National Institute of Standards and Technology 106(6), 997-1012.
Beier M. and Anken R. (2006) On the role of carbonic anhydrase in the early phase offish otolith mineralization. In Space Life Sciences, Vol. 38 (ed. L. L. Bruce and C. Dournon), pp. 1119-1122.
Belcher A. M „ Wu X. H., Christensen R. J., Hansma P. K „ Stucky G. D., and Morse D. E. (1996) Control of crystal phase switching and orientation by soluble mollusc-shell proteins. Nature 381(6577), 56-58.
Borelli G., Mayer-Gostan N., Merle P. L., De Pontual H., Boeuf G., Allemand D., and Payan P. (2003) Composition of biomineral organic matrices with special emphasis on turbot (Psetta maxima) otolith and
endolymph. Calcified Tissue International 72(6), 717-725.
Brophy D., Jeffries T. E., and Danilowicz B. S. (2004) Elevated manganese concentrations at the cores of clupeid otoliths: possible environmental, physiological, or structural origins. Marine Biology 144(4), 779-786.
Campana S. E. (1999) Chemistry and composition offish otoliths: pathways, mechanisms and applications. Marine Ecology-Progress Series 188,
263-297.
Campana S. E., Chouinard G. A., Hanson J. M., Frechet A., and Brattey J. (2000) Otolith elemental fingerprints as biological tracers offish stocks.
Fisheries Research 46(1-3), 343-357.
Campana S. E., Thorrold S. R., Jones C. M., Gunther D., Tubrett M., Longerich H., Jackson S., Halden N. M., Kalish J. M., Piccoli P., dePontual H., Troadec H., Panfili J., Secor D. H., Severin K. P., Sie S. H „ Thresher R., Teesdale W. J., and Campbell J. L. (1997)
Comparison of accuracy, precision, and sensitivity in elemental assays offish otoliths using the electron microprobe, proton-induced X-ray emission, and laser ablation inductively coupled plasma mass spectrometry. Canadian Journal of Fisheries and Aquatic Sciences
Carlstrom D. (1963) A Crystallographic Study of Vertebrate Otoliths.
Biological Bulletin 125(3), 441-463.
Degens E. T., Deuser W. G., and Haedrich R. L. (1969) Molecular Structure and Composition of Fish Otoliths. Marine Biology 2(2), 105-113.
Erway L., Fraser A. S., and Hurley L. S. (1971) Prevention of Congenital Otolith Defect in Pallid Mutant Mice by Manganese Supplementation.
Genetics 67(1), 97-108.
Erway L. C., Purichia N. A., Netzler E. R., Damore M. A., Esses D., and Levine M. (1986) Genes, Manganese, and Zinc in Formation of Otoconia - Labeling, Recovery, and Maternal Effects. Scanning Electron Microscopy 1986, 1681-1694.
Freeman C. L., Harding J. H., and Duffy D. M. (2008) Simulations of calcite crystallization on self-assembled monolayers. Langmuir 24(17), 9607-9615.
Halden N. M„ Mathers K „ Babaluk J. A., and Mejia S. R. (2004) Cathodoluminescence microscopy: A useful tool for assessing incremental chemical variation in otoliths. Environmental Biology of Fishes 71(1), 53-61.
Hori R. and Iwasaki S. (1976) Manganese Content of Egg of Oryzias-Latipes
and its Changes During Early Development. Protoplasma 87(4), 403-407.
Hughes I., Blasiole L., Huss D., Warchol M. E., Rath N. P., Hurle B., Ignatova E., Dickman J. D., Thalmann R., Levenson R., and Ornitz D. M. (2004) Otopetrin 1 is required for otolith formation in the zebrafish Danio rerio. Developmental Biology 276(2), 391 -402.
Jolivet A., Bardeau J. F., Fablet R„ Paulet Y. M., and de Pontual H. (2008) Understanding otolith biomineralization processes: new insights into microscale spatial distribution of organic and mineral fractions from Raman microspectrometry. Analytical and Bioanalytical Chemistry
392(3), 551-560.
Kalish J. M. (1990) Use of Otolith Microchemistry to Distinguish the Progeny of Sympatric Anadromous and Non-Anadromous Salmonids. Fishery Bulletin 88(4), 657-666.
Developments in Fish Otolith Research (ed. D. H. Secor, J. M. Dean, and S. E. Campana), pp. 723-729.
Kudo M., Kameda J., Saruwatari K., Ozaki N., Okano K., Nagasawa H., and Kogure T. (2010) Microtexture of larval shell of oyster, Crassostrea nippona: A FIB-TEM study. Journal of Structural Biology 169(1), 1-5.
Landtwing M. R. and Pettke T. (2005) Relationships between SEM-cathodoluminescence response and trace-element composition of hydrothermal vein quartz. American Mineralogist 90(1), 122-131.
Li Z., Gao Y. H., and Feng Q. L. (2009) Hierarchical structure of the otolith of adult wild carp. Materials Science & Engineering C-Biomimetic and Supramolecular Systems 29(3), 919-924.
Limburg K. E., Elfman M., Kristiansson P., Malmkvist K., and Pallon J. (2003) New insights into fish ecology via nuclear microscopy of otoliths. In
Application of Accelerators in Research and Industry, Vol. 680 (ed. J. L. Duggan and I. L. Morgan), pp. 339-342. Amer Inst Physics.
Limburg K. E., Huang R„ and Bilderback D. H. (2007) Fish otolith trace element maps: new approaches with synchrotron microbeam x-ray fluorescence. X-Ray Spectrometry 36(5), 336-342.
Lowenstam H. A. (1981) Minerals Formed by Organisms. Science 211(4487), . 1126-1131.
Melancon S., Fryer B. J., Gagnon J. E., and Ludsin S. A. (2008) Mineralogical approaches to the study of biomineralization in fish otoliths.
Mineralogical Magazine 72(2), 627-637.
Miller J. A. and Kent A. J. R. (2009) The determination of maternal run time in juvenile Chinook salmon (Oncorhynchus tshawytscha) based on Sr/Ca and Sr-87/Sr-86 within otolith cores. Fisheries Research 95(2-3), 373-378.
Murayama E., Okuno A., Ohira T., Takagi Y., and Nagasawa H. (2000) Molecular cloning and expression of an otolith matrix protein cDNA from the rainbow trout, Oncorhynchus mykiss. Comparative
Biochemistry and Physiology B-Biochemistry & Molecular Biology
126(4), 511-520.
between the adult inner ear and embryonic otocysts. Histochemistry and Cell Biology 121 (2), 155-166.
Murayama E., Takagi Y., Ohira T., Davis J. G., Greene M. I., and Nagasawa H. (2002) Fish otolith contains a unique structural protein, otolin-1.
European Journal of Biochemistry 269(2), 688-696.
Nalla R. K., Porter A. E., Daraio C., Minor A. M., Radmilovic V., Stach E. A., Tomsia A. P., and Ritchie R. O. (2005) Ultrastructural examination of dentin using focused ion-beam cross-sectioning and transmission electron microscopy. Micron 36(7-8), 672-680.
Neumann M. and Epple M. (2007) Monohydrocalcite and its relationship to hydrated amorphous calcium carbonate in biominerals. European Journal of Inorganic Chemistry(14), 1953-1957.
Pouget E. M., Bomans P. H. H., Goos J., Frederik P. M., de With G., and Sommerdijk N. (2009) The Initial Stages of Template-Controlled CaC03 Formation Revealed by Cryo-TEM. Science 323(5920), 1455-1458.
Rosauer E. A. and Redmond J. R. (1985) Comparative Crystallography of Vertebrate Otoconia. Journal of Laryngology and Otology 99(1), 21-28.
Ruttenberg B. I., Hamilton S. L „ Hickford M. J. H., Paradis G. L „ Sheehy M. S., Standish J. D „ Ben-Tzvi O., and Warner R. R. (2005) Elevated levels of trace elements in cores of otoliths and their potential for use as natural tags. Marine Ecology-Progress Series 297, 273-281.
Saunders M „ Kong C., Shaw J. A., Macey D. J., and Clode P. L. (2009) Characterization of biominerals in the radula teeth of the chiton,
Acanthopleura hirtosa. Journal of Structural Biology 167(1), 55-61.
Secor D. H „ Rooker J. R., Zlokovitz E „ and Z. Danowicz V. S. (2001)
Identification of riverine, estuarine, and coastal contingents of Hudson River striped bass based upon otolith elemental fingerprints. Marine Ecology-Progress Series 211, 245-253.
Sokolowski B. H. A. (1986) Development of the Otolith in Embryonic Fishes with Special Reference to the Toadfish, Opsanus-Tau. Scanning Electron Microscopy 1986, 1635-1648.
Stokes D. J., Morrissey F., and Lich B. H. (2006) A new approach to studying biological and soft materials using focused ion beam scanning electron microscopy (FIB SEM). In EMAG-NANO 2005: Imaging, Analysis and Fabrication on the Nanoscale, Vol. 26 (ed. P. D. Brown, R. Baker, and B. Hamilton), pp. 50-53.
Templeton A. and Knowles E. (2009) Microbial Transformations of Minerals and Metals: Recent Advances in Geomicrobiology Derived from Synchrotron-Based X-Ray Spectroscopy and X-Ray Microscopy.
Annual Review of Earth and Planetary Sciences 37, 367-391.
Thresher R. E. (1999) Elemental composition of otoliths as a stock delineator in fishes. Fisheries Research 43(1-3), 165-204.
Volk E. C., Blakley A., Schroder S. L., and Kuehner S. M. (2000) Otolith chemistry reflects migratory characteristics of Pacific salmonids: Using otolith core chemistry to distinguish maternal associations with sea and freshwaters. Fisheries Research 46(1-3), 251-266.
Warner R. R., Swearer S. E., Caselle J. E., Sheehy M., and Paradis G. (2005) Natal trace-elemental signatures in the otoliths of an open-coast fish.
Limnology and Oceanography 50(5), 1529-1542.
Wirth R. (2009) Focused Ion Beam (FIB) combined with SEM and TEM: Advanced analytical tools for studies of chemical composition, microstructure and crystal structure in geomaterials on a nanometer scale. Chemical Geology 261(3-4), 217-229.
Zhang Z. and Beamish R. J. (2000) Use of otolith microstructure to study life history of juvenile Chinook salmon in the Strait of Georgia in 1995 and 1996. Fisheries Research 46(1-3), 239-250.
CHAPTER 2
A nano-scale chemical and structural characterization of Chinook salmon (Oncorhynchus tshawytscha) otolith cores using a FIB
and HRTEM*
2.1 INTRODUCTION
Otoliths are found in the inner ear organs of teleost (bony) fish and are
used for hearing and balance (PARKER, 1903; POPPER et al., 2003). Otoliths
are composed of predominantly (~ 97 to 99%) calcium carbonate in the
aragonite polymorph (CaCOs) with an organic matrix containing glycoprotiens,
proteoglycans and collagens (~ 2 to10%) (BORELLI et al., 2003; CARLSTROM,
1963; DEGENS et al., 1969; FERMIN et al., 1998; MURAYAMA et al., 2000; PISAM
et al., 2002; TADASHI, 1996). Daily growth rings are formed in otoliths via the
precipitation and accretion of organic and inorganic components from the
endolymph fluid. During this process, trace amounts of other elements
(up to 1.0 %) may substitute for calcium in the matrix and are thought to
reflect ambient water chemistry (CAMPANA, 1999). The trace element
composition is regarded by many as an environmental tracer and is typically
analyzed using laser ablation inductively coupled plasma mass spectrometry
( L A - I C P - M S ) (CAMPANA, 1999). This method requires minimal sample
preparation beyond initial polishing and sectioning of the otolith to produce a
cross section and sonication to remove debris. Many studies have used
LA-ICP-MS to examine the concentrations and spatial distribution of trace
elements among several fish species across habitats (CAMPANA, 1999;
THRESHER, 1999).
While the post-hatch region of the otolith reflects ambient chemistry
embryonic development, represents natal site chemistry as well as maternal
associations (KALISH et al., 1 9 9 5 ; VOLK et al., 2 0 0 0 ) . Typically less than 2 0 pm
in diameter, the otolith core contains one or several primordia, which are the
initial sites of otolith nucleation ( 0 . 5 to 1 pm diameter) (KALISH et al., 1 9 9 5 ;
MELANCON et al., 2 0 0 8 ) . Evidence suggests that the core is structurally and
compositionally different from the post-hatch otolith, containing a higher
organic content, an amorphous structure and manganese (Mn) enrichment
(BEIER a n d ANKEN, 2 0 0 6 ; BROPHY e t a l . , 2 0 0 4 ; CARLSTROM, 1 9 6 3 ; JOLIVET e t
a l . , 2 0 0 8 ; LOWENSTAM, 1 9 8 1 ; MELANCON e t a l . , 2 0 0 8 ; MURAYAMA e t a l . , 2 0 0 4 ;
NEUMANN a n d EPPLE, 2 0 0 7 ; POUGET e t a l . , 2 0 0 9 ; RUTTENBERG e t a l . , 2 0 0 5 ;
SOKOLOWSKI, 1 9 8 6 ; ZHANG a n d RUNHAM, 1 9 9 2 ) .
Despite the strides made by these studies in identifying the organic
constituents and general chemistry of the otolith, questions remain about the
nano-scale chemistry of the otolith. This information is desirable because it
can reveal the requirements for early development in fish. While LA-ICP-MS
can be used to differentiate between the core and the post-hatch otolith
based on Mn-enrichment in the core, laser spot size is variable, down to
about 6 pm. With the average primordia being ~ 1 to 0.5 pm in diameter,
LA-ICP-MS cannot provide a nano-scale chemical characterization of the otolith
core. A high-resolution (i.e., nanometer) method that prevents or limits
alteration of the sample structure and chemistry is needed in order to obtain
information regarding the structure and composition of otolith cores. In this
and analytical methods to obtain structural and compositional information
from the post-hatch and core region of juvenile Chinook salmon
(Oncorhynchus tshawytscha) otoliths. This information can provide a more
accurate assessment of core chemistry that can in turn be used to better
understand the early life history and maternal associations offish stocks. The
methods used include transmitted light microscopy, scanning electron
microscopy (SEM), focused ion beam (FIB) milling and sectioning, and high
resolution transmission electron microscopy (HRTEM).
2.2 MATERIALS AND METHODS
One of the challenges in this study was to precisely correlate micro-scale
(e.g., otolith sectioning) and nano-scale (e.g., core/primordia sectioning)
characterization and analysis while maintaining the ability to quickly and
accurately relocate the same, nano-scale feature (i.e., primordia) within an
otolith. To achieve this, a procedure was developed where a number of
analytical methods were employed to spatially reference, sample and
characterize otolith cores. In, summary, the procedure that was developed
involved:
1. Extraction and sectioning of the otoliths.
2. Application of reference markings on the surface of the sectioned
3. Identification and preliminary characterization of core regions and
primordia using micro-scale methods, such as SEM-energy dispersive
X-ray spectroscopy (SEM-EDS) and SEM cathodoluminescence
(SEM-CL).
4. Thin sectioning and chemical and structural characterization using
nano-scale methods (e.g., FIB and HRTEM).
2.2-1 Extraction and sectioning of otoliths
Otoliths from Chinook salmon fry harvested from Lake Ontario,
Ontario, Canada, were extracted according to the method described by
Payan et al. (1997). After extraction, otoliths were rinsed with Milli-Q®
ultrapure water and sonicated for approximately five minutes in a closed
Petrie dish in Q® water. Otoliths were then rinsed three times with
Milli-Q® water, mounted on a glass microscope slide and embedded in Crystal
Bond 509®, a thermoplastic polymer. Otoliths were then polished using
Milli-Q® water and 30-, 12- and 9-micron silica lapping film successively until the
core region appeared to be exposed upon examination under a Nikon®
polarizing light microscope in transmitted light.
2.2-2 Application of reference marks
A similar methodology of orienting the otoliths, along with the fact that
they were of similar size (and age) prior to polishing made the location of the
annotated light micrographs highlighting the core region of individual samples,
reference markings (a numbered and lettered grid) was machined onto the
surface of the otolith using a FIB of gallium (Ga) ions to provide coordinates
for the relocation of individual primordia within the otolith cores between
analytical methods. Figure 1 is a secondary electron SEM image of the otolith
showing the FIB-milled grid on the surface for relocation of the core during
later FIB thin-sectioning. Application of the reference marks and subsequent
sectioning was conducted using the Zeiss™ 1540XB FIB/SEM at the Western
Nanofabrication Facility at the University of Western Ontario, London,
Ontario, Canada. After reference markings were milled, preliminary
characterization of the core was conducted at the Great Lakes Institute for
Environmental Research, University of Windsor, Windsor, Ontario, Canada.
2.2-3 SEM-CL and SEM-EDS analysis
An FEI™ Quanta™ 200F field emission gun (FEG) SEM, equipped
with CL, was used to obtain images (Centaurus® scintillator backscattered
detector, high vacuum, 300 to 650 nm spectral range) of polished otoliths.
SEM-CL was used because it is a non-destructive imaging technique that
possesses several advantages over traditional CL, such as simultaneous
EDS analysis, which enables the detection of variations in the concentrations
of minor elements (LANDTWING and PETTKE, 2005). Sample slides were
conductive carbon tape. After primordia were located using CL, samples were
re-imaged in backscattered electron (BSE) mode under low vacuum ( - 8 0 Pa).
Low vacuum was used in SEM-BSE mode to optimize sample imaging by
avoiding the excessive charging inherent to high vacuum analysis. The
electron beam current was maintained between 10 to 20 kV to avoid beam
damage. Spot size was ~ 3 nm. To determine the spatial distribution of
elements within the otolith, elemental maps were collected and analyzed
using an EDAX Sapphire Si(Li) EDS detector and Genesis™ v5.21 software.
SEM-EDS provided elemental maps that were used to confirm the presence
of Mn peaks and provide preliminary microchemical data prior to FIB
sectioning and HRTEM microchemical analysis. Core locations were
referenced relative to the reference markings previously micro-machined
using a FIB.
2.2-4 FIB/SEM analysis
A FIB of 30 keV Ga ions was used to cut an ~ 250 nm thick section
from the otolith core. A pair of trenches 60 um x 30 um was FIB-milled on
either side of a 5 um wide strip containing the otolith core (Figure 2a). The
course milling used a 10 nA beam of 30 keV energy gallium (Ga) ions
focused to a beam diameter of ~ 500 nm. Prior to milling, a band of platinum
(Pt) 2 um thick was FIB-deposited over the region of interest to provide a
The exposed cross-section was polished on both sides using a 1nA Ga
beam (30 keV energy, 100 nm diameter) while simultaneously imaging by
SEM-BSE under high vacuum. Polishing was terminated once the otolith
core was exposed and visible in the SEM image. The exposed otolith
cross-section was imaged using a 5 nA beam of 10 keV electrons in SEM-BSE and
an elemental map of the region was then acquired by EDS. Extended
exposure to the electron beam caused visible damage to the region around
the otolith (Figure 3a). The damaged layer was subsequently removed as the
thin section was FIB-polished to a reduced thickness of 2.5 um.
The thin section was separated from the remainder of the otolith on
one side and at the bottom leaving the 40 um x 20 um x 2.5 um thick piece of
material attached on one side (Figure 2b). The tungsten (W) tip of an End
Effector™ mounted in the Ascend® Instruments Extreme Access™ lift-out
manipulator was FIB-milled to produce a pair of tines spaced 2.5 um apart.
After the tines were wedged over the fixed end of the lamella, the final end
was detached by FIB milling and the lamella was lifted clear of the trench.
Prior to final thinning, the lamella was welded to the tungsten tip with
FIB-deposited Pt to increase the stability of the specimen. The End
Effector™ was then folded over to form a 3 mm TEM grid. The sample was
then mounted vertically in a small vice on the sample stage of the FIB/SEM.
This approach provided precise and stable positioning of the lamella for final
polishing. The thickness of the lamella was reduced to approximately 1 um
Progress was monitored by simultaneous SEM imaging. The sample was
then rotated to view the second side by SEM during the final thinning. A 20
um wide region of the lamella, centered on the otolith core, was thinned by
FIB milling using a 30 keV energy, 200 pA beam. The thinning process was
terminated when the section reached a thickness of 250 nm, although ideal
TEM thin-section thickness for nanoscale characterization of chemistry and
structure is between 100 and 150 nm. Curling and buckling of the sample,
which was observed during the later portion of the thinning process, may
have been due to the higher organic content and variable concentrations of
mineral and organic components. A similar extent of buckling and curling was
not observed in the thin section extracted from a post-hatch region, which
was possibly due to the fact that organic content occurs in concentrations
typically below 0.2 to10 % outside the core (DEGENS et al., 1969).
Prior to sectioning, pockets with a porous or hollowed-out appearance
were observed in the core region beneath a cluster of primordia (Figure 3b). It
is possible that the porous texture observed may be the result of lost organic
content incurred due to the length of the sample storage period (>6 months).
The observation of this texture solely in the core region after an extended
period of storage may be due to the loss of organic content that may have
been present at one time in the otolith core, as organic content degrades over
time when not properly preserved (i.e. frozen or chemically preserved;
preservation through freezing or other means were not used for these
degradation of organic material in the otolith relative to storage time, so it is
difficult to tell what potential impact the storage time had on the organic
content in the sample. Curling and buckling of the thin section during
late-stage FIB thinning may have occurred due to the presence of this porous
region within the core.
2.2-5 HRTEM analysis
The FIB-milled sections were later retrieved and analyzed using an
FEI™ Titan™ 80-300 Cubed HRTEM at McMaster University, Hamilton,
Ontario, Canada. Bright field (BF) images and high angle annular dark field
(HAADF) scanning TEM (STEM) images were collected at 300 kV. In
addition, EDS spectra were collected in STEM mode with a probe size of 0.5
nm or less.
2.3 RESULTS
2.3-1 Identification and preliminary micro-scale chemical
characterization of core region using SEM-CL and SEM-EDS
Growth structures (e.g., diurnal rings and primordia) were not observed
using SEM-BSE across the exposed sample surface (Figure 4a, background).
SEM-CL imaging, however, revealed concentric, daily growth increments
surrounding several luminescent primordia, each of which was observed to be
decreased with distance from the core region. EDS line scans across the core
region confirmed the presence of an Mn peak (Figure 4a), corresponding with
the location of primordium P1 identified using SEM-CL (Figure 4b).
The visible appearance of growth structures using SEM-CL (that could
not be observed using SEM-BSE) is likely due to the difference in the limits of
detection between the two methods. CL is sensitive to trace elements, often
in the parts per billion range (ppb), while SEM-BSE is not ideal for imaging
organics because the elements that compose the majority of the sample
(C,0) are of low atomic mass and do not produce as much backscatter as
metals or samples with greater concentrations of heavy elements.
The Mn peak observed via SEM-EDS at primordia P1 (Figure 4a,
foreground) is consistent with earlier research, which suggests that the
luminescence observed in otoliths is related to an increased Mn concentration
(HALDEN et al., 2004). While luminescence was observed in primordia P 1
through P3 using SEM-CL, SEM-EDS line scans conducted through primordia
P2 and P3 did not yield detectable Mn as observed with P1, which may be
due to insufficient polishing resulting in the core not being exposed at the
sample surface. This highlights a significant challenge encountered during
otolith core/primordia analysis, as manual polishing is a very inefficient
method for revealing the otolith core. Due to the manner in which the otolith
grows (i.e., it accretes around the central core, which houses the primordia), it
can appear as though the core is well-exposed when, in reality, it may still be
takes a few passes of manual polishing to remove the area of interest
because the individual primordia are so small. Therefore, the success of
SEM-CL imaging of primordia is highly dependent upon sample preparation.
For example, Figure 5 shows luminescence of the otolith core from another
polished otolith sample. Despite the luminescence observed in the core in
Figure 5, SEM-EDS did not detect a Mn peak in the core.
Despite the challenges in initial sample preparation, SEM-CL was
applied successfully in this study to identify growth textures in otoliths.
Methods of exposing the otolith core more precisely are required for imaging.
2.3-2 Thin sectioning and preliminary micro-scale chemical
characterization of core region using FIB/SEM
A thin section of 250 nm thickness is shown prior to extraction from the
surrounding otolith in Figure 2a. The exposed surface of the thin section
adjacent to the excavated trench was imaged in situ prior to extraction (Figure
2b) using SEM-BSE. SEM-BSE images (Figure 6a) show that the core region
contains a number of primordia that are arranged in a cluster formation and
are chemically heterogeneous. The core boundary and primordia appear
brighter (Figure 6a), possibly due to higher concentrations of heavier
elements (such as Mn) producing more backscattered electrons compared to
structural differences as well. EDS maps collected using a FIB/SEM showed
that the concentrations of C and O were positively correlated in the exposed
sample surface, however, a weak, negative correlation was observed
between the concentrations of C and O relative to Ca at the core boundary
(Figure 6b). Mn occurred in higher concentrations in the primordia relative to
the surrounding otolith core region (Figure 6b).
There was some concern about the ability of a FIB to section
heterogeneous specimens, such as otoliths, which consist of mixtures of
relatively hard (e.g., mineral) and soft (e.g., protein) materials. For example,
Stokes et al. ( 2 0 0 6 ) observed some alteration at the interface between
mineralized and biological materials after using a FIB in sample preparation.
Although the majority of the otolith outside of the core contains relatively low
concentrations (~ 0.2 to 10 %) of organic material, the core has been
characterized as having a greater concentration of organic compounds
(DEGENS et al., 1 9 6 9 ; JOLIVET et al., 2 0 0 8 ) . FIB-related alteration at the
core-otolith or core-primordia interface after sectioning was not observed, however,
some damage to the sample surface was observed after SEM-EDS mapping
(Figure 3a). This damaged material was removed by polishing with the FIB
after SEM-EDS mapping to expose fresh, unaltered material for subsequent
2.3-3 Nano-scale characterization of otolith chemistry and structure
using HRTEM
Two prepared thin sections were imaged and analyzed using HRTEM.
The first thin section was created from the post-hatch otolith region and was
~ 200 nm thick. HAADF images of this thin section revealed rounded,
lighter-coloured "nodules" less than 1 pm in diameter that can be assumed to have a
greater concentration of heavy elements than the lighter adjacent areas
(Figure 7a). EDS spectra were collected in STEM mode from the centre and
edge of a nodule as well as from the surrounding adjacent region (Figure 7b).
EDS spectral analysis on the central region of the nodule showed
silicon (Si) content was 5.67 times greater by weight (2.38 weight percent,
spectrum 5) compared with the darker, adjacent region (0.42 weight percent,
spectrum 7) (Table 1). Atomic and weight percent values for all elements
within the detection range at each spectral analysis location can be found in
Table 1. The function of Si in otoliths and many other biominerals is not well
understood, although in diatoms and sponges it is a major structural
component and it plays a vital role in the formation of connective tissue in the
bones and cartilage of mammals and birds (CARLISLE, 1 9 8 8 ; PERRY, 2 0 0 3 ) .
D-spacings calculated from HRTEM images showed that the first thin
section (milled from the post-hatch region) was composed of CaC03 in the
aragonite polymorph. Measured d-spacing values were consistent at several
the thin section. D-spacing values and fast Fourier transform (FFT) images for
this thin section are included in Table 2 and Figure 8, respectively.
The second thin section was milled to include the core region of the
otolith. TEM bright field (BF) images confirmed that this thin section contained
several primordia (Figure 9a). High resolution images were collected from the
regions indicated in Figure 9a. Figure 9b shows an interface between a
primordium and the surrounding core region. While d-spacings could be
calculated from a few regions of this thin-section where a crystalline structure
was observed in the HRTEM images (and subsequently interpreted to be a
relatively close match with aragonite, see Table 3), several regions were
amorphous and d-spacings could not be calculated. Other regions where
FFT was attempted (site 5-1 in Figure 9a) did not yield d-spacings consistent
with any CaC03 polymorph (Table 3 and Figure 10). The more amorphous
structure observed in the interface region and region 5-1, along with the
darker appearance, suggests that both regions possess a composition more
enriched in heavy elements compared with the region in 5-2. While darker
contrast in TEM-BF can be suggestive of a physically thicker region, the close
proximity of sites 5-1 and 5-2 (< 25 nm) make variations in thickness an
unlikely cause for the observed contrast (Figure 9b).
Our findings corroborate numerous prior studies that have suggested
that the otolith core has a more amorphous structure than the post-hatch
otolith, possibly due to the increased presence of amorphous CaC03, or ACC
POUGET et al., 2 0 0 9 ; SOKOLOWSKI, 1 9 8 6 ) . Thin sections in this study were
milled from fry-aged (< 6 months old) otoliths. Juvenile otoliths are thought to
retain a greater portion of ACC in the core than adult otoliths; therefore,
variation of the degree of crystallinity in the otolith with age would likely be
observed (SOKOLOWSKI, 1 9 8 6 ) . The amorphous regions observed in bright
field TEM images (Figure 8) could also be reflective of increased organic
content in the core from the presence of proteins necessary for the initiation
and facilitation of mineralization in the otolith (BELCHER et al., 1 9 9 6 ; KANG et
a l . , 2 0 0 8 ; SOLLNER e t a l . , 2 0 0 3 ) .
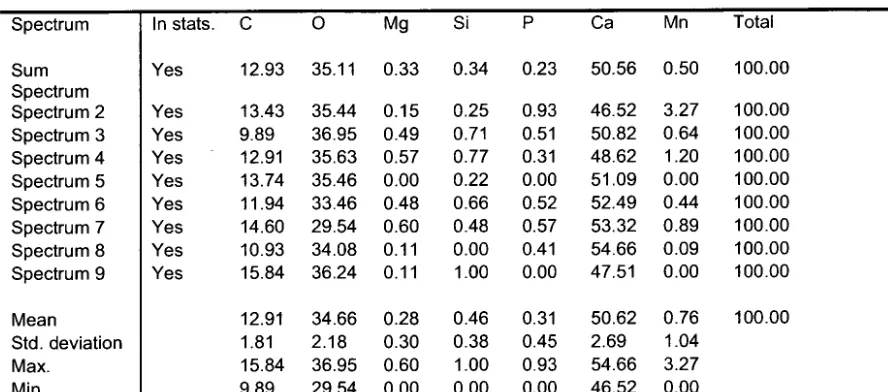
EDS spectra were also collected on a single primordium to reveal the
distribution of major element constituents (C, O, Ca) along with Mn. EDS
results showed less C, Ca and O in the primordium relative to the adjacent
core region (Figure 11). Mn, however, appears to be the most concentrated in
the centre of the primordium and to a lesser degree in the surrounding
interface between the primordium and core areas (Figure 11). EDS spectra
collected from these regions, denoted in Figure 11, suggest the formation of
several chemical gradients. In region 2, located in the central primordium,
3.3% Mn by weight is observed, while no Mn was detected in regions 5, 8 and
9, which are located outside the primordium. Additionally, regions 6 and 7,
analyzed within the interface region between the primordium and the otolith
core, had an average of 0.67% Mn by weight. A summary of the weight and
2.4 DISCUSSION
These findings agree with those of previous otolith microchemistry
studies, which detected Mn peaks within the centre of otolith cores of various
species (BROPHY et al., 2 0 0 4 ; MELANCON et al., 2 0 0 8 ; RUTTENBERG et al.,
2 0 0 5 ) . This study, however, further constrains the localization of Mn on the
nano-scale by identifying Mn peak concentrations first to be concentrated
within primordia, via SEM-EDS, then to the core-primordia interface and
central primordia region via STEM. Due to thickness of the sample it was not
possible to acquire the highest resolution TEM images possible, which would
provide greater nano-scale insight into the localization of Mn within the otolith
primordia. In addition, it is also unclear the effects that storage time may have
had on the organic content and localization of Mn within the otolith. Future
studies should attempt to obtain thinner sections, approximately 100 to 150
nm thick, in order to obtain more nano-scale chemical data. A positive
correlation between increased concentrations of Mn in the embryo and
healthy development and growth processes has been observed in several
species (ERWAY et al., 1 9 7 1 ; ERWAY et al., 1 9 8 6 ; HORI and IWASAKI, 1 9 7 6 ) .
Studies of Mn deficiencies in mice, rats, guinea pigs, and chicks showed
deficiency led to several severe otoconial defects, such as a reduction in size,
or absence altogether (ERWAY et al., 1 9 7 1 ; ERWAY et al., 1 9 8 6 ) . It is possible,
based on evidence from this study, that the presence of Mn is vital for early
previous findings that indicate the preferential incorporation of Mn into the
pre-hatch otolith is primarily facilitated by the mother or due to early
developmental requirements (maternal associations), rather than as a result
of environmental influences (MELANCON et al., 2008). These data suggest
that the otolith core and primordia are not chemically, structurally, or
mechanistically uniform. Reconstructions of life history and natal habitats of
fish using otolith chemistry must be conducted with knowledge of the
incongruencies between the pre- and post-hatch otolith, and the preferential
incorporation of Mn during early development in the otolith. A FIB, in
conjunction with high-resolution methods such as HRTEM, or perhaps
synchrotron, provides a bridge to the nanoscale, allowing researchers to