University of Windsor University of Windsor
Scholarship at UWindsor
Scholarship at UWindsor
Electronic Theses and Dissertations Theses, Dissertations, and Major Papers
2012
A Petri-Net Based Approach of Software Visualization for
A Petri-Net Based Approach of Software Visualization for
Software Customization
Software Customization
Vida Sadri
University of Windsor
Follow this and additional works at: https://scholar.uwindsor.ca/etd
Recommended Citation Recommended Citation
Sadri, Vida, "A Petri-Net Based Approach of Software Visualization for Software Customization" (2012). Electronic Theses and Dissertations. 5409.
https://scholar.uwindsor.ca/etd/5409
This online database contains the full-text of PhD dissertations and Masters’ theses of University of Windsor students from 1954 forward. These documents are made available for personal study and research purposes only, in accordance with the Canadian Copyright Act and the Creative Commons license—CC BY-NC-ND (Attribution, Non-Commercial, No Derivative Works). Under this license, works must always be attributed to the copyright holder (original author), cannot be used for any commercial purposes, and may not be altered. Any other use would require the permission of the copyright holder. Students may inquire about withdrawing their dissertation and/or thesis from this database. For additional inquiries, please contact the repository administrator via email
A Petri-Net Based Approach of Software Visualization for Software
Customization
by
Vida Sadri
A Thesis
Submitted to the Faculty of Graduate Studies through the School of Computer Science in Partial Fulfillment of the Requirements for
the Degree of Master of Science at the University of Windsor
Windsor, ON, Canada
2012
A Petri-Net Based Approach of Software Visualization for Software Customization
by
Vida Sadri
APPROVED BY:
______________________________________________ External Reader
Dr. Gokul Bhandari Odette School of Business
______________________________________________ Internal Reader
Dr. Luis Rueda School of Computer Science
______________________________________________ Advisors
Dr. Jessica Chen Dr. Xiaobou Yuan School of Computer Science
______________________________________________ Chair of Defense
iii
DECLARATION OF ORIGINALITY
I hereby certify that I am the sole author of this thesis and that no part of this
thesis has been published or submitted for publication.
I certify that, to the best of my knowledge, my thesis does not infringe upon
anyone’s copyright nor violate any proprietary rights and that any ideas, techniques,
quotations, or any other material from the work of other people included in my thesis,
published or otherwise, are fully acknowledged in accordance with the standard
referencing practices. Furthermore, to the extent that I have included copyrighted
material that surpasses the bounds of fair dealing within the meaning of the Canada
Copyright Act, I certify that I have obtained a written permission from the copyright
owner(s) to include such material(s) in my thesis and have included copies of such
copyright clearances to my appendix.
I declare that this is a true copy of my thesis, including any final revisions, as
approved by my thesis committee and the Graduate Studies office, and that this thesis has
iv ABSTRACT
Different from the traditional approach of software development from scratch,
Software Product Line (SPL) allows software customization. When further supported by
Service-Oriented Architecture (SOA), SPL offers unprecedented advantages for reusing
software artifacts in mass customization of software applications, leading to radically
reduced time, cost, and effort of software development. Accordingly, an interactive
dialogue-based system for ontology-based requirement elicitation has been developed
previously, in our research group, by Zhang [19].
This thesis works on enhancement of the prior work by introducing software
visualization to the process of interactive requirement elicitation. A research was
conducted for choosing the most suitable visualization method for the existing text-based
software. For this purpose, a layered structure for SOA visualization with support of Petri
Nets is chosen. Accordingly, this method was implemented and a usability study was
done to validate improvements in comprehension of the end-user in visualized version
v DEDICATION
vi
ACKNOWLEDGEMENTS
My ultimate gratitude goes to my supervisors, Dr. Xiaobu Yuan and Dr. Jessica
Chen, for their continuous advise and support throughout my thesis. Their insightful
feedback and instructions made it possible for me to accomplish this work.
I would like to acknowledge Dr. Luis Rueda and Dr. Gokoul Bhandari whose
suggestions and recommendations greatly improved the quality of this work.
My special thanks goes to my parents and my family for their patience and love
they provided to me during all times.
I express my deep appreciation to my friend Navid, for his encouragement,
motivation and moral support he provided during all stages of my higher education. He
made this work so meaningful to me.
Many thanks to my good friends Ahmad Tavakoli and Ali Karaki for their
valuable and helpful ideas on this work.
I would like to thank students of Computer Science and Business departments
who participated in the study of my thesis. I am deeply grateful for the time and effort
vii
TABLE OF CONTENTS
DECLARATION OF ORIGINALITY ... iii
ABSTRACT ... iv
DEDICATION ...v
ACKNOWLEDGEMENTS ... vi
LIST OF TABLES ... ix
LIST OF FIGURES ...x
CHAPTER I. INTRODUCTION ... 1
1.1. Introduction ...1
1.2. Problem Statement ...2
1.3. Contribution ...3
1.4. Structure of the Thesis ...4
II. SOFTWARE CUSTOMIZATION ... 5
2.1. Software Product Line ...5
2.2. Service Oriented Architecture ...6
2.3. Integration ...7
2.4. Requirement Elicitation ...9
III. SOFTWARE VISUALIZATION ... 15
3.1. Software Visualization ...15
3.2. Software visualization techniques analysis ...17
3.3. Petri-Nets ...20
IV. PROPOSED PETRI-NET BASED SOA VISUALIZATION METHOD ... 23
4.1. Introduction ...23
4.2. The structure of the proposed method ...24
4.3. Modified Algorithm ...26
V. IMPLEMENTATION AND USABILITY STUDY ... 32
viii
5.2. Usability Study ...33
5.3.Proposed Usability testing Method ... 37
VI. RESULTS ... 39
6.1. Briefing ...39
6.2. Requested Tasks ...40
6.3. Scores ...42
6.4. Time ...43
6.5. Questionnarie ...44
6.5.1. Learnability ...44
6.5.1.1 Easiness ...44
6.5.1.2 Undrestandability ...45
6.5.2. Efficiency ...47
6.5.3. Error-rate ...48
6.5.4. User Satisfaction ...51
6.6. Necessity ...52
6.7. Problems ...53
6.8. Overall Opinion ...56
VII. CONCLUSION AND FUTURE WORK ... 60
7.1. Conclusion ...60
7.2. Future Work ...61
APPENDICES ... 62
Appendix A ...62
Appendix A1 ...63
Appendix A2 ...64
Appendix B ...65
Appendix B1 ...65
Appendix B2 ...66
REFERENCES ...67
ix LIST OF TABLES
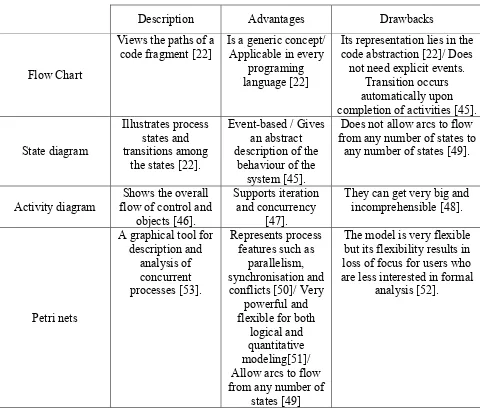
1. Comparison of different workflow visualization techniques ...19
2. Distribution of participants in the test according to their academic level ...39
3. Statistical parameters for the sample populations ...42
4. Easiness and understanding points for different groups ...47
5. Average results for Text-based and visualized interfaces ...57
x LIST OF FIGURES
1. Requirement model instantiated with book locating service ...14
2. An example of a Petri net ...21
3. Different routings in Petri nets ...22
4. Architecture of the modified system ...24
5. The text-based user interface ...26
6. The enhanced text-based system with the graphical interface ...27
7. The modified pseudo code of the system ...30
8. Comparison of average Easiness point to average Score ...45
9. Comparison of Easiness point to the estimated Understandability point ...46
10.Comparison of Efficiency between different groups ...48
11.Comparison of users’ actual rate with claimed relation of users’ error-making and interface ...50
12.User overall satisfaction of the system for different groups ...51
13.Necessity (percentage) of visualization according to users (graphical group) ...53
14.Percentage of users that acknowledged problems (a, b and c) for text-based system ...54
15.Percentage of users that acknowledged problems (a, b and c) for graphical system ...55
1 CHAPTER I
INTRODUCTION
1.1. Introduction
In software development process there is a need to cut down the cost, effort and
market of software products. The size and complexity of software systems are increasing
day by day and it is essential that the developed software be flexible enough to adapt to
market changes and new technologies [1]. Therefore, improving reusability and hence
quality will increase the productivity of software teams and reduce the time and cost to
market new software products. Product assembly from components, reducing labour
intensive tasks with automation setting up the software product lines and supply chains
and standardizing the interfaces, architectures and processes can bring the software
industry to a much higher productivity [2]. This can be done by Software Product Line,
which produces a set of distinct but similar products, and Service Oriented Architecture,
which solve the integration and interoperability problems, together. They both promise
the development of flexible, cost-effective and reusable software systems [3].
On the other hand, to make the process of software development less complex and
more understandable for software developers it is essential to use some tools for
supporting the tasks which are included in software development process specially for the
most curtail phase which is the requirement elicitation phase. One possible aspect for
such a support is Software Visualization (SV). Recently so many software visualization
techniques and tools are available but it is critical to choose the most suitable one for a
suitable activity in software development process to do the most effective visualization
2 1.2. Problem Statement
It is discussed in many papers [1, 2, 5, 6, 7], that when SOA concept is used in
Software Product Line, it will make a mass customization of software application by
reusing software artefacts which can be very beneficial, specially time-wise and
effort-wise. Based on this fact, beforehand, an interactive text-based dialogue interface has been
developed in our research group [19], which interacts with the user who wants to do
software development, in natural language and does the requirement elicitation process
automatically based on the ontology behind it. The ontology represents the knowledge of
the product features as well as their business logic. It represents the commonalities and
variabilities among a group of related artefacts and in this way it directs the dialogue
system to perform requirement elicitation [19].
The problem here is, the mentioned idea seems beneficial in theory but it is not
proved that its usage in industry can be advantageous or not. It is needed to be evaluated
in practice on different real users, to be formally certified as an applicable, usable
technique.
On the other hand, the text-based dialogue system can be enhanced. The software
developer needs to have an overall overview of the system that the text-based system
lacks in having this feature. Also, the user needs to know what steps are already done and
what steps are left. Reading all long comments on the dialogue system and understating
all of them and keeping them all in mind in order to do software development can be a
tough and time consuming job. This process will need several activities such as reading,
reasoning and constructing mental models. Consequently, there is a need for a more
optimal solution.
3
used in different phases of the process of software development. Based on [31] graphical
representation of information comparing to other presentation methods consumes user’s
information-processing capabilities much more efficiently. If the graphic presentation is
used properly, it reduces the need for mental information recording and reorganization
and also it decreases the memory load. On the other hand, the interaction between human
and the machine would be much faster and simpler and on the whole appealing for the
users [31]. Therefore, different software visualization techniques should be studied and
the best one for this type of system should be chosen. The chosen, proposed method can
be implemented as an additional user-interface.
At the end, another evaluation should be conducted in order to justify the usability
of the visualized part of the project to prove if it really enhances the comprehension of
the system for the users and even advances in usability factors which are, learnability,
efficiency, error rate and user satisfaction should be investigated.
1.3. Contribution
This thesis, presents a visualized user-interface for the implemented
dialogue-based, interactive requirement elicitation system, with the purpose of enhancing the
understanding of the user of the dialogue system and reducing time, cost and effort spent
on working with the previous system and in overall increasing the usability of the system.
Because both dynamic flow and concurrency of the distributed services was aimed to be
illustrated in the graphical visualization, a two layered interface which shows both
services in one layer and the workflow of the system in another system have been chosen.
For visualizing the workflow layer, Petri-net, which is a very well known formalism for
4
most suitable technique for designing the visualization of this type of system.
Both, previous text-based system and the proposed, implemented system with the
graphical user interface should be evaluated for justification of, first of all, if the
ontology-based requirement elicitation approach is acceptable by real users and second, if
the graphical user interface improves the usability of the previous text-based system.
Therefore, a usability study will be conducted at the end on real users to see if all the
expected benefits will be met or not.
1.4. Structure Of the Thesis
The structure of the remainder of this thesis is as follows. Chapter II is about
Software Customization, which SPL and SOA concepts will be discussed in detain in this
chapter. In Chapter III, Software Visualization will be discussed. Chapter IV will report
the proposed Petri Net visualization method followed by implantation and usability
testing and the results of the thesis in chapter V. The final chapter of this thesis puts this
project into perspective, by discussing the major results and their impact, and by
5 CHAPTER II
SOFTWARE CUSTOMIZATION
2.1. Software Product Line
Traditionally, the software used to be applied on products was very small and
simple. In order to modify and produce a new product, it used to be much easier and
cheaper to copy, transport or replace the software than the hardware. The main focus of
generating a product was on the hardware and software did not used to play a key role in
product generation [8].
However, now, software plays a very critical role in any system. The reason for
that is the flexibility of software in modifying the system and also software’s strength in
adding a new functionality to the system, which perhaps it would be difficult to be
performed without it and only by means of modifying the hardware. Therefore, in order
to make the system production’s process much more efficient, the concept of Software
Product Line Engineering will be addressed [8].
Software Product line is a paradigm to develop software applications and software
products, by building reusable parts and reusing them. For this purpose mass
customization is being used which means large production of goods with taking into
account the customer’s individual requirements. For this purpose, we should focus on
commonalities and differences in the applications (in terms of requirements, architecture,
components and test artifacts) of the product line to be modeled in a common way [8]. By
using SPL, some advantages can be gained such as reduction of development cost and
time, enhancement of quality, coping with evolution and complexity and etc [8].
6 Engineering and Application Engineering.
Domain Engineering establishes a platform and defines commonalities and
variabilities of the product line. Our main focus in this thesis is on domain engineering
process [8].
Application Engineering derives the application from the platform, which is built
by domain engineering [8].
Although lots of research has been conducted on benefits of using Software
Product Lines for software development and how to scope and define and develop
product lines but only few approaches and tools are available for product derivation and
the way utilize the product line [9].
Another concept that currently gets a lot of attention in researches and in many
papers is brought with the concept of SPL is Service Oriented Architecture. In some
research papers [1, 2, 5, 6, 7] it is discussed about combining SPL and SOA together to
improve the practical value of SPL, to make the software development process more
efficient and to improve the quality of the developed software. It is believed that this
combination can decrease development costs and effort, improve time to market,
application customized to specific customers or market segment needs and competitive
advantages [1]. The reasons for these claims will be discussed later.
2.2. Service Oriented Architecture
“Service Oriented Architecture is an information technology architectural
approach that supports the creation of business processes from functional units defined as
services” [10].
7
services, which are shared and reusable on an IT network and they communicate with
each other. This communication can either be held by data passing between services or
by coordination of two or more services for doing a common activity [11].
The basic SOA is based on interaction between three software agents, which are
called service provider, service consumer and service registry. The three operations,
which are being conducted in this architecture, are find, bind and publish. Service
provider develops and publishes services’ descriptions and their access information in
service registry. Service requester tries to find the most suitable service in the service
registry and by means of available access information in service registry, will bind the
required service to the service provider to invoke required services [12]. SOA is both a
business strategy and a software architectural principle [39].
Service Oriented Architecture is a rapid, low cost and easy composition of
distributed applications, which is the best paradigm to minimize business environment
complexity and maximize the productivity [6].
The advantages of service orientation are loose coupling, abstraction and
reusability of business functionalities [13].
2.3. Integration
However, SOA lacks in supporting high customization and systematic planned
reuse. It means that it is possible to use certain services for software development but if
any changes happen to the order or participants of service composition services, which
are not designed to be highly customizable and reusable, would not support variability.
Thus SPL engineering, which basically has the principle of variability, customization and
8
these benefits [1]. Furthermore, the integration of SPL and SOA concepts give the ability
of reusing existing services instead of continuously developing them from scratch [44].
As a conclusion for this part the concepts of SPL and SOA are in no way mutually
9 2.4. Requirement Elicitation
Traditionally the process of software development used to have little or no
dependency on business processes. Programmers used to sit and write a code, which is
supposed to be useful. But this method will not be useful for the larger and more complex
systems. Therefore the system life cycle has been broken into smaller parts, which are
called phases. Requirement engineering is the earliest phase in this process, which is
typically proceeded by business planning [14].
“Requirements Engineering (RE) is the systematic process of developing
requirements through an iterative cooperative process of analyzing a problem,
documenting the resulting observations in a variety of representation formats, and
checking the accuracy of the understanding gained.” [15].
One of the essential tasks of RE during software engineering is Requirement
Elicitation. Researches show that a major cause of problems in software projects is
inadequate requirement engineering [8]. Consequently, the basic prerequisite of software
product line, which is a software developments paradigm, is requirement elicitation
process, which shows the commonalities and differences of the requirements [8].
There are different techniques that can be used for requirement elicitation. These
techniques are either conversational which is mainly conducted by interviews with two or
more people, observational which can be done by observing people when they are
carrying out their routine job, analytic which means exploring existing documentation or
knowledge gained from either conversation or observation and synthetic which is
combining conversation, observation and analytic methods into a single method. In
10
In [17] it is mentioned that useful, useable and desirable software products are
created using interaction design. Software developers do not benefit from interaction
design though. The tools that software developers use for developing are insufficient and
not appealing for them. Although the importance of using Human-Computer Interaction
(HCI) concept in Software Development Process (SDP) is not very clear for many
software developers, HCI experts have been tried to show that the integration between
these two, can cause better user satisfaction derived from a user-centered SDP [18].
However, conducting an interactive software engineering paradigm is still an issue.
One possible idea is to take advantage of both SOA and SPL concepts. SOA can
be used in order to makes it easier for the software engineers by introducing services as
loosely coupled software functionalities eliminating the lower-level complexity. On the
other hand SPL is useful for managing the variable software engineering. In interactive
software engineering, machines can be used to guide the users to select reusable software
assets and implementing the candidate application by composing the ordered services
[19].
The previous thesis from the same research group, which has been conducted by
Zhang [19], is titled as “An Interactive Approach of Ontology-Based Requirement
Elicitation”. In that project a requirement elicitation approach has been proposed for
SOA-based SPL engineering as a programming model for realizing the interactive
requirement engineering [19].
The proposed interactive model is a dialogue-based system, which interacts with
users in a natural language. The way dialogue system works is, it extracts and analyses
11
generates an expression in a natural langue for the user accordingly. Therefore, dialogue
system can be a convenient way for human-machine interaction.
In the previous proposed dialogue system, slot-filling tasks is considered for the
requirement elicitation process, in which the user knows about the goals and has the
information about doing the task. These tasks will be done based on knowledge base of
the dialogue system. It is claimed in the previous proposed dialogue system that
ontology-based requirement engineering is the most popular technique among all the
other knowledge-driven requirement engineering techniques. Ontology represents the
common knowledge within a domain. It means that it provides shared vocabulary to
construct the concepts, objects and their properties and relations of a domain or a task,
which can cause common understanding of the structure of information between people
or software agents [40]. By using ontology, the common concepts of a domain can be
defined by experts and the knowledge can be used by people with any background and
without professional training [19].
To develop ontology, the concepts in the domain should be defined, and a
hierarchical order should be arranged between them. The slots and the allowed clauses
for those slots also should be defined. At the end the instances and the values for slots of
instances should be filled [41].
The model developed in the previous project, integrates the requirement
engineering knowledge with service-oriented knowledge. Since SOA encapsulates
application functionalities into loosely coupled services, software applications can be
implemented by discovering, composing and invoking services in SOA. The ontology of
12
there exists a class called ServiceProfile, which contains the characteristics of services
and is used to match with the client’s requests. It happens in this way that for the reason
of discovering services, the ServiceProfile of the requestor automatically will be matched
with the provider’s ServiceProfile through semantic capability matching [43] and if the
matching succeeds the desired services are found.
In the domain of requirement elicitation the requirements can be classified into
three categories of function, quality and softgoal. Each of these categories have different
roles in the system and also for all of them another factor called rank is defined which is
needed to direct the requirement elicitation process and is expressed in the ontology
model. Functions are the functionalities in the system that the user can order. Quality is a
non-functional constraint that imposed on a function. Softgoals are non-functional
constraints impose on the whole system environment. In between each of these three
types of requirements, some relationships exist such as generalize, decompose, rely,
contradict, associate, hasRank and invalid. These relationships will be discussed briefly
as follows[19]:
• Generalize relationship is defined to show that an instance of function, quality and
Softgoal is also an instance of requirement.
• When requirement ! decomposes to y, y is a less complex requirement of the
same type as x.
• Requirement x relies on requirement y it means that realization x relies on
implementation of y.
• When requirement x and requirement y contradict it means they are not supposed
13
• Function x associates with quality y.
• HasRank relationship shows that requirement x has a unique rank r.
• Invalid relation ship shows that there is an invalid relationship between
requirements x and y.
For instantiating the ontology model, first all the these relationships should be
established between the available requirements and the following procedure will show
the instantiation of the ontology [19]:
1. The main functions which are the roots of the decomposition tree will be
identified
2. If any children of the root contribute to the composition with their parent, they
should be decomposed by the Decompose relationship and if the children of
children are also decomposable the same story should be repeated on them till
there is no composition between parents and children.
3. All the quality constraints should be found and the associate relationship
between children and the corresponding function should be established
4. Sofgoals should be identified and decomposed.
5. Rely and contradict relationships should be established
6. A rank should be assigned to each of the requirements based on their
importance.
14
Figure 2.1. Requirement model instantiated with book locating service [19]
The way the interactive requirement elicitation works is a follows:
The requirements will be offered to the user one by one based on the rank is assigned to
them and the user should choose from them. If the requirement is essential it will be
picked automatically and regardless user’s opinion. The functions will be evaluated first
and after that all the qualities and evaluation of softgoals will be followed. All the
requirements will be met by the dialogue system. If the user decides to drop a
requirement the requirement which has the rely relation ship with that requirement will
be dropped as well. If a requirement decided to be picked by the user and another
requirement has the contradict relationship with that requirement will be dropped and the
requirement with the rely relationship will be picked as well [19].
15 CHAPTER III
SOFTWARE VISUALIZATION
3.1. Software Visualization
Software visualization means providing the image of existing software using
visual objects. Software visualization might visualize different aspects of the software,
such as software structure, components and even the runtime behavior of the software. It
is proven that appropriate visualization can significantly reduce the effort spent on
different phases of software development. By means of visualization, developers and
stakeholders can obtain an overall point of view of the software structure, software logic
or explain and communicate with the development process [4]. Generally, software
visualization is mainly used for program behavior exhibition, logical debugging and
performance debugging but it fundamentally is concerned with software comprehension
[20]. By providing a good graphical representation in order to visualize the software, a
better user understanding of the system can be more promising than textual representation
of the software [21].
By graphical presentation of information the capabilities of user’s information
processing would be utilized much more effectively than other presentation methods. If a
suitable graphical representation tool is chosen properly, there would be less need for
perceptual and mental information recording and it would reduces the memory loads. By
providing graphical interfaces, there would be a faster information transfer between
computer and people. Because it has been proven that symbols can be recognized and
classified faster and more precise than text by users. Also, because of its simplicity,
16
control to users when they can see objects on the screen. In overall graphical
visualization can provide so many other benefits faster learning, faster use and problem
solving, more charming and etc. [31].
There are so many software visualization tools and techniques available [4].
Visualization techniques consist of collection of elements such as points, lines, shapes,
texts and textures which each of these elements illustrates an entity or an attribute from a
dataset, which is going to be visualized. In some cases more than one visualization
technique can be applied for a system [22].
Software visualization techniques can be categorized from motion perspective
into two groups of static and dynamic visualization. An example of static visualization is
view of the source code with colors [20]. Dynamic visualization is based on information
from the analysis of execution of a program [22] and the data generated at the runtime
such as data flow or control flow [20].
With regard to dimension, visualization can have either two or three dimensions.
Two-dimensional SV tools mainly involve graph or treelike representations, which may
contain many nodes and arcs [23]. For some systems with too much information to be
visualized, using two-dimensional technique may cause confusion. Therefore, in some
papers the need of extra spatial dimension is suggested, which may make it more possible
for the designer to describe more aspects of the system [23].
To choose the best visualization technique for the existing software, first of all,
the reason and goal of the visualization should be clear. Then the group of users and their
level of knowledge and experience with computer systems should be defined. Also, all
17
should be detected and it should be decided that what aspects of the system are going to
be presented. The usages and limitations of the existing system, which is going to be
visualized, should also be investigated [20]. On the other hand the current software
visualization techniques need to be evaluated. At the end the technique that mostly meet
the requirements of the system will be chosen and would be implemented.
3.2. Software Visualization Techniques Analysis
The main reason for this visualization is to make the text-based system
comprehensible for users. In this case, users would spend less time to have a more clear
and precise point of view of the system. It will happen in this way that instead of reading
the comments and memorizing the structure of the system, users will see the flow of the
system dynamically while working with the text-based system and have an overview of
the system in a big scale in front of them. The dialogue-based software is used in
requirement elicitation phase of software development process. Therefore the main group
of people who are going to take advantage of this visualization should be software
developers. However, it is a good idea to make it also easy for people with business
background to use this software in order to develop their required systems by themselves.
In this thesis, the main focus is to limit the visualization to the people with computer
background specially software developers. It is a difficult job to keep both groups with
diverse expectations from the system satisfied. The system has been tried to be designed
in a way that, working with it, be as easy as possible even for people with no specific
experience in working with computers. Usability testing will validate how useable the
18
Furthermore, since the system is SOA-based in many papers [1, 27, 28, 10, 29] it
is discussed that the appropriate approach for SOA visualization is a layered approach
because the concept of SOA has a layered structure. It is one of the SOA’s advantages
that multiple perspectives within an organization can be taken into account [30] since
basically SOA consists of both technical and functional aspects. Functional perspective is
mostly related to business people while technical perspective deals mostly with IT
people. In order to make it understandable for both groups of users, an SOA based system
should be visualized in a way to demonstrate both aspects. In the first layer, the flow of
the activities, which are being processed in the system, can be shown. The next layer can
visualize the services and the relationships between them. Even more layers such as
application layer which shows the implementation of the functionalities provided by
services in the service layer in more details, can be used depending on the level of
abstraction and the type of users [27].
Consequently, the required visualization method should be dynamic in order to
show the flow of the system. Also, because in some parts of the system some services
have the same rank to be evaluated the chosen visualization technique should be able to
show the concurrency and parallelism. Because SOA is used in this system, then it should
provide a layered design for visualization. For choosing the number of dimensions for the
system, both two and three-dimensional can be chosen depending on the level of details
needed to be illustrated. The main objects, which should be visualized, are few tasks such
as Evaluation, Pre-Evaluation, Picking (Yes) and Abandoning (No), that are repeatedly
being performed in the system. There is a flow in the system, which shows the order of
19
existing services, which are the very requirements that are going to be elicited, should be
depicted.
Many graphical visualization techniques exist that can depict the concept and the
workflow of the interactive requirement elicitation system. As it is mentioned, the
workflow process determines that which tasks need to be executed in which order and by
whom [26]. A list of some of the most popular and suitable techniques, which can be
used to visualize the workflow of software systems along with their advantages and
limitations, is shown in Table 3.1.
Description Advantages Drawbacks
Flow Chart
Views the paths of a
code fragment [22] Is a generic concept/ Applicable in every programing language [22]
Its representation lies in the code abstraction [22]/ Does not need explicit events.
Transition occurs automatically upon completion of activities [45].
State diagram
Illustrates process states and transitions among
the states [22].
Event-based / Gives an abstract description of the
behaviour of the system [45].
Does not allow arcs to flow from any number of states to
any number of states [49].
Activity diagram flow of control and Shows the overall objects [46].
Supports iteration and concurrency
[47].
They can get very big and incomprehensible [48].
Petri nets
A graphical tool for description and
analysis of concurrent processes [53].
Represents process features such as
parallelism, synchronisation and conflicts [50]/ Very
powerful and flexible for both
logical and quantitative modeling[51]/ Allow arcs to flow from any number of
states [49]
The model is very flexible but its flexibility results in loss of focus for users who are less interested in formal
analysis [52].
20
After reviewing all the mentioned visualization techniques in table 3.1, it can be
concluded that the most suitable technique, which is both appropriate for visualizing the
workflow of the system as well as illustrating concurrency of the tasks, is petri net. In the
rest of this chapter more details about petri-nets will be addressed and different aspects of
applying it as a graphical visualization technique for the text-based system will be
discussed.
3.3. Petri Nets
“Petri nets are used to construct a formal model for a Graphical User Interface
(GUI). Petri net is a type of visual communication tool same as flow chart or other
software development diagrams but the main advantage of petri net is, it can be used to
analyze and simulate the concurrent and dynamic activities of systems” [24].
Petri nets are a very well known formalism technique for demonstrating the
workflow behavior of the system. Petri-net for the first time was presented by C.A.Petri
in 1962 and since then lots of researches focused on petri nets. The ability to clearly
represent the concurrency related concerns like parallelism, synchronization and etc. in a
graphical way is one of the best advantages of petri nets. [25].
Petri-net is a special type of directed graph with the initial marking !! and two
types of nodes called places and transition, which are illustrated by circles and rectangles
respectively. An arc will connect each place to a transition and each transition to a place.
A marking is assigned to each place demonstrates the number of tokens existing in that
place. If marking of a place is zero, it means that place is empty.
There are some rules, which are known as firing rues and are applicable to a
21
1. A transition t is called enabled when there is at least one token in each input
place p of t.
2. An enabled transition t will be fired when its associated event occurs.
3. The firing of enabled transition t removes one token from each input place p
of t and adds one token to each output place p of t [24].
A petri net is a 3-tuple <P, T, W> where:
• ! ={!1,!2,!3,…,!"} is a finite set of places
• ! = {!1,!2,!3,…,!"} is a finite set of transitions
• ! ⊆ (! × !)∪(! × !) is a set of arcs from a place to a transition or from a
transition to a place (flow relationship) [24].
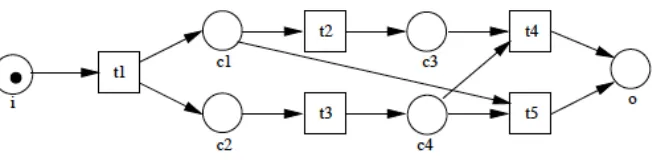
Figure 3.1 depicts a sample of Petri net.
Figure 3.1. An example of a Petri net [26]
Several reasons exist for using Petri nets for workflow modeling. Some of these
reasons are as follows:
• Formal semantics: Because the semantic of the Petri net has been defined
formally, a workflow process specified in terms of a petri net has a clear and
22
• Graphical nature: Because Petri net is a graphical language, it is very easy to
understand and very suitable to use as a visualization tool for communicating with
the end-users.
• Expressiveness: Petri net has got all the primitive requirements to model a
workflow process.
• Vendor independent: Petri net is a tool-independent framework for modeling and
analysing processes [26].
Some of the workflow routing constructs, which are needed to be represented in
this system, are sequential routing, parallel routing and conditional routing. In sequential
routing, tasks are executed sequentially if the execution of one task should happen after
execution of the previous task. In parallel routing two tasks should be executed at the
same time or in any order. In conditional routing, one task will be executed between two
or more alternatives. It depends on the decision made by the system [26]. All these
routings are shown in Figure 3.2.
Figure 3.2. Different routings in Petri nets [26]
23 CHAPTER IV
PROPOSED PETRI-NET BASED SOA VISUALIZATION METHOD
4.1. Introduction
Previously, in the prior work was conducted by Zhang [19] a dialogue-based
system was developed. It automates the requirement engineering process. It manages the
knowledge related to SPL requirement engineering by defining an ontology for the
system and also it generates service-oriented outputs for the automation of system
implementation. In this system some questions such as whether the user needs a specific
requirement is generated and the user will respond to these questions. At the end, based
on the services the user has ordered, the system generates a service discovery and
composition.
An improvement that can be applied on this dialogue-based system is graphical
visualization of the behavior of the system. A petri-net based SOA visualization is
presented in this thesis, which visualizes the dialogue-based interactive requirement
elicitation system. It is used for eliciting user’s requirements based on human-machine
interaction. As it is mentioned in the previous chapter, for SOA visualization, layered
approach can be the most promising for better understanding, because, it can illustrate the
structure and the concept of the SOA-based system much more precise.
For this reason, this proposed visualization method shows the
requirements/services on the background as the on the service layer and on the top of
them there is a petri-net, which shows the flow of the dialogue system which is on the
business layer. Because the visualization is decided to be two-dimensional the business
24
the services on the service layer. In order to apply this idea, this design should be altered
to a three-dimensional plan instead of a two-dimensional. But there is a risk of
complexity increment that can cause comprehension decline. The goal of this
visualization is to give the user, which is mainly a software developer, a better
understanding of the system under development in order to save time, energy and cost.
4.2. The Structure Of The Proposed Method
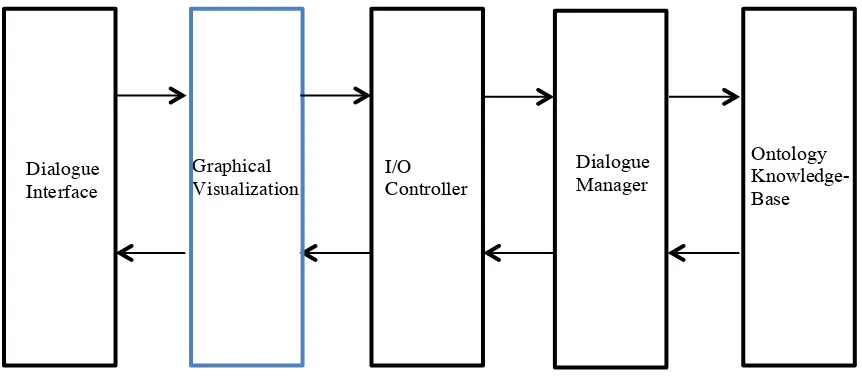
The visualization should somehow be included as a part of the dialogue system.
The frame-based dialogue system designed in the previous research consists of four
components: Interface, I/O controller, Dialogue manager and Knowledge base. The
visualization component will be added between interface and I/O controller Figure 4.1.
Figure 4.1. Architecture of the modified system
It works in this way that, the dialogue interface will display the questions
generated by the machine and the user will respond in the provided slot on the interface.
In the previous system the answer used to go directly to the I/O controller to be matched Dialogue
Interface
I/O Controller Graphical
Visualization
Dialogue Manager
25
with the predetermined answers in the system Figure 4.2. This time in the new system
with graphical user interface, the answer will be passed to the visualization component
and then to the I/O controller. It means that all the inputs and outputs of the system
should pass through the visualization component at least once. If the user’s answer
matches with the saved answer options in the system, it will pass to the next stage which
is the dialogue manager otherwise the user will be asked to enter the correct answer. The
user’s answer will be converted to the format processable for the machine and will be
passed to the dialogue manager. The dialogue manager will consult the ontology
knowledge base and will generate an answer subsequently. This answer will be passed to
the I/O controller and visualization components and the user can read the answer in the
dialogue interface and also observes the changes occur in the system on the graphical
interface. These changes will be shown by token moves and color changes in the petri-net
26
Figure 4.2. The text-based user interface [19]
4.3. A Modified Algorithm
As is mentioned in previous section, there will be two user interfaces. One is
text-based and the other one is the graphical representation of what is happening in the
requirement elicitation process. As it is shown in Figure 4.3, all the services, which are
being used as the requirements of the software system, are being shown on the
27
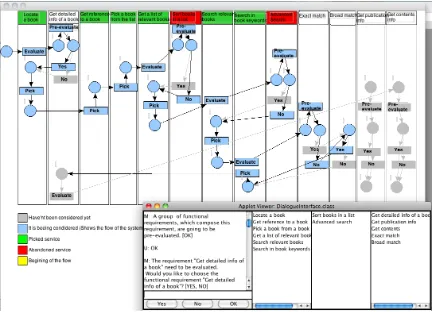
Figure 4.3. The enhanced text-based system with the graphical interface
This design meets the qualifications of the SOA visualization. Regarding to many
papers [27, 28, 10, 29], a suitable visualization for SOA systems is a layered design,
which in this case the graphical interface, demonstrates a somehow layered approach. It
has got two layers, which are service layer in the background, and business layer on the
top of service layer. Since the design decided to be two-dimensional, therefore these two
layers overlap. To emphasize what is happening in the visualization in the beginning, all
the services and the petri-net on the top are in a faded color. As the dialogue interface
goes on, the color of each service, which is being evaluated by the system or the user will
be highlighted. Based on the petri-net rules whenever a transition’s associated event
occurs that transition will fire. Thus, regarding dialogue manager’s decision a change in
28
its output arc will turn to blue. In this way, the user can follow up the workflow of the
system and he will know which step he is in. So that, all the traversed path will be in blue
and all the remained paths will be faded. Similarly, all the selected or dropped services,
either by user’s decision or by ontology knowledge base will be turned to green or red
respectively after each picking or abundance. The pseudo code of this system is shown in
Figure 4.4. In this code, all the black lines are from the previous system and blue lines are
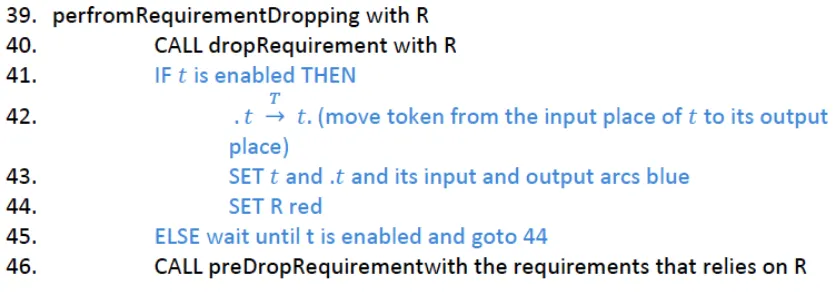
30
Figure 4.4. The modified pseudo code of the system
Here is the explanation of the above algorithm. The following cases may happen in the
system.
1. If requirement R is essential to the system, PerformRequirementSelecting will be
called.
2. Task t will be set as “Pick” in the graphical interface and requirement R in the
service layer will turn green.
3. If the requirement R is non-essential and pre-selected,
PerformRequiremnetSelecting will be called.
4. Tasks t will be labeled as “Evaluate”.
5. If the requirement R is non-essential and pre-dropped,
preformRequirementDropping will be called.
6. If the requirement R is non-essential and has not been selected or
pre-dropped, evaluateRequirement will be called to have R evaluated by users. Then if
users choose to select R, actions for selecting a requirement will be performed.
Otherwise, actions for dropping a requirement will be performed. In the graphical
interface if the answer of the user is yes then task t will be labeled as “Yes” and
31
requirement, the label of t will be set as “No” and the requirement on the
background will turn red.
• PerformRequirementSelecting contains SelectRequirement R, which makes R to
be selected in the system, PreSelectRequirement to pre-select the requirements
that relies on R, Pre-DropRequirement to pre-drop the requirements that
contradict with R and PreEvaluateRequirement to pre-evaluate the qualities that
associate with requirement R. In the graphical interface if the labeled task is
enabled, a token will move from the input place to the output place of the labeled
task. Then the task and its corresponding input place and arc and output arc will
turn blue.
• performRequirementDropping contains dropRequirement R, which abandons R
and preDrops the requirements that rely on R. In the graphical interface if the
labeled task is enabled, a token will move from the input place to the output place
of the labeled task. Then the task and its corresponding input place and arc and
32 CHPTER V
IMPLEMENTATION AND USABILITY STUDY
5.1. Implementation
In this thesis graphical interface implementation is done by Java 6.0 on Mac OS X
operating system. For coding and debugging Eclipse IDE (3.6) is being used. A GUI
simulator called “Rakiura JFern” which is a Java-based framework is used to design the
petri-net in the project.
The graphical visualization works along with the modified version of the
text-based system. The user should do software customization by interacting with the
dialogue-based system and checks the flow of the process in the graphical interface. The
whole system is shown in Figure 4.3. As it is illustrated, all the requirements are in some
rectangles in the background of the visualized system and the petri-net is on top of it. As
it is mentioned before, because this visualization is in the category of two-dimensional
visualization, then it seems that these two layers overlay.
Some of the features of the pervious text-based system have been changed based on some
standards in usability engineering. For example, because the answers consist of, “Yes”,
“No” or “OK”, three buttons are added instead of user typing a word in the dialogue
manager, in order to reduce the time and effort for typing and user can accomplish the
task only by clicking by the embedded buttons. Based on [31], button is convenient
operable control, which is used for frequently used actions that are specific to a window.
Another modification to the dialogue-based system was shortening the dialogues.
In [32] it is mentioned that dialogues should be relevant to the users and give them
33
that was mostly suitable for software developers and not ordinary users. Even for
software developers there were so long, repetitive and not very useful. Therefore, the
dialogues were modified in a way to give the users the most brief and important and at
the same time complete information.
The graphical interface is added to the text-based system in order to show the user
the flow of the development process by the text-based system. The basic actions are done
in the ontology of the text-based system are evaluating, pre-evaluating, picking and
selecting or abandoning the services. Actions are represented by transitions. Whenever
each of these actions takes place, the transition related to that task will be fired and the
color of that transition and its input arc and place and its output arc will turn to blue. In
this way the flow of the system will be presented by color changing. Each picked
requirement in the system will turn to green and each abandoned one will turn to red as
soon as the dialogue-based system announces that respectively it has picked or
abandoned that service.
5.2. Usability Study
Usability is a quality characteristic, which evaluates some main attributes during
software development process. It is believed that usability attributes are some accurate
and measureable components of an abstract concept, which is usability [33]. These
attributes are:
• Learnability - How quickly and easily users can perform a productive work with a
new system and how easily they can remember the way the system operates after
not using the system for a while.
34 interval.
• Reliability – The error rate using the system and time it takes to recover from the
errors.
• Satisfaction – The level of user satisfaction after working with the system.
The way that these attributes can be measured is by observing the users while they
are working with the system and have an interview with them after they accomplish a
task with the system [33].
In issues that human interacts with technology, the analytical research paradigm is
not sufficient. Therefore, empirical studies in software engineering are getting more
acceptable continuously [34]. Usability is about how the system interacts with the user
[35]. Usability engineering defines the final usability level and ensures that the software
under usability testing reaches that level [35].
Usability study can be done by different methods. These methods are divided in
two general groups as empirical and analytical methods. In the projects that human
interacts with machines empirical studies are very useful [34]. On the other hand
analytical studies can give early feedback about the design of the interactive system to
software testers. Analytic method consists of two classes of methods, which are usability
inspection and cognitive walkthroughs. Usability inspection, involves systematic
inspection of the design by means of some factors for a practical, good design.
One example of usability inspection method is heuristic evaluation, which is an
informal usability testing method. In this method based on general-purpose design
guidelines the evaluator, will inspect the proposed design in order to check whether the
35
In [36] nine heuristics are proposed: simple and natural dialogue, speak the user’s
language, minimise user memory load, be consistent; provide feedback; provide clearly
marked exits; provide short cuts; good error messages, and prevent errors.
The other method, which is the cognitive walkthroughs uses more explicit, detailed
procedure and conducts a more work-based usability analysis by testing real users when
faced with the system. It analyses the quality of the interface in directing the user to
accomplish a task by asking three simple questions: Will the correct action be made
sufficiently evident to users?; Will users connect the correct action’s description with
what they are trying to achieve?; Will users interpret the system’s response to the chosen
action correctly?. Whenever there is a “no” answer to any of these questions, problems
may occur [36].
A usability engineering model presented by Gould and Lewis and is called
“famous rules”. These rules are: early focus on users, user participation in the design,
Coordination of the different parts of the interface, empirical user testing and iterative
revision of designs based on the test results [37].
For usability engineering there is a term called usability engineering life cycle,
which means not only how the current interface design is satisfying but also whether it is
modifiable for future interface. This life cycle has three stages as follows:
v Predesign stage:
The main goal of this step is to know about the target user and the task he is going
to accomplish. The more it is done in this stage it would be more cost effective for the
whole testing, because most probably the number of changes that should be done in the
future will be reduced.
36
and his exact needs from the system. For example, knowing about user’s work
experience, educational level, age, level of computer experience will help to
anticipate user’s problems and consequently will help to design a better interface
with considering user’s learning difficulties. Also, the weaknesses of the current
system should be found out. It should be clear that in the current system what
obstacles the user has on his way to achieve his goals, or what is making the user
to spend lots of time or makes the user uncomfortable with the system.
2. Setting usability goals: In usability testing, the four usability characteristics
should be met. Obviously for each system the priority of each characteristic
would be different. But on the whole because all of them are related, getting a
good result in any of them can be satisfying.
v Design stage:
The main goal of this phase is to reach a useable implementation that is suitable to
be released. For this reason first, based on the usability principles we have to provide a
prototype of the final system and then test the prototyped system with real users to make
sure the design will meet our goal.
3. User participation in the design.
4. Coordination of the different parts of the interface
5. Empirical user testing: This step is very beneficial and it has two basic forms. The
first one, which is mostly quantitative will check if the usability goal has been
achieved or not and the second one which is more qualitative, the reason of the
parts of the interface which are wrong and the amount of their wrongness will be
37
observation while working with the system and asking questions from the user
about his experience with the system.
6. Iterative revision of design based on the test results: Based on the empirical
testing stage we can redesign the interface and again do the testing on the new
interface.
v Postdesign stage:
This stage is the follow up study of product use in the field. The same task, which
is done in design stage, which was revising the design and retesting it repeatedly, can be
done with the final product with considering the final product as a prototype of future
products [38].
5.3. Proposed Usability Testing Method
Based on what is discussed in usability section of this research, both analytical
and empirical testing has been conducted in this thesis. For analytical testing, a
combination of usability inspection and cognitive walkthroughs methods has been used
along with famous rules, as much as it was applicable and practicable with the available
feasibilities, in different phases of designing the system. The main focus was on meeting
usability attributes as much as possible in the design. The text-based system modified by
applying relevant principles in the heuristic evaluation checklist presented in the previous
section. The most related principles are simple and natural dialogues by shortening the
comments of the dialogue-based system, speaking the user’s language in the dialogues by
changing the dialogues in a way that non-software developers can understand the
concept, minimize the user’s memory load by adding provided requirements, picked
38
requirements in the dialogue-based interface (also, in the visualized interface, colors are
used for picked and abandoned services in order to reduce users memory load),
consistency already exists in the system by the same messages from the dialogue-based
system, the visualized interface provides feedback for the user by changing the color of
the nodes and keeps the user informed about what is happening in the system. For
usability inspection method, the dialogue-based system has already provided error
messages for the user when he types an irrelevant word or presses an irrelevant button,
for error prevention, dialogue based system gives the user options for the appropriate
response in brackets after each question. Even adding three buttons in the graphical
interface will prevent some typing errors in text-based system and cases less errors
happen. On the other hand the system is designed in a way to responses positively to all
the three questions in cognitive walkthrough method.
For the empirical testing, both systems has been tested by users from both, computer
science and business departments. A questionnaire was provided to the users for asking
their idea about the system for both improving the user interface usability and comparing
the modified system with the previous system. Also, in some special cases the idea of
some of the users with high experience in software development were asked and applied
39 Chapter VI
RESULTS
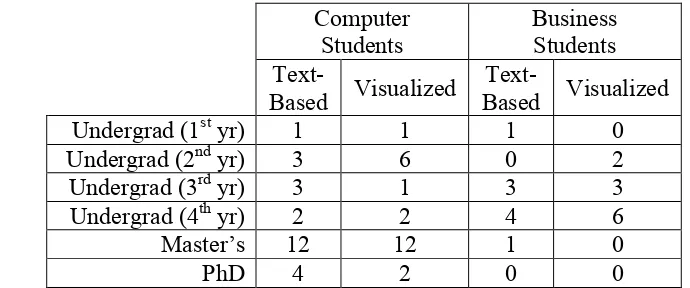
Both text-based system and graphical interface system were subjected to usability
evaluation by two groups of users with varying levels of software development expertise.
The first group included 20 students with very little or no experience in software
development skills from business department. The second group consisted of 50
computer science students. It was assumed that in general, computer science students
have a higher experience in software development than business students, which are not
expected to have any experience with this field.
Computer
Students Business Students
Text-Based Visualized
Text-Based Visualized
Undergrad (1st yr) 1 1 1 0
Undergrad (2nd yr) 3 6 0 2
Undergrad (3rd yr) 3 1 3 3
Undergrad (4th yr) 2 2 4 6
Master’s 12 12 1 0
PhD 4 2 0 0
Table 6.1 – Distribution of participants in the test according to their academic level
6.1. Briefing
The order of the tasks that participants were asked to do is as follows. First, They
were asked to listen to a brief description of the differences between classic software
development process (SDP) and software product line (SPL), which were symbolized
with a very well known and simple concept of Lego. For this reason, few slides were
provided for the participants, and they were asked to compare the way a city can be built
by basic, cubic Lego pieces to make the city by pre-made Lego accessories such as doors,
![Figure 2.1. Requirement model instantiated with book locating service [19]](https://thumb-us.123doks.com/thumbv2/123dok_us/1438334.1176225/25.612.155.492.71.360/figure-requirement-model-instantiated-book-locating-service.webp)
![Figure 3.2. Different routings in Petri nets [26]](https://thumb-us.123doks.com/thumbv2/123dok_us/1438334.1176225/33.612.186.438.468.611/figure-different-routings-petri-nets.webp)
![Figure 4.2. The text-based user interface [19]](https://thumb-us.123doks.com/thumbv2/123dok_us/1438334.1176225/37.612.116.535.78.393/figure-the-text-based-user-interface.webp)