DEVELOPMENT OF COMPUTER AIDED THREE-DIMENSIONAL GEOMETRIC MODELER BASED ON DESIGNER’S IDEA IN
TWO-DIMENSIONAL
(PEMBANGUNAN PEMODEL GEOMETRI TIGA DIMENSI BERBANTUKAN KOMPUTER BERDASARKAN IDEA
PEREKABENTUK DALAM DUA DIMENSI)
HABIBOLLAH BIN HARON
RESEARCH VOTE NO: 74225
Jabatan Pemodelan dan Pengkomputeran Industri Fakulti Sains Komputer & Sistem Maklumat
Universiti Teknologi Malaysia
ACKNOWLEDGEMENT
In the name of Allah the Most Gracious and the Most Merciful, I thank Thee
with all my heart for granting Thy Servant immeasurable help during the course of this
study and peace be upon him, Muhammad, the last messenger of Allah.
I would like to express my gratitude to my research officer Syarul Haniz Subri,
assistant researcher namely Faizal, Nasim, Fairuz, Zaki, and Edinorman for your
assistance in completing this work.
I am very grateful to Associate Professor Dr Dzulkifli Mohamed and Associate
Professor Dr Siti Mariyam Shamsuddin for your comment and ideas, and Professor Dr
Ralph Martin for suggesting this research topic.
My sincere thank also goes to UTM, RMC and MOSTI for granting me this
grant. I would also like to thank Zahari Supene, the technician, for his help in ensuring
ABSTRACT
In designing an engineering product during the conceptual stage, freehand
sketch plays an important role in conveying engineers’ ideas. Solutions on the
problems of representing, interpreting and reconstructing the sketch have been of
research interest for several decades. The aim of this study is to propose a framework
of geometric modeler in interpreting a single line drawing sketch and reconstruct the
sketch to produce a two dimensional model. The methodology used in this study is
based on the framework of a geometric modeler that contains two phases. In the first
phase, two algorithms were proposed. The first is enhanced thinning algorithm that is
used to thin the sketch while maintaining its topology and basic shape. The second is
the conversion algorithm to convert the irregular line drawing into vertex chain code
(VCC) and into modified Freeman chain code (FCC). These algorithm are used to
produce chain code series that represented a thinned binary image of the sketch. In the
second phase, a new computational corner detection algorithm of FCC and neural
network classifier for corner detection of VCC are proposed to analyse the chain code
series to produce two-dimensional geometry entities of the sketch in which the irregular
line drawing is transformed into regular line drawing. This study has proposed better
solutions in terms of an enhanced thinning algorithm, a modified Freeman chain code
and Vertex chain code algorithm as picture description language, and a new
computational algorithm and neural network classifier for corner detection.
Performance comparison of the corner detection algorithms shows that neural network
ABSTRAK
Semasa peringkat konsepsualisasi dalam merekabentuk satu produk
kejuruteraan, lukisan lakaran tangan memainkan peranan penting dalam menzahirkan
idea jurutera. Penyelesaian kepada masalah mewakil, menterjemah dan membina
semula lakaran telah menjadi bidang penyelidikan sekian lama. Matlamat kajian ini
ialah mencadangkan mencadangkan kerangka kerja sebuah pemodel geometri
menterjemah dan membina semula sebuah lakaran tunggal, dan seterusnya untuk
menghasilkan model dua dimensi. Metodologi yang digunakan dalam kajian ialah
berdasarkan rangka kerja penterjemah lakaran yang melibatkan tiga fasa. Dalam fasa
pertama, dua algoritma dicadangkan. Pertama ialah ialah pembaikan algoritma
penipisan yang digunakan untuk menipiskan lakaran dengan mengekalkan falsafah
memelihara topologi dan bentuk asasnya. Kedua ialah penciptan algorithma menukar
lukisan tak sekata kepada kod rantaian puncak dan pengubahsuaian algoritma kod
rantai Freeman. Algoritma-algoritma ini digunakan untuk menghasilkan siri kod rantai
bagi mewakili imej binari ternipis lakaran. Dalam fasa kedua, algoritma pengesanan
selekoh pengiraan baru bagi kod rantaian Freeman dan pengelas rangkaian neural bagi
mengesan simpang berasaskan kod rantaian puncak telah dicadangkan bagi
menganalisa siri kod rantai untuk menghasilkan entiti geometri dua dimensi di mana
lukisan garisan tak sekata ditukar kepada lukisan garisan sekata. Kajian ini telah
mencadangkan penyelesaian yang lebih baik dari segi pembaikan algoritma penipisan,
pembaikan kod rantai Freeman and kod rantaian puncak sebagai bahasa penghuraian
gambar, dan algoritma pengesanan selekoh pengiraan baru dan pengelas rangkaian
neural bagi pengensan simpang. Perbandingan pencapaian bagi pengesan simpang
menunjukkan bahawa rangkaian neural adalah lebih baik manakala kod rantaian
CONTENTS
CHAPTER SUBJECTS PAGE
TITLE i
ACKNOWLEDGEMENT ii
ABSTRACT iii
ABSTRAK iv
TABLE OF CONTENTS v
LIST OF TABLES ix
LIST OF FIGURES x
LIST OF ABBREVIATIONS xiii
LIST OF APPENDIXES xiv
I INTRODUCTION 1
1.1 Definition of Geometric Modeler 1
1.2 Motivation 1
1.3 Objectives 4
1.4 Scope 5
1.5 Assumptions 6
1.6 Report Outline 6
II LITERATURE REVIEW 11
2.1 Line Drawing Sources 11
2.1.1 Origami World 13
2.1.2 Engineering Sketch 14
2.1.3 Impossible Object 14
2.1.4 Wireframe Object 15
2.2 Boundary Representation 15
2.3 A Geometric Modeler 17
2.3.1 Sketching Process 17
2.3.2 The Sketch Interface 18
2.3.3 The Modeler Engine 22
2.4 Rangkaian Neural 27
2.5 Thinning Process 29
2.5.1 Definition 29
2.5.2 Thinning Algorithm 30
2.6 Picture Description Language 33
2.6.1 Chain Code Scheme 33
2.5.2 Bribiesca Chain Code 37
2.7 Corner Detection Algorithm 39
2.7.1 Feature Extraction 39
2.7.2 Chain Code based 43
2.7.3 Artificial Intelligence based 44
III RESEARCH METHODOLOGY 46
3.1 The General Framework of Geometric Modeler 46
3.2 Problem Identification and Classification 50
3.3 Nature of Data 52
3.4 Pre-Processing 52
3.5 Development of Algorithm 53
3.6 Testing and Validation 54
3.7 Implementation 54
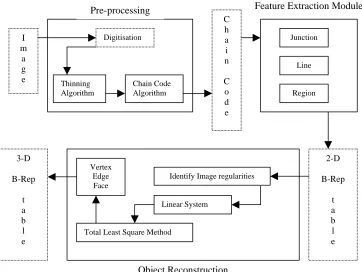
IV THE PROPOSED ALGORITHMS 56
4.1 The New Framework 56
4.2 The Boundary Representation Data Structure 57
4.3 Digitisation Process 61
4.4 The Enhanced Thinning Algorithm 61
4.4.1 Basic Thinning Constrain 61
4.4.2 Stage I: Neighbourhood greater than 3 62
4.4.3 Stage II: Neighbourhood equal to 2 or 3 63
4.5 VCC Convertion Algorithm 65
4.5.1 The Formation of Rectangle Cell 65
4.5.2 The Derivation of Vertex Chain Code 66
4.6 FCC Feature Extraction: The Computational Model 68
4.6.1 The Chain Code Series Derivation 68
4.6.2 T-junction, Corner, and Line Detection 75
4.6.3 Region Detection 85
4.7 VCC Corner Detection: The Neural Network Classifier 91
V RESULTS AND DISCUSSION 97
5.1 Introduction 97
5.2 The Digitisation of Input Object 99
5.3 The Enhanced Thinning Algorithm 102
5.4 The Conversion Algorithm 103
5.5 Computational Corner Detection 103
5.5.1 The Chain Code Algorithm for T-junction, Corner,
and Line Detection 103
5.5.2 The Chain Code Algorithm of Region Detection 104
5.6 Neural Network Classifier 105
5.7 Research Contributions 108
5.8 Discussion 112
VI CONCLUSIONS AND FUTURE WORKS 113
6.1 Conclusions 113
6.2 Future Works 114
6.3 Summary 116
REFERENCES 118
APPENDIXES
LIST OF TABLES
TABLE NO. TITLE PAGE
4.1 Start test location (clockwise direction) 70
4.2 Row and column values for i = n2+1, ,n−1
L 78
4.3 Row and column values for i=n2−3,L,0 79
4.4 Row and column values 81
4.5 The Sum of difference of rows 81
4.6 The Sum of difference of columns 82
4.7 Total of row and column differences 82
4.8 Row and column values 83
4.9 The Sum of difference of rows 83
4.10 The Sum of difference of columns 84
4.11 Total of row and column differences 84
4.12 Start test location (anti-clockwise direction) 86
4.13 The best model of VCC with the parameter 95
5.1 Table of Vertex and Table of Edge (2D) 104
5.2 Table of Face (2D) 105
LIST OF FIGURES
FIGURE NO. TITLE PAGE
2.1 Example of line drawings 12
2.2 Irregular line drawings and their regular representation 13
2.3 Origami world ‘W-folded paper’ line drawing 13
2.4 Engineering sketch represents a cube 14
2.5 Line drawings of impossible object 14
2.6 Line drawings of wireframe object 15
2.7 Process flow of a sketch interpreter 18
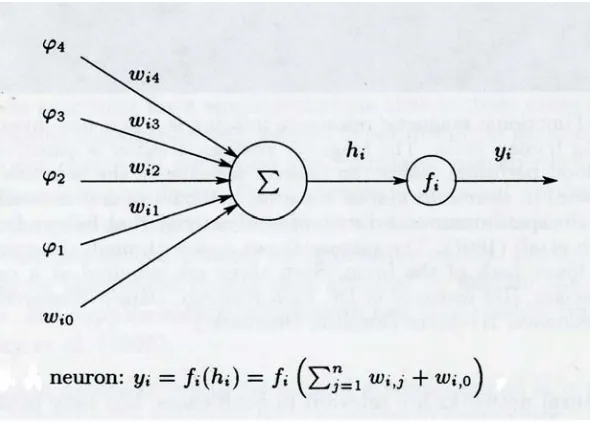
2.8 Descriptin of neuron 28
2.9 Description of neural network formula 28
2.10 Thinning process 30
2.11 The 2D Freeman chain code 34
2.12 Freeman cubic lattice chain code 35
2.13 Example of Freeman Chain Code 37
2.14 Three different cells 38
2.15 VCC of triangle cell 38
2.16 Five directions an codes of 3D discrete curve 39
2.17 T-junction creation 39
2.19 Line creation 42
2.20 A region bounded by 4 junctions 42
3.1 The architecture of the DCS system 47
3.2 The new framework of a geometric modeler 49
4.1 The schematic diagram of the proposed algorithm 57
4.2 Constrain of thinning algorithm 62
4.3 Twelve cases of total neighbourhood equal to 2 64
4.4 Twelve cases of total neighbourhood equal to 3 64
4.5 From Thinned Binary Image to Rectangle Cell 65
4.6 The Process of Rectangle Cell Formation 66
4.7 Example of VCC Cell Code 67
4.8 Example of VCC code of the rectangle cell 67
4.9 Chain code & the location 68
4.10 Chain code format and its example 69
4.11 Example of binary image 70
4.12 Example coordinate (2,6) 72
4.13 Example coordinate (6,2) 73
4.14 Example of binary image 73
4.15 Example coordinate (3,5) 74
4.16 Example coordinate (5,3) 75
4.17 T-junction 76
4.18 A corner at coordinate (6,6) 80
4.19 No corner at coordinate (2,4) 83
4.21 Direction of chain code for the first region 88
4.22 Direction of chain code for the second region 89
4.23 Direction of chain code for the third region 89
4.24 Example of pole for corner and not corner detection 91
4.25 Chain code Pattern Pole (corner exist) 92
4.26 Chain code Pattern Pole (corner exist) 93
4.27 Iteration during the training process 94
4.28 The graph in train the network 94
5.1 The Adobe interface and the cube 98
5.2 The interface of Feature Extraction Module 99
5.3 A cube 100
5.4 The cube displayed in the interface 100
5.5 The binary image 101
5.6 The thinned binary image 102
5.7 The boundary and internal line chain code 104
5.8 The region chain code 105
5.9 The input of the classifier for Stair 106
5.10 Corners at the Stair Drawing 107
5.11 Output of the Classifier and the Actual Output 107
LIST OF ABBREVIATIONS
2D Two-dimensional
3D Three-dimensional
B-Rep Boundary Representation
CAD Computer Aided Design
CAM Computer Aided Manufacturing
CSG Constructive Solid Geometry
DCS Design Capture System
DWG AutoCAD Drawing File Format
DXF Data Interchange Format
FCC Freeman Chain Code
GVA General View Assumption
PCC Primitive Chain Code
PDL Picture Description Language
TIFF Tag Image File Format
TOE Table of Edge
TOF Table of Face
TOV Table of Vertex
LIST OF APPENDIXES
APPENDIX TITLE PAGE
A1 Output display of TIFF information (Cube1) 125
A2 Output display of binary image (Cube1) 126
A3 Output file of the binary image (Cube1) 127
A4 Output display of thinned binary image (Cube1) 128
A5 Output file of the thinned binary image (Cube1) 129
INTRODUCTION
1.1 Definition of Geometric Modeler
Geometric Modeler interpreter is a system that allows engineers to design
naturally using input devices and automatically interprets the sketch to a
three-dimensional object. It consists of two parts namely the interface and the engine. In
general, the interface must imitate a natural style of sketching by providing all attributes
such as quick response and act as pencil and paper as used by engineers in sketching
engineering product. The sketching concept used in Palm Desktop or commercial
software such as PaintBrush or Adobe Photoshop software is an example of the
interface. On the other hand, the engine of a geometric modeler must be able to produce
accurate two-dimensional regular line drawing or three-dimensional object by
classifying type of drawing intended and validating the drawing.
1.2 Motivation
In engineering product life cycle, the cycle starts with conceptual design and
ends with product marketing. Pencils and papers are common tools used to sketch by
replaced by digitiser and light pen. The evolution of Computer Aided Design (CAD)
initiated by Sutherland (1963) in 1960’s had given tremendous effect on the
development of Computer Aided Design software. Since then, developments of CAD
softwares that cater needs in designing, updating, storing and visualising engineering
drawing have rapidly improved. Unfortunately, the failure of conventional interface in
CAD software that used mouse, pop-up menu, and icons at conceptualisation stage is a
lack of the development of CAD software in manufacturing industries because engineers
do not want to lose the naturalness of paper and pencil when conveying their ideas. This
fact is supported by research done by a few number of researcher as explained in this
section.
Foley (1976) examined man-machine communication from a language
viewpoint. He claimed that the best interaction techniques are the most natural to the
users. Therefore, better interaction tool is needed because the existing mechanism does
not permit actions that are sufficiently natural.
Hwang and Ullman (1990) suggested that icons and menus are barriers between
the designer and the design. They are the artificial devices added to enable the designer
to instruct the interface of his attentions, rather than aiding the designer to visualise his
design. He also pointed out that current interfaces are aimed at accurate graphical
presentation, rather than rough sketches required when a designer is working quickly at
a conceptual stage.
Goldschmidt (1992) examines architects at work during their design process, and
concludes that sketch is not merely an output mechanism to record an idea, but actually
a form of dialogue between the designer and the drawing, a form of external
representation to aid the brain in visualising a design. He also stressed that the input
method must be fast and natural to the user, to prevent the design dialogue from
Wang (1992) in his survey stated that there are two important research areas in
the field of computer vision and artificial intelligence. They are the reconstruction of a
three-dimensional object from its two-dimensional projections and its corresponding
problem of 3D object recognition. He emphasised the importance of the degree of user
interaction that is necessary for correct reconstruction and internal representation used in
the reconstruction process.
Jenkins and Martin (1993) emphasised the importance of sketch in conceptual
design. In a conceptual design process, a designer cannot tolerate losing ideas because
of constraints created by devices such as mouse, icons, and menus. Therefore, pen and
pencil are still preferred by designers.
Pham (1994) stated that CAD still falls short of designer’s expectation; they still
remain to be seen more as a drafting tool than a design tool. Designers cannot use or at
best feel very uncomfortable to use these systems during the early stages of design.
Grimstead and Martin (1995) stated that CAD systems are biased towards
computer rather than design; this introduces barriers between the designer and the
modelling system. The use of natural pencil and paper style interface moves the CAD
system near to the designer.
Matsuda et. al. (1997) emphasised the importance of the sketch in conceptual
design. He introduced a new method to deal with sketches for inputting geometric
model at a workstation using stylus pencil and a tablet.
Liu and Lee (2001) claimed to that current CAD tools cannot directly convert a
line drawing into a 3D object, denying mean of input. Therefore, it is highly desirable to
Ullman (2002) stated that freehand sketches still constitute a fundamental tool
for the engineer to express his or her creativity, because CAD systems are still not
entirely suitable for conceptual design.
Therefore, the aim of this research is to propose methods that can be used in the
development of geometric modeler as commercial softwares, so that it can cater to the
needs of natural style of sketch in conceptual stage that is important but yet still not
available in market. To support the development, research on the techniques to develop
a user-friendly geometric modeler interface and more accurate and faster engine to
reconstruct the drawing should be given attention. With the help of existing input tools,
such as stylus pencil, tablet and digitiser, the objective to provide tools for engineers in
sketching process is possible.
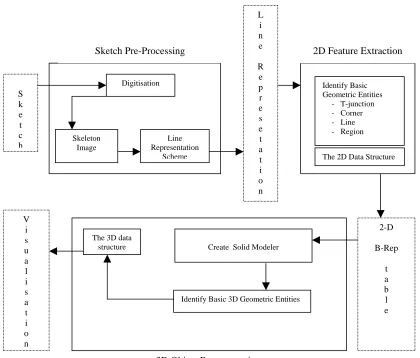
1.3 Objectives
There are three stages in the development of a geometric modeler. The stages
are pre-processing stage, two-dimensional feature extraction, and three-dimensional
object reconstruction. The objectives of this research can be classified according to the
stages involved. The three objectives are listed below:
i. To develop a new framework in representing, interpreting, and reconstructing
a two-dimensional freehand engineering sketch of three-dimensional object
that meets the general architecture of geometric modeler.
ii. To maintain the continuity in representing, interpreting, and reconstructing
sketches.
iii. To develop enhanced algorithms in sketch interpretation that consists of
thinning algorithm in the pre-processing stage, chain code algorithm in
representing the drawing, new corner detection method in 2D feature
iv. To develop algorithm in term of mathematical model to convert the single
two-dimensiolan data into three-dimensional solid object. Due to the budget
constraint, this objective cannot be achieved.
1.4 Scope
There are many types of line drawing such as line drawing of impossible object,
wireframe object, origami world, and engineering sketch. The research only accepts
valid line drawing of engineering sketch that represents a three-dimensional object.
In the first stage, this research proposes improvement of existing thinning
algorithm, proposes vertex chain code conversion algorithm, and proposes Freeman
chain code and vertex chain code algorithm as a picture description language to
represent the irregular line drawing.
In the second stage, this research focuses on the use of vertex and Freeman chain
code in feature extraction. Thre are two algorithms proposed in this stage. First is the
corner and region detection algorithm of FCC representation besides the derivation of
T-junction and lines. Second is the corner detection using neural network classifier of
VCC representation. In this stage, a regular line drawing which is represented by
boundary representation (B-Rep) scheme is produced.
In the third stage, the research should focus on the reconstruction of the
two-dimensional data into three-two-dimensional solid object, but due to the budget constraint
1.5 Assumptions
This research has made a few assumptions to simplify the interpretation and
reconstruction process. The line drawing of the system is assumed as a freehand sketch
line drawing in the form of scanned image, drawn using any sketch software such as
Adobe or any CAD software, and in format of Tag Image File Format (TIFF) graphic
image.
In the sketch, when a scene is projected onto the view plane, only the edges are
drawn and exactly two faces share every edge. For every face, one side of face is
occupied with material and the other side is empty. Therefore, texture and scribbles on a
surface are not drawn. The sketch is assumed to represent a valid three-dimensional
object where all unwanted pixels have been removed and there is no unconnected pixel.
The sketch is assumed as a sketch with all informative lines shown. The general
viewpoint assumption (GVA) is applied in this research where the observer is not
coplanar with any pair of non-collinear edges and the observer is not coplanar with any
face. This eliminates degenerate case for example, a plane that is projected by a line.
These assumptions make the reconstruction more logical or otherwise line
drawing of a cube projected on a view plane is seen as a square because the projection is
parallel to three faces of the cube. In this case, it is impossible to interpret and
reconstruct the line drawing as three-dimensional object.
1.5 Report Outline
The report is divided into six chapters. The first chapter gives an overview of the
geometric modeler, motivation, objective, scope of this research, assumptions made and
report outline. This chapter ends with a brief explanation of contributions made in this
The second chapter discusses literature review on seven areas namely the sources
of line drawing, background of boundary representation, development of geometric
modeler, thinning process, picture description language, and corner detection algorithm.
The inter-relationship between these areas and their importance in the research are
explained in the summary of the chapter.
The third chapter explains the methodology used in this research. The discussion
starts with the explanation on general framework of geometric modeler development
cycle and the proposed framework. This is followed by description of six steps involved
in the methodology. The steps are problem identification and classification, nature of
data, pre-processing, development of algorithms, model formulation, and testing and
validation process. The six steps involved in the methodology are based on the general
framework explained in the introduction of the chapter.
The fourth chapter explains contributions of the research. First, this chapter
gives details of the new framework for geometric modeler development life cycle. Next,
two pre-processing stages required by the new framework i.e. (the definition of data
structure and the digitisation process) are discussed before the explanation of the other
five contributions is preceded. The other four contributions discussed are the enhanced
thinning algorithm, vertex chain code conversion algorithm, Freeman chain code feature
extraction algorithm, and vertex chain code neural network classifier for corner
detection. Summary is given at the end of the chapter.
The fifth chapter discusses on the result of the enhanced algorithms. The
discussion is divided based on steps involved in the interpretation and is supported by a
sketch of a cube and stair. Research contribution and discussion are given at the end of
the chapter. Chapter 6 suggests future works of the research and gives conclusion of the
1.6 Contributions of the Research
There are six contributions of the research. The contributions are the enhanced
thinning algorithm, VCC conversion algorithm, FCC closed loop chain code algorithm
for T-junction, corner and line detection, FCC closed loop chain code algorithm for
region detection, neural network classifier for corner detection of vertex chain code
series, and the new framework of geometric modeler in the form of new algorithm for
3D object interpreter.
The proposed algorithm covers all stages in the development of a geometric
modeler. The enhanced thinning algorithm utilises image-processing concept in
skeleton a sketch. The VCC conversion algorithm presents the automation process in
representing thinned binary image as vertex chain code. The FCC closed loop chain
code algorithm acts as a language to represent the sketch. The closed loop chain code
for corner and region detection algorithm detects the existing of corners and regions that
are represented by the chain code series. The neural network classifier of vertex chain
code presents a new intelligent corner detection algorithm.
The algorithms and mathematical model presented and designed in this thesis can
be used as independent tools in different areas have been designed to act as integrated
tools in the proposed framework. The thinning algorithm that has been used as a tool in
image processing is enhanced to produce thinned binary image. The thinned binary
image then acts as an input of the FCCand VCC algorithm. Chain code representation
that has been used as picture description language of line drawing is enhanced and
applied in the mathematical model and neural network corner detection algorithm. The
integration of these tools produces a new framework of geometric modeler.
The enhanced thinning algorithm has been used to remove unwanted pixel and to
simplify the image so that the new image will suit the philosophy of chain code
algorithm. The proposed thinning algorithm is an enhancement of the work by Pitas
The VCC conversion algorithm presents a new algorithm in automatic
conversion of a thinned binary image into vertex chain code. The work is based on
Bribiesca (1999) chain code scheme. The new algorithm has been tested on three line
drawings and should be programmed so that it can perform on any line drawing.
The FCC closed loop chain code algorithm is an improvement of work on Picture
Description Language (PDL) by Freeman (1969) with specialization in representing a
line drawing. A new scheme in traversing the pixel is proposed by introducing two
parameters namely setting the first location of the code to be traversed, and the direction
of the traversal.
The extraction of T-junction is based on the intersection of lines by utilising the
series of chain code and their Cartesian coordinates. In the corner detection algorithm,
computational method has been applied by introducing a new algorithm to detect corners
between consecutive T-junctions. Region detection algorithm shows that the
combination of Table of Vertex (TOV) and region chain code series can be used to
produce the new algorithm.
Neural network classifier has been used to detect corner of the chain code
algorithm. This research has proposed a chain code based classifier since not many
works has been done on this topic.
Applying these algorithms and models in the proposed algorithm produces an
intermediate and final data structure to represent a solid model. The data structure is
then saved as boundary representation that is now ready to be viewed using any CAD
software.
The proposed algorithm is able to produce a boundary representation of single
planar, trihedral model drawn as single isometric, hidden-line removed sketch line
proposed by Hwang and Ullman (1990). The objective of the algorithm is still similar
LITERATURE REVIEW
2.1 Line Drawing Sources
Line drawing is one of the simplest forms of graphic expression in many fields.
It represents two-dimensional scenes such as diagrams and plans and three-dimensional
scene such as solid model or origami world. Line drawing can be in the form of
irregular and regular line drawings. With the help of Computer Aided Design system,
irregular line drawing can be improved by using the editing command. The existence of
CAD system actually eliminates the naturalness of sketching. The advent of peripheral
technology such as high quality scanner, light pen, and digitiser has given alternative to
the CAD system. Therefore, an interpreter that interprets the hand sketch must be
available so that the sketch can be interpreted and solid model depicted by the drawing
can be produced.
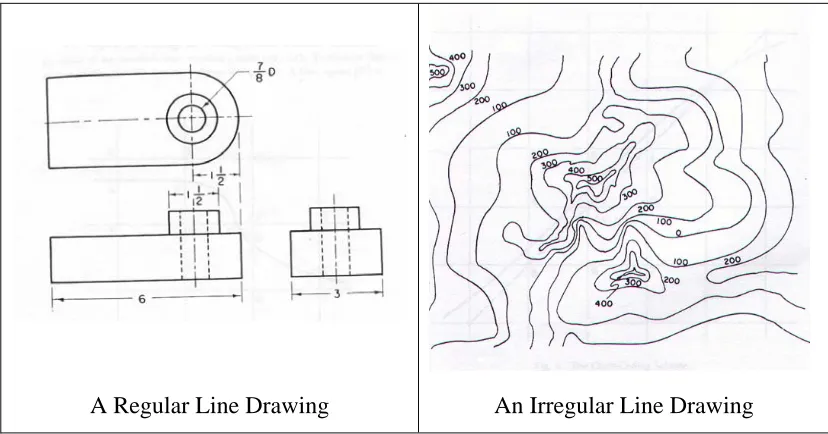
The definition of the term line drawing, type of line drawing and sources of the
line drawing are given in this section. A line drawing is an abstraction derived from an
image that conveys its information solely through the shape of thin lines on a contrasting
background. Freeman (1969) classified line drawing into two types namely regular and
irregular line drawing. Regular line drawing is a picture which consists of straight lines,
arcs or circles or other conic sections, and standard symbols (such as characters). An
drawings occur in architectural and technical drawings; while irregular line drawings are
found in terrain maps, electrocardiograms, the tracks of animals looking for food, and
most other line drawings that are used to describe natural rather than man-made
phenomena or objects. Figure 2.1 shows these two types of line drawing.
A Regular Line Drawing An Irregular Line Drawing
Figure 2.1:Example of line drawings Freeman (1969)
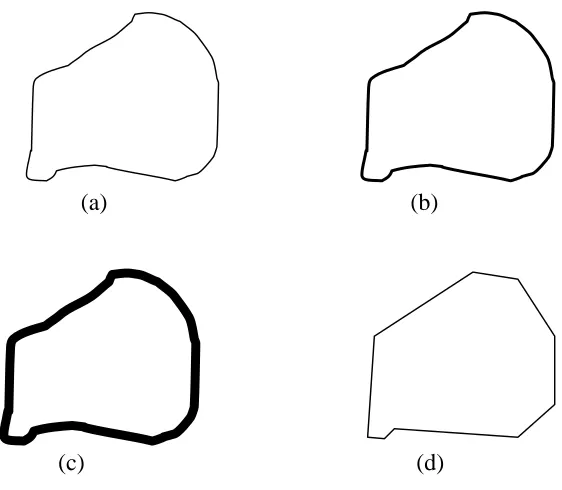
This research focuses on irregular line drawing. Line drawing can be produced
from many sources. Four sources of line drawing discussed in this section are origami
world, engineering sketch, impossible object, and wireframe model. Given a line
drawing with different thickness, it actually represents the same topology. Figure 2.2
(a-c) shows a line drawing formed with three different line thickness that is actually having
similar geometry. In order to represent these lines, a single representation is enough.
Figure 2.2 (d) is one of the regular line drawings of the freehand sketch in Figure 2.2
(a-c). Note that more than one regular line drawing can be formed based on an irregular
(a) (b)
(c) (d)
Figure 2.2: Irregular line drawings and their regular representation
2.1.1 Origami World
Started in Japan, origami world is an art of making an object from a sheet of
paper. Since the folding of the paper will represent lines, the view of the origami world
can be represented through a regular line drawing. Figure 2.3 shows an example of line
drawings of origami world that represents a bird. The line drawing of origami world is
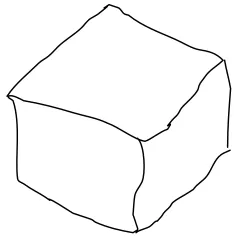
2.1.2 Engineering Sketch
An engineering sketch is a preliminary design in the life cycle of engineering
product design namely in conceptual stage. The sketch must be tidied up and translated
into proper engineering design. It is classified as irregular line drawing. Figure 2.4
shows an example of engineering sketch. The drawing represents a cube in
three-dimensional world. This research focuses on this type of line drawing.
Figure 2.4: Engineering sketch represents a cube
2.1.3 Impossible Object
Impossible object can be represented by a regular line drawing as shown by E
block and Penrose tri-bar object in Figure 2.5. The drawing is designed uniquely to test
mind. Research, such as that conducted by Cowan (1977), has been done in picture
interpretation to determine the correctness of this type of line drawing.
2.1.4 Wireframe Object
Wireframe model is a three-dimensional representation of a solid object without
faces. It is classified as regular line drawing as it is produced by Computer Aided
Design software representing a three-dimensional object. Figure 2.6 shows examples of
line drawings of a wireframe object that represent a cube. It shows that ambiguity exists
in this type of line drawing.
(No Ambiguity) (No Ambiguity) (Ambiguity appear)
Figure 2.6: Line drawings of wireframe object
2.2 Boundary Representation
Solid modelling is a computer description of three-dimensional objects in
sufficient details to render, analyse, or manufacture the model in a realistic manner.
Generation of numerical code for machining or analyses of finite element are examples
of its use in solid modelling. In computer processing, examples of the representation
schemes to record solid models are primitive instancing, sweep representation, boundary
representation, feature-based, and constructive solid geometry (CSG). Since methods of
recording the solid model in term of hard copy or soft copy are regarded as standard
graphics procedures, CAD textbooks such as by Hoffmann (1989) and Lee (1999) can
be referred for further details. In this section, three representation schemes discussed are
Boundary representation represents an object in terms of boundary, namely in
terms of vertices, edges, and faces. There are several variations of boundary
representations such as the winged-edge representations; this particular representation
has each edge stored with one pointer for each incident face, two pointers for
terminating vertices, and two more pointers for its incident faces. A simplified version
of this structure is used in this research, where an edge has pointers to its incident faces,
and two pointers to its terminating vertices; no pointers are made to incident edges, but
each vertex has pointers to its three incident edges (because of a trihedral solid
assumption). Boundary representation may also be used to model objects with curved
surfaces, although this thesis limits itself to planar surfaces. Note that boundary
representations may not necessarily describe a valid object, solids may self intersect;
faces may not be planar or bounded (which would cause problems when a planar model
is required). Despite this, boundary representation is used in this research due to ease of
representation and manipulation. It is particularly suited to the nature of the data input,
and the manipulation to be carried out, which are creation of linear constraint equations
and the conversion of the two-dimensional into a three-dimensional solid model.
Data representation used by Marill (1991) and Leclerc and Fischler (1992) is not
computer oriented and structured enough even though the usage of table is applied. The
list of junctions and lines in a form of table makes it difficult for computer to represent
them in any data structure of programming language. Compared to the boundary
representation used by Grimstead (1997) and Lipson and Sphitalni (1996), the
representation used by Grimstead is more systematic and easier to be represented by
structured programming language. For that reason, this research uses the boundary
2.3 A Geometric Modeler
This section discusses factors that encourage the research development in sketch
interpretation. Strictly speaking, it is impossible to uniquely identify a 3D structure by
drawing a single view. Line drawing interpretation involves two stages namely feature
extraction and feature interpretation. Feature extraction is a lineal description of the
image sensed by the scanner and is extracted by means of image processing. Feature
interpretation is a process to obtain a set of interpretations of the line drawing as an
object in 3D space. This section discusses past works on the two-dimensional sketch
interpreter of line drawings that the user wishes to be interpreted as three-dimensional
solid models. The discussion of a sketch interpreter is categorised into three issues. The
first discussion is on the general process flow of a sketch interpreter. The second
discussion is on the development of a computer system that provides interface for
on-line sketching. Finally, the third discussion is on geometric modeller that infers the
missing depth information from image regularities in the drawing that produce possible
three-dimensional solid model.
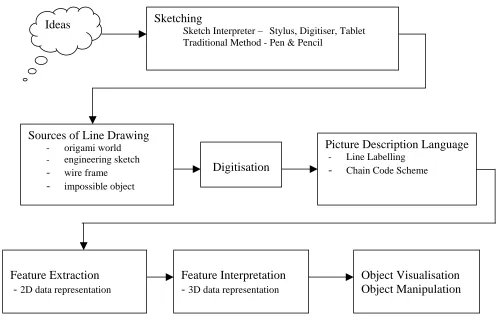
2.3.1 Sketching Process
A sketch interpreter is a system that interprets and reconstructs a freehand sketch.
Figure 2.7 shows the process flow of a sketch interpreter. The process starts during the
sketching process where engineers sketch ideas on a sheet of paper or any input device.
Draftsmen then translate the sketch into a proper regular line drawing manually or by
any sketch interpreter automatically. This drawing is then interpreted in terms of
validity by classifying the drawing by its sources. Once the interpreter validates the
drawing and represents it in the form of computer representation, the interpreter then
extracts the 2D information of the drawing. Based on the 2D data structure, the
interpreter interprets the drawing into a three-dimensional object and stores it in as a
neutral format that can be accessed by any CAD software for visualisation and
Ideas Sketching
Sketch Interpreter – Stylus, Digitiser, Tablet Traditional Method - Pen & Pencil
Sources of Line Drawing
- origami world - engineering sketch
- wire frame
- impossible object
Feature Interpretation - 3D data representation
Picture Description Language
- Line Labelling
- Chain Code Scheme
Feature Extraction - 2D data representation
Object Visualisation Object Manipulation Digitisation
Figure 2.7:Process flow of a geometric modeler
2.3.2 The Sketch Interface
Computer Aided Design started in 1960’s. The development of digital computer
and computer hardware fastens the growth of study in geometrical modelling. The
technology of CAD software has improved in terms of user interface such as higher
resolution screen, variety of input methods such as light pen and mouse, icon in
windows, faster processor to display and process image, and in dimensioning tool. In
conventional design process, one of the earliest processes involved is conceptualisation.
This section discusses interfaces that provide a natural interface between computer and
engineers during sketching. The term natural interface used in this thesis means the
(GUI) such as icons and menus, and hardware such as digitizer and light pen to imitate
the pencil and paper used in traditional way of sketching.
Sutherland (1963) started the evolution of two-dimensional sketch. The work
has given tremendous effect in the emergence of CAD software. The system enables
users to interactively digitise a three-view drawing, consists of two stylus, and a
digitising tablet, one stylus if self-standing, and is positioned over a point in one view,
and the second stylus is used to trace the lines in another view. One disadvantage of his
work is that it interprets the drawing as two-dimensional objects.
Guzman (1968) developed a system called SEE that considered visual scenes
composed by the optical image of a group of bodies. The system looks at
three-dimensional objects in a two three-dimensional scene. The scene itself is not obtained from
visual input device, or from an array of intensities or brightness. Rather, it is assumed
that a pre processing of some sort has taken place, and the scene to be analysed is
available in a symbolic format, in terms of junctions, lines, and faces.
Mackworth (1973) developed a system called POLY that interprets a line
drawing as polyhedral scenes. The method is based on general coherence rules that the
surfaces and edges must satisfy, thereby avoiding the use of predetermined
interpretations of particular categories of picture junctions and corners.
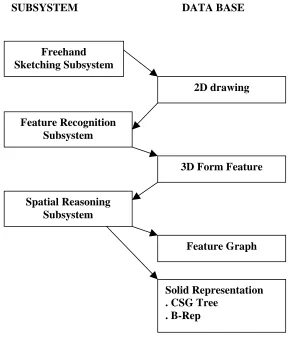
Hwang and Ullman (1990) used an expert system called Design Capture System
(DCS) to recognize parts from a known database. The system allows users to sketch
directly into the computer (without constraint), and the system tidies the
two-dimensional sketches. The limitation is that the system must contain all possible
features and parts in its knowledge base before the user can expect a sketch to be
Sivaloganathan (1991) developed an interface that allows users to directly sketch
a three-dimensional object by first tidying the two-dimensional drawing, and then
interpreting it as an isometric projection.
Marill (1991) emulated model-based human interpretation of line drawing by
constructing a program called CONSTRUCT. The fundamental principle underlying the
program was Minimum Standard Deviation Angle (MSDA) and Necker cube illusion.
Hale et al. (1992) used input cross-sections as features in the sketch interpreter.
The user first orientates the axis about which drawing will take place (the three areas
forming three planes, called centreline, plan and section). The user sketches the
centreline; plan view and several sections, all in two dimensions. A solid model is then
built up by fitting a surface through the lines sketched. This is not normally a very
natural approach to design an object. This system was intended for the car design
industry, and as such is suited extremely well for this industry only. The limitation with
his style of input is that the model produced is not fully defined by the user.
Pugh (1992) developed a program called Viking that acts as interactive sketch
interpretation. The program allows designers to create a line drawing and the program
automatically generates a three-dimensional object description. The constraint solver
applied in the program allows the program to reject inconsistent interpretation based on
the presence of hidden lines-segment.
Jenkins and Martin (1993) introduced an interface called Easel for conceptual
design with the philosophy to replace pencil and paper without losing the naturalness on
conveying and throwing ideas in conceptualisation stage. The proposed technique that
uses light pen and digitiser was a neater, faster and more accurate tool to design.
Without the interface proposed by him, ideas from designers or engineers drafted on
paper can also be analysed by scanning the image, storing it in computer and interpreting
sketch so that all lines are connected and there will be no unwanted lines and junction as
well as no unbounded region.
Lipson and Sphitalni (1996) provided a natural user interface where the user
sketched a design in the form of wireframe. The system interprets the sketch as a
three-dimensional solid through an optimisation-based reconstruction. Image regularities in
the sketch are used to create an optimised function for producing the resulting solid.
One of the image regularities used by Lipson that was used in this research is skewed
symmetry.
Zeleznik et. al. (1996) developed an interface for sketching 3D scenes called
SKETCH. The program uses simple non-photo realistic rendering and a purely gesture
interface based on simplified line drawings of primitives that allows all operations to be
specified within the 3D world.
Eggli et. al. (1997) proposed quick modeller for conceptual design called
Quick-sketch. It has full two-dimensional sketching interface which tidies the user’s input as
the sketches are drawn, but has a limited three-dimensional interface. The only mean to
produce three-dimensional objects is either by interpolating of a two-dimensional
contour or the creation of a B-Spline surface by interpolating between two curves. So
the user can sketch additional details (again, by extruding two-dimensional features) on
the surface of the resulting three-dimensional object. This is not as natural sketching on
a piece of paper since the user must consider the interface in order to provide an object
as an input. For example, user must enter a side-on view to provide L-bracket as an
input, ready for extrusion, instead of sketching a projection of the bracket directly onto a
screen.
Matsuda et. al. (1997) introduced a new method to deal with sketches as inputs to
geometric models through a system called Sketch Interpreter. Sketch is drawn on a CRT
screen through a stylus pencil and a tablet. Three characteristics of the system are to
redraw modified geometric models by replacing the sketch lines and applying thinning
algorithm.
As a summary, examples of sketch interpreter system can be found in systems
called SEE by Guzman (1968), Poly by Mackworth (1973), Design Capture System by
Hwang and Ullman (1990), CONSTRUCT by Marill (1991), Viking by Pugh (1992),
Easel by Jenkins and Martin (1993), SKETCH by Zeleznik et. al. (1996), Quick-sketch
by Eggli et. al. (1997), and Sketch Interpreter by Matsuda et. al. (1997). Besides these
systems, commercial software are also available such as PaintBrush, Adobe Photoshop,
and MacDraw to sketch drawing but they are not intended to suit the need of naturalness
to emulate pen and paper.
2.3.3 The Modeler Engine
This section discusses geometric modellers used to interpret and reconstruct a
single view line drawing. Recovery of hidden parts or inferring missing depth involves
many techniques. This section presents works on recovering hidden parts by classifying
them based on approaches used. The discussion focuses on the line drawing of
impossible object, origami world, wireframe object, and engineering sketch with
hidden-line removed regardless that the source of the hidden-line drawing is a freehand sketch or
regular line drawing.
Kanade (1980) demonstrated on how the theories and techniques that exploit
assumptions about 3D shapes of objects could provide a systematic shape recovery
method. Two parts discussed were the application of Origami theory that models the
world as a collection of plane surfaces and recovers the possible shape qualitatively, and
the techniques of mapping image regularities into shape constraints for recovering the
Barrow and Tenenbaum (1981) proposed a computational model that was based
on constraints on local surface orientation along external and discontinuity boundaries.
Techniques for recovering 3D conformation of a space curve and interpolating smooth
surfaces from orientation constraints along extreme boundaries were also discussed.
Fukui (1988) allowed users to draw freehand by which a boundary solid model
was defined with a tablet in two dimensions, and attempted to fix lines in three
dimensions relative to those previously drawn. This feature works well for a new face
that is adjacent to two or more faces as it is fixed in space. Unconnected faces were
assumed to be face-on to the user (parallel to the projection plane), and faces connected
to single face (one degree of freedom) were rotated such that the three-dimensional face
has minimum surface area. This enabled the user to create fairly complex objects, yet
still there were constraints placed on the user. Problems also occurred when two
separate faces were drawn, which were as yet unconnected as the system will
automatically assume that they were the same distance from the viewer. The method
limits the naturalness of interface and there was no freedom in constraints.
Hwang and Ullman (1990) presented an algorithm where two-dimensional
features were matched against a database of three-dimensional features and
corresponding objects (three-dimensional features being projected into two dimensions
for comparison with the sketch), finally producing the interpreted object that consisted
of the recognized parts.
Sivaloganathan (1991) presented an algorithm by assuming that, in two
dimensions, any lines along three major axes are interpreted as lines along the x, y or
z-axes in three-dimension. The system interprets straight lines and ellipses, but has the
three axes of the isometric projection fixed on-screen, represented as graph paper. This
feature limited the naturalness of the sketching, as the user has to orientate the sketch to
fit the three axes. The system encounters difficulties if a few of the lines in the sketch
constrained). With these shortcomings in mind, the direct interpretation of isometric
axes that it was not suitable and a general solution was preferable.
Hale et. al. (1992) proposed a system that formed an approximate surface to pass
through the lines, and introduced error. It would be extremely hard to design an angular
polyhedron with this method, but it serves as a quick visualisation tool for approximated
curved surfaces. Since this thesis produces an accurate solid model of polyhedron, this
technique was insufficient for our purpose.
Marill (1991) presented an algorithm that combined a line representation using
integer pair (i, j), minimum standard deviation of angles, and the Hill-Climbing scheme in seeking the minimum standard deviation of angles. Leclerc and Fischler (1992)
improved Marill’s approach by improving the objective function that favoured both
symmetry and planarity. Improving the MSDA function and using a more competent
optimisation technique reduces time taken to reconstruct.
Pugh (1992) presented an algorithm that was fully compatible with the object
descriptions used by traditional solid modeller. The proposed three-dimensional sketch
helps the user visualise the object it represents using geometric constraints as its simple
mechanism in specifying approximate vertex positions.
Wang (1992) applied constraints in the form of the Huffman-Clowes line
labelling, and constructive solid geometry concept to interpret a line drawing that
represented a polyhedron. The difference with this thesis is in the usage of boundary
representation instead of CSG to represent the solid model. Since the work was based
on a CSG representation, it is beyond our discussion.
Sugishita et. al. (1994) used perspective drawing to add extra constraints to the
sketch, making depth retrieval less ambiguous, but this lead to a mode complex system
of equations to solve, compared to parallel projection. An additional problem was that
which was difficult to accomplish with a complex object. This makes the system
unusable for quick sketching, due to the precision required. The aim of this research is
to support a natural interface, which is robust to drawing errors and quick to use. Hence
the usage of perspective projection is rejected, opting for orthographic projection instead
which is easier for a designer to sketch.
Akeo et. al. (1994) used cross-section lines of an idea sketch in the form of wire
frame drawing as an input data. The proposed system automatically creates surface and
finds the relationship between the direction of surface loop and the vector viewpoint to
determine whether a surface is the front or back surface.
Grimstead (1997) described a method of reconstructing a boundary representation
solid model from a single hidden-line removed sketch view of a 3D object. A line
labelling of the sketch, identification of image regularities, creation of linear system, and
usage of least square method were the steps involved in the reconstruction step. The
method produced a valid 3D interpretation of many cases of valid sketches; produced
most plausible interpretations for a subset of sketches, and was quick enough to be
considered interactive.
Lipson and Sphitalni (1996) used optimisation-based algorithm for
reconstructing a 3D model from a single, inaccurate, 2D edge-vertex graph. This
method avoided the usage of line labelling and supported manifold and non-manifold
object that contained flat and cylindrical faces.
Zeleznik et. al. (1996) interpreted a series of simple gesture from the user to
produce three-dimensional objects; these can then be combined using CSG to create
more complex objects. The stumbling block with this system was the amount of
gestures the user was required to learn; the user must then spend time using CSG to
create the desired object. Again, the user interface required too much consideration by
the user to be natural in usage while this research aims to create a system that is
Eggli et. al. (1997) developed an algorithm that allowed a pen stroke to be
interpreted interactively. The interpretation system used graph-based constraint solver
to establish the geometric relationship.
Matsuda et. al. (1997) presented an algorithm that can correct geometric models
in a computer even though input data of 2D sketches were drawn freehanded.
Mathematical parameters were computed and additional geometric models were
constructed in the interpretation. Company et. al. (1999) presented an algorithm that
accepted large variety of polyhedral, origami, and wireframe objects using
optimisation-based approach.
Varley and Martin (2000) converted a 2D sketch with hidden lines removed of a
single polyhedral object into a boundary representation by improving Grimstead’s
system. Image regularities and symmetry elements were used to produce more plausible
topological completion of the hidden parts of the object, and to enforce exact constraints
on the geometry.
Liu and Lee (2001) focused on surface reconstruction from single 2D line
drawing using graph-based method. Face identification was formulated as a maximum
weight clique problem. The work not only improved previous work by Lipson’s but
managed to accept a manifold object.
Langbein et. al. (2001) focused on beautification of reconstructed solid model.
The work based on boundary-representation model that required beautification due to
noise in the data and the model building. The method sought clusters of similar objects
that described properties of faces, loops, edges, and vertices.
Liu and Lee (2002) proposed new method for finding faces from single 2D line
drawings representing manifolds. The face identification was formulated based on a
steps in the method are searching for cycles from a line drawing, and searching for faces
from the cycles.
Vicent et. al. (2003) focused on the skewed mirror symmetry in the 3D
reconstruction of polyhedral models from axonometric line drawings. The new
approach determines planes of mirror symmetry based on prior detection of their planar
faces and any axes of symmetry of these faces.
As a summary, as early as early 80’s, works on interpretation and reconstruction
of line drawing have started. With the same objective to produce a valid
three-dimensional solid object, methods in terms of computer algorithm, mathematical
formulation, constraint-based, geometrical-based, and optimisation-based have been
proposed. This research proposed a new framework by combining algorithm-based and
mathematical framework to achieve the same objective.
2.4 Neural Network
Neural network is a new stream that is getting popular in computer era. There are
many techniques in NN such as fuzzy logic, genetic algorithm and neuran network. This
research chose neural network as medium in applying the case study.
Bioligically, neural network is a model from cognitive process of human brain.
Rosa (2001) stated that nodes for neural network are similar with human brain. Neuron
consisted of dendrite, acson, sinaps and soma. Figure 2.8 shows the cell contains in the
neuron. Norgaard et al. (2000) describes neuron in neural network form as formula as
shown in Figure 2.9. Rajagopalan and Rajagopalan (1996) stated that neural network
Figure 2.8: Description of neuron
Figure 2.9: Description of neural network formula
Tsai (1997) used back-propagation algorithm in the corner detection algorithm.
Terry and Vu (1993) also used back-propagation algorithm in edge detection and used
back-propagation to train the input. The classifier produced by Dias et al. (1995) also
used propagation in the neural network classifier. This shows that
2.5 Thinning Process
This section reviews on the thinning process used in line drawing interpretation.
The discussion is divided into two sections namely the definition on thinning and
reviews on the thinning algorithm that leads the researcher to the proposed enhanced
thinning algorithm. There are many works done on thinning algorithm but the
discussion focuses on the thinning algorithm that is integrated with the use of chain code
scheme.
2.5.1 Definition
Thinning is an important pre-processing step for many image analysis operations
such as print recognition, optical character recognition, and biomedical systems.
Thinning is a process of producing a skeleton of an image by getting rid of all redundant
points, but preserving the basic structure and characteristics of the pattern. There are
two types of thinning algorithm namely sequential and parallel. This section presents
these two types of thinning algorithm for digital images. Figure 2.10 shows example of
how thinning process skeletons an image but preserves the basic structure and
characteristics of the pattern. Sequential thinning algorithm refers to the deletion
process where contour points are examined in a predetermined order. Parallel thinning
algorithm refers to the deletion of pixels based on the results of only the previous
iteration.
A number of approaches for thinning have been reported in literature. Lam et. al.
(1992) identified that there are 138 publications on thinning algorithm. This shows the
importance of thinning in pattern recognition and the various approaches to yield
skeletons of shapes. Research conducted on sequential and parallel thinning algorithm
also shows that thinning algorithm can be used in reducing the amount of pixels to be
(a) Before (b) After Figure 2.10:Thinning process
2.5.2 Thinning Algorithm
This section discusses work on thinning algorithm. The discussion can be
categorised on the proving that the thinning algorithm does not change the connectivity
of picture, improvement of existing algorithm, and proposing a new thinning algorithm
in different applications. Here, the discussion is based on the year of events and its
importance on the evolution of thinning algorithm.
At early stage of development of thinning algorithm, proving that algorithm does
not change the connectivity of picture is important. Stefanelli and Rosenfeld (1971)
proved this theory by proposing parallel thinning algorithm for digital pictures in the
work.
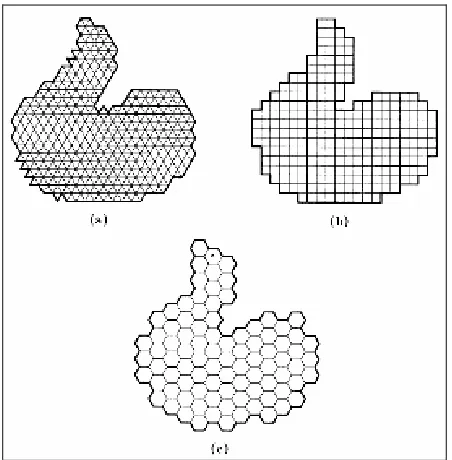
Deutsch (1972) investigated the connectivity criteria on triangular, rectangular,
and hexagonal arrays. In the proposed thinning algorithm, he concluded that the
algorithm operated in conjunction with the hexagonal array has features that strike a
Zhang and Suen (1984) proposed a fast parallel thinning algorithm to extract a
picture by removing all the contour points of the picture except those points that belong
to the skeleton. Two sub iterations applied were deleting the southeast boundary points
and the northwest corner points; and deleting the northwest boundary points and the
southwest corner points.
Lu and Wang (1986) improved the fast parallel algorithm by Zhang and Suen
(1984) and Stefanelli and Rosenfeld (1971). Wang et. al. (1986) described a method
called contour generation thinning (CGT) that iteratively generated new contour pixels
from a queue of coordinates of the pixels.
Kwok (1988) combined the idea of chain code and contour generation. He found
that the removal of a pixel could be done implicitly and automatically when considering
the multiplicity of a pixel. This led to considerable speed up when compared with other
contour generation algorithms. Kwok (1990) again proposed a modified contour
generation thinning algorithm. He used three pieces of information to process a contour
pixel, compared with four in the case of the original algorithm and nine in the case of
typical sequential or parallel algorithm. Kwok (1992) then extended his work by giving
relation of thinning algorithm with the chain code scheme and presented two algorithms.
Additional data structures were incorporated in the chain code to ensure consistency in
the propagation of contour pixels.
Lee and Wang (1994) proposed a new thinning algorithm that was simple yet
could maintain the same advantages of other key algorithms. He used only very small
set or rules of criteria for deleting pixels, which was faster and easier to implement.
Pitas (1995) defined thinning as heuristically a set of successive erosions of the
outermost layers of a shape, until a connected unit-width set of lines (skeleton) was
obtained. Thus, thinning algorithms are iterative algorithms that ‘peel off’ border pixels,
i.e. pixels lying at 0 Æ 1 transitions in a binary image. He also stressed that connectivity
border pixels were detected in such a way that object connectivity was maintained. To
suit the chain code algorithm, he concluded that two stages were required in the thinning
process.
Zhu et. al. (1995) proposed new line-based thinning algorithm that gives freedom
of choosing the deletion width at iteration, and thus significantly reduced the number of
iterations. The proposed algorithm was a new alterative method compared to
point-based thinning algorithm.
Matsuda et. al. (1997) proposed thinning algorithm for interactive line drawing
by segment composing, clipping, and segment joining. The purpose of his thinning
algorithm was to fix an edge line from freehand sketch lines. He used the thinning
algorithm in the sketch interpretation.
Flores (1998) proposed a fast thinning algorithm based on chain code of three
directions. He used 3x3 windows in delimitation of the contour of the image. Staunton
(2001) developed a fully one-pass parallel hexagonal thinning algorithm. The work
compared the algorithm with rectangular thinning algorithm. Mathematical morphology
was used as techniques in the algorithm.
Cowell and Hussain (2001) applied thinning algorithm in producing a thinned 1
pixel thick representation to recognize Latin characters by extracting features from that
character such as number of strokes, stroke intersections and holes. He used 5x5
windows to prevent tail growth. Kwon et. al. (2001) proposed an enhanced parallel
thinning algorithm that connected the pixels to each other and preserved the end point by
improving the algorithm proposed by Zhang and Suen (1984), Lu and Wang (1986) and
Wang et. al. (1986).
As a summary, previous research on new algorithm mostly focused on 3x3
windows, except those carried out by Deutsch (1972) and Cowell and Hussain (2001).
This research uses point-based serial thinning algorithm as proposed by Pitas (1995),
and integrates thinning algorithm with chain code scheme as suggested by Kwok (1992).
The application of thinning algorithm by Matsuda et. al. (1997) in sketch interpretation
also proves that the thinning algorithm can be applied in sketch interpretation.
2.6 Picture Description Language
Research on PDL started in 1960’s to represent line drawing in a mathematical
and linguistic approach. Two picture description languages discussed in this thesis are
line labelling and chain code scheme. Picture description language is introduced by
Clowes (1971) to analyse and recognize letter. A picture can represent thousand
meanings. Therefore, to simplify the meaning of a picture and to represent a picture in a
computer, a language must be developed. Representing a line drawing in the context of
language is a study under cognitive science. Primitive two-dimensional entities such as
line, circle, and ellipse can be represented by an equation, but irregular line drawing that
cannot be represented by an equation. So ways must be searched to represent the
irregular line drawing so that it can be represented by a computer. This section
discusses how to represent an irregular line by a computer representation. This section
is divided into two sections namely line labelling and chain code representation.
Besides representing the line drawing, PDL also used to categorize and to validate a line
drawing. For example, does the line drawing represent an impossible object or origami
world?; or does the line drawing represent a valid 3D object?
2.6.1 Freeman Chain Code Scheme
This section presents an alternative scheme in representing a picture called chain
code scheme. Chain code scheme is widely used because it preserves information and
numerous shape analysis algorithms. It represents shape by using a series of code. The
codes represent the direction of the next pixel. This section discusses works that have
used techniques of chain coding because of the fact that various shape features may be
computed directly from this presentation.
Discussion on chain code scheme and thinning algorithm is related because chain
code represents a pixel. Therefore, in order to represent a series of pixel that represent a
line, the line must be thinned so that the connectivity of the pixels is maintained. This
research still maintains this relation in deriving the new algorithm.
The first approach in representing two-dimensional digital curves using chain
code was introduced by Freeman (1961). Since then, work in using chain code in
representing two-dimensional drawing and three-dimensional object have been done by
many researchers. Figure 2.11 shows the 2D Freeman chain code (FCC).
7 6 5
0 4
1 2 3
x codes
Chain =
Figure 2.11: The 2D Freeman chain code
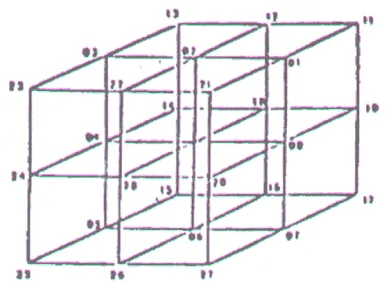
Freeman (1974) then extended his chain code into a 3D scheme called cubic
lattices that consisted of 26 points as shown in Figure 2.12. The new scheme since then
Figure 2.12: Freeman cubic lattice chain code Freeman (1974)
Minami and Shinohara (1986) proposed multiple encoding schemes called
multiple grid chain code (MGCC). The proposed scheme was claimed to have many
advantages over the Freeman chain code. O’Gorman (1988) proposed primitives chain
code (PCC) to represent image that contains eight-connected lines. PCC was an
extension of FCC, but in addition contain chain code connectivity information. There
are 185 PCC codeword in total compared to 8 in FCC.
Choo and Freeman (1989) presented an efficient technique for compressing
chain-encoded line drawings. The technique constructed a codebook containing vectors
of chains that recur frequently in the chain-encoded line drawings.
Maeder (1990) tried animating digital images sequences for visualisation using
chain coding scheme. Method for scaling, rotation and elastic deformation of objects
based solely on chain code elements was presented. Chen and Lee (1991) introduced a
new three-dimensional chain code for encoding 3D curves called C-chain code. The
new chain code has extended Freeman chain code to 3D scheme.
Choo and Freeman (1992) presented algorithms for computing features of
objects from poly curve-encoded boundaries. Some geometric calculations such as
inverse and intersection points of two poly curves were also considered. Nunes et. al.