1-186
INJECTION MOLDING PARAMETER OPTIMIZATION USING THE TAGUCHI METHOD FOR HIGHEST GREEN STRENGTH FOR BIMODAL POWDER MIXTURE WITH SS316L
IN PEG AND PMMA
K. R. Jamaludina, N. Muhamadb, M. N. Ab. Rahmanb, S. Y. M. Aminb, Murtadhahadib, M. H. Ismailc
Department of Mechanical Engineering College of Science and Technology University of Technology Malaysia
City Campus Kuala Lumpur 54100 Kuala Lumpur. Malaysia
Precision Process Research Group Dept. of Mechanical and Materials Engineering
Faculty of Engineering National University of Malaysia
43600 Bangi.
Selangor Darul Ehsan. Malaysia
Centre for Advanced Materials Research (CAMAR), Faculty of Mechanical Engineering
Mara University of Technology 40450 Shah Alam. Selangor Darul Ehsan. Malaysia
ABSTRACT
Injection molding parameters for the highest green strength of the metal powder mixture has been optimized using L27 (313) Taguchi orthogonal array. Parameters optimized are the injection pressure,
1-187 INTRODUCTION
Metal injection molding is increasingly being accepted as a suitable and cost effective method for the high volume production of small, complex-shaped and high-performance parts. The technique involves the mixing of metal powder with a binder, the injection of resulting mixture into the mold, the removal of the binder and then sintering to consolidate the part to its final density [1]. Optimization of each of these process procedures and appropriate selection of the starting materials, the powder and binder, are critically important to the overall success of the process.
The determination and optimization of the process parameters have motivated numerous research works, as it needs deep knowledge on different processes and accurate modeling techniques for each stage. The traditional approach to experimental work is to vary one factor at a time, holding all other factors as fixed. This method does not produce satisfactory results in a wide range of experimental settings. Researchers [2-5] have been using classical Design of Experiment (DOE) Technique to study the effects of injection parameters on the green part quality characteristics such as green density, green strength and green defects. In order to obtain high efficiency in the planning and analysis of experimental data, the Taguchi parameter design is applied to investigate and optimize injection parameters to produce stronger green parts. This is because, from another experiments, in another area of study such as plastic molding, metal removal processes, the Taguchi method is recognized as a systematic application of design and analysis of experiments for the purpose of designing and improving product quality. [6] In recent years, the Taguchi method has become a powerful tool for improving productivity during research and development [7] so that high quality products can be produced in a short period of time and at low cost.
The objective of the paper is to show how DOE using a Taguchi method is used to optimize the injection parameter and analysis of variance can be used to rank the contributing factors which influence the quality characteristics, in this case, green strength. The interactions of the major parameters such as injection temperature and injection pressure are discussed in this paper and also the powder loading which have its influence to the green strength.
METHODOLOGY
Sample preparation
A 316L stainless steel gas atomized powder with pycnometer density of 7.93 g/cm3 is mixed with 73
% weight of polyethylene glycol (PEG) and 25 % weight of polymethyl methacrylate (PMMA). About 2 % weight of stearic acid (SA) is used as a surfactant.
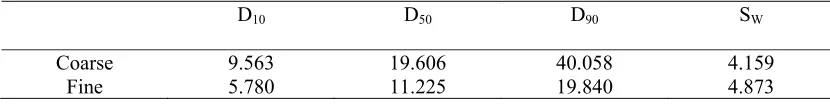
Powder metal particle-sized distributions are used in the bimodal distribution consisting of 70 % of coarse powder in weight fraction. The distribution of the particle size is as shown in Table 1 and is measured by using Mastersizer, Malvern Instrument.
TABLE 1 Particle sized distributions in µm
D10 D50 D90 SW
Coarse 9.563 19.606 40.058 4.159
1-188
Prior to the injection, compositions are mixed in a sigma blade mixer for 95 minutes at a temperature of 70oC. Here the MPIF 50 standard tensile bars are injection molded using Battenfeld BA 250 CDC
injection molding machine.
Design of experiment (DOE)
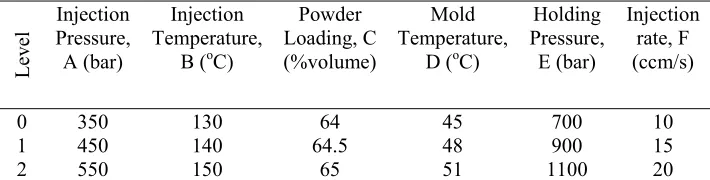
Taguchi’s orthogonal arrays are used in the production and they consist of the ranges of MIM process parameters based on three-level design of experiments as shown in Table 2.
TABLE 2 Injection parameters for three levels of Taguchi Design
Le
ve
l Injection Pressure, A (bar)
Injection Temperature,
B (oC)
Powder Loading, C (%volume)
Mold Temperature,
D (oC)
Holding Pressure, E (bar)
Injection rate, F (ccm/s)
0 350 130 64 45 700 10
1 450 140 64.5 48 900 15
2 550 150 65 51 1100 20
Beside these parameters, interactions between three important parameters such as injection pressure, injection temperature and powder loading are involved in the investigation. As the overall degree of freedom (DOF) for the single parameters and interactions being 24, Taguchi orthogonal array L27 is the
most suitable for the DOE. Refer to the linear graph for L27 orthogonal array which allocates the
parameters in the array. (Table 3)
RESULTS AND DISCUSSION
Taguchi technique utilizes the signal noise ratio (S/N) approach to measure the quality characteristic deviating from the desired value. It is also uses the S/N ratio approach instead of the average value to convert the experimental results into a value for the evaluation characteristic in the optimum parameter analysis [8]. The S/N ratio is quoted in decibel as shown in equation (1).
⎟ ⎟ ⎠ ⎞ ⎜
⎜ ⎝ ⎛ −
=
∑
= n
1 j Yij2
1 n 1 10log
S/N (1)
Where Yij is the amount of score for the green strength obtained from Table 3 and, N is the total
1-189
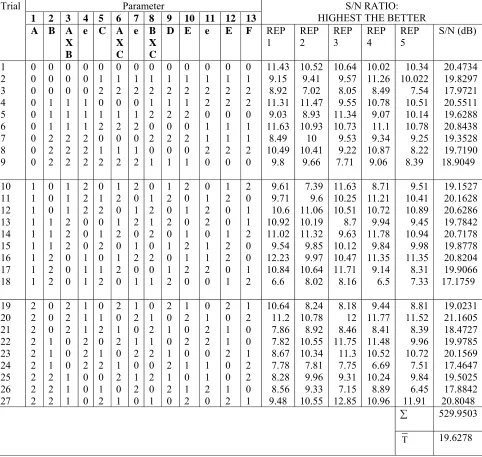
TABLE 3 Taguchi’s L27 (313) orthogonal array demonstrates the quality characteristic and the
experimental trials
Trial Parameter S/N RATIO:
HIGHEST THE BETTER
1 2 3 4 5 6 7 8 9 10 11 12 13 A B A
X B
e C A X C
e B X C
D E e E F REP
1 REP 2 REP 3 REP 4 REP 5 S/N (dB) 1 2 3 4 5 6 7 8 9 0 0 0 0 0 0 0 0 0 0 0 0 1 1 1 2 2 2 0 0 0 1 1 1 2 2 2 0 0 0 1 1 1 2 2 2 0 1 2 0 1 2 0 1 2 0 1 2 0 1 2 0 1 2 0 1 2 0 1 2 0 1 2 0 1 2 1 2 0 2 0 1 0 1 2 1 2 0 2 0 1 0 1 2 1 2 0 2 0 1 0 1 2 2 0 1 1 2 0 0 1 2 2 0 1 1 2 0 0 1 2 2 0 1 1 2 0 11.43 9.15 8.92 11.31 9.03 11.63 8.49 10.49 9.8 10.52 9.41 7.02 11.47 8.93 10.93 10 10.41 9.66 10.64 9.57 8.05 9.55 11.34 10.73 9.53 9.22 7.71 10.02 11.26 8.49 10.78 9.07 11.1 9.34 10.87 9.06 10.34 10.022 7.54 10.51 10.14 10.78 9.25 8.22 8.39 20.4734 19.8297 17.9721 20.5511 19.6288 20.8438 19.3528 19.7190 18.9049 10 11 12 13 14 15 16 17 18 1 1 1 1 1 1 1 1 1 0 0 0 1 1 1 2 2 2 1 1 1 2 2 2 0 0 0 2 2 2 0 0 0 1 1 1 0 1 2 0 1 2 0 1 2 1 2 0 1 2 0 1 2 0 2 0 1 2 0 1 2 0 1 0 1 2 1 2 0 2 0 1 1 2 0 2 0 1 0 1 2 2 0 1 0 1 2 1 2 0 0 1 2 2 0 1 1 2 0 1 2 0 0 1 2 2 0 1 2 0 1 1 2 0 0 1 2 9.61 9.71 10.6 10.92 11.02 9.54 12.23 10.84 6.6 7.39 9.6 11.06 10.19 11.32 9.85 9.97 10.64 8.02 11.63 10.25 10.51 8.7 9.63 10.12 10.47 11.71 8.16 8.71 11.21 10.72 9.94 11.78 9.84 11.35 9.14 6.5 9.51 10.41 10.89 9.45 10.94 9.98 11.35 8.31 7.33 19.1527 20.1628 20.6286 19.7842 20.7178 19.8778 20.8204 19.9066 17.1759 19 20 21 22 23 24 25 26 27 2 2 2 2 2 2 2 2 2 0 0 0 1 1 1 2 2 2 2 2 2 0 0 0 1 1 1 1 1 1 2 2 2 0 0 0 0 1 2 0 1 2 0 1 2 2 0 1 2 0 1 2 0 1 1 2 0 1 2 0 1 2 0 0 1 2 1 2 0 2 0 1 2 0 1 0 1 2 1 2 0 1 2 0 2 0 1 0 1 2 0 1 2 2 0 1 1 2 0 2 0 1 1 2 0 0 1 2 1 2 0 0 1 2 2 0 1 10.64 11.2 7.86 7.82 8.67 7.78 8.28 8.56 9.48 8.24 10.78 8.92 10.55 10.34 7.81 9.96 9.33 10.55 8.18 12 8.46 11.75 11.3 7.75 9.31 7.15 12.85 9.44 11.77 8.41 11.48 10.52 6.69 10.24 8.89 10.96 8.81 11.52 8.39 9.96 10.72 7.51 9.84 6.45 11.91 19.0231 21.1605 18.4727 19.9785 20.1569 17.4647 19.5025 17.8842 20.8048 ∑ 529.9503 T 19.6278
1-190
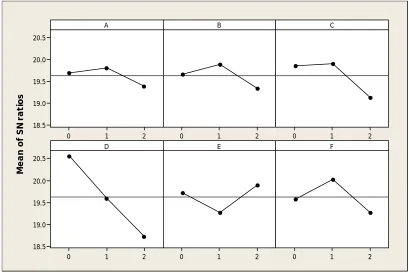
Figure 1 shows the main effects plot for the S/N ratio. The main effect plot shown in Figure 1 indicates that the highest point is the optimum parameter for each factor. Initially, without considering any interactions Figure 1 indicates A1 B1 C1 D0 E2 and F1 as the optimum. This means that the injection pressure at 450 bar; injection temperature, 140oC; powder loading, 64.5% volume; mold
temperature, 45oC; holding pressure, 1100 bar and; the injection rate of 15ccm/s are at the optimal
level. The plot shown in Figure 1 is developed from the S/N ratio shown in Table 3. As an example, the mean for factor A at level 0 (A0) is calculated by taking the sum of the S/N ratio of factor A at level 0 which equals to 177.27 dB and the mean is 177.27/9= 19.70 dB.
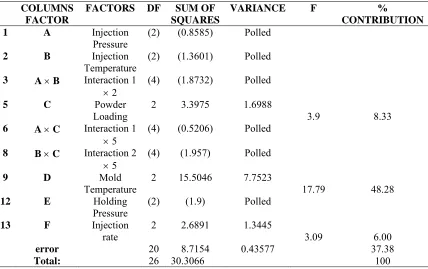
TABLE 4 ANOVA Table after Pooling
COLUMNS FACTOR
FACTORS DF SUM OF SQUARES
VARIANCE F %
CONTRIBUTION
1 A Injection
Pressure
(2) (0.8585) Polled
2 B Injection
Temperature
(2) (1.3601) Polled
3 A ×B Interaction 1
× 2
(4) (1.8732) Polled
5 C Powder
Loading
2 3.3975 1.6988
3.9 8.33
6 A ×C Interaction 1
× 5
(4) (0.5206) Polled
8 B ×C Interaction 2
× 5
(4) (1.957) Polled
9 D Mold
Temperature
2 15.5046 7.7523
17.79 48.28
12 E Holding
Pressure
(2) (1.9) Polled
13 F Injection
rate
2 2.6891 1.3445
3.09 6.00
error 20 8.7154 0.43577 37.38
Total: 26 30.3066 100
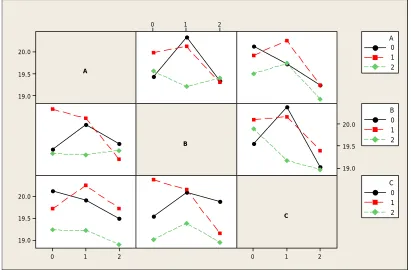
However, since the paper attempts to evaluate the effects of the interactions between factor A, B and C, so Figure 2 shows the interaction plot for the mean ratios. The interaction plot indicates that A0B1 and B0C1 have the highest mean S/N ratio. Consequently, the optimum injection pressure after considering the interactions of factor A, B and C becomes A0 B1 C1 D0 E2 and F1. Note that the optimum parameter for factor A has changed from level 1 (450 bar) to level 0 (350 bar). Figure 2 shows that factor A, B and C have an interaction and that indicates that any changes to these factors simultaneously will affect the green strength. The optimal result demonstrates that the injection parameter for producing a strong green part is not necessarily achieved at the highest factor level. Only factor E (holding pressure) was found at the optimal factor level 2 (1100 bar) while factor A and D are optimal at the lowest factor level (level 0) at 350 bar and 45oC respectively. The investigation
also found that high injection temperature and high powder loading do not compulsorily produce a strong green part. It also indicates that the injection temperature at 140oC and powder loading at
1-191
Furthermore, since only factor C, D and F have a confident level greater than 90 %, thus only three factors were used to calculate the S/N ratio at the optimum performance. This is shown in Table 5 where the optimum performance is at 21.2644 dB compared to the current grand average performance of 19.6278 dB. The current grand average performance is calculated from the average of S/N ratio as shown in Table 3.
The confident interval shown in Table 5 is calculated with equation (2) [9]:
CI =
(
)
e e
n V f f
F ×
± α 1, 2 (2)
Where, Fα(f1, f2) is the variance ratio for DOF of f1 and f2 at level of significance α. The confidence
level is (1-α), f1 is the DOF of mean (usually equal to 1) and f2 is the DOF for the error. Variance for
error terms is Ve and number of equivalent replication is given as ratio of number of trials (1+ DOF of
all factors used in the estimate). The confident interval will indicate the maximum and minimum levels of the optimum performance and it is shown as the expected result as optimum performance in Table 5.
M
e
a
n
of S
N
r
a
ti
os
2 1
0 20.5
20.0
19.5
19.0
18.5
2 1
0 0 1 2
2 1
0 20.5
20.0
19.5
19.0
18.5
2 1
0 0 1 2
A B C
D E F
1-192
A
20.0
19.5
19.0
B
C
2 1 0
2 1
0
20.0
19.5
19.0
2 1
0 20.0
19.5
19.0
0 1 2 A
0 1 2 B
0 1 2 C
FIGURE 2 Interaction Plot for S/N Ratio
TABLE 5 Estimate of Performance as the Optimum Design after Pooling: Characteristics: Higher the Better
C1D0F1
Optimum performance calculation:
(
T) (
T) (
T)
T+C1− + D0− + F1−
19.6278 + (19.91 - 19.6278) + (20.57 - 19.6278) + (20.04 - 19.6278) = 21.2644 dB
Current grand average performance 19.6278 dB
Confident interval at the 90% confidence level ± 0.58
Expected result at optimum performance, µ 20.685 dB < µ < 21.844
dB
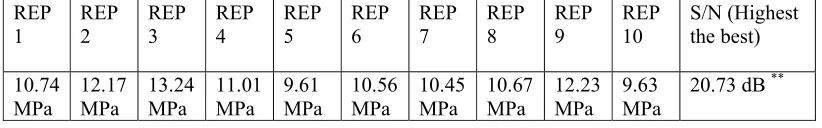
The final step is to predict and verify the improvement of the quality characteristic by using the optimal level of the injection parameters. The predicted S/N ratio using the optimal level of the process parameters are as shown in Table 5 where the optimal level is between 20.685 dB and 21.844 dB. Table 6 shows the green strength of the green part molded by using the optimum injection parameter as shown in Table 5. The S/N ratio obtained in Table 6 demonstrates that the S/N ratio is beyond the confident interval as shown in Table 5.
1-193
TABLE 6 Confirmation experiment.
REP 1
REP 2
REP 3
REP 4
REP 5
REP 6
REP 7
REP 8
REP 9
REP 10
S/N (Highest the best)
10.74 MPa
12.17 MPa
13.24 MPa
11.01 MPa
9.61 MPa
10.56 MPa
10.45 MPa
10.67 MPa
12.23 MPa
9.63 MPa
20.73 dB **
** S/N value within 90 % confident level.
Note: The injection pressure and injection temperature are varied at random.
CONCLUSIONS
The Taguchi and ANOVA methods are very helpful in determining the importance of variables when optimizing a quality characteristic including, this case, the green strength of a MIM feedstock. Based on the SS316L feedstock formulations described, the following conclusions can be made regarding green strength.
• Mold temperature is the main influencing factor and is followed by powder loading and injection rate for achieving the highest green strength. Other parameters are found to be less significant because the confident level is less than 90 %.
• However, the less significant factors are still important and they are still required for the injection molding process. This is shown in Table 6 where the S/N ratio was found to be in the optimal range where even though the injection pressure and injection temperature are not kept constant. • The ANOVA demonstrates that the powder loading also has its influence on the green strength.
Nevertheless, the interactions of the powder loading with other major factors such as the injection temperature and injection pressure do not show any significant contributions as the F test indicates that the confident level is less than 90 %.
• The optimum parameter obtained has been verified by the confirmed experiment and this shows that the S/N ratio obtained is within the confident interval.
ACKNOWLEDGEMENT
My deepest appreciation and gratitude to National University of Malaysia for the research grant, UKM-KK-02-FRGS0013-2006 and University Technology of Malaysia and Ministry of Higher Education, Malaysia for the PhD scholarship.
REFERENCES
1. R.M. German, Powder Injection Molding, 1990, Metal Powder Industries Federation, Princeton, NJ.
2. Th. Barriere, B. Liu, J.C. Gelin, “Determination of the optimal process parameters in metal injection molding from experiment and numerical modeling”, Journal of Materials Processing Technology, 2003, vol. 143-144, pp. 636-644.
3. Mohd Afian Omar, “Injection molding of 316L stainless steel and NiCrSiB alloy powders using a PEG/PMMA binder”, 1999, Ph.D. Thesis University of Sheffield, UK. 4. Muhammad Hussain Ismail, “Kesan pembebanan serbuk logam terhadap fenomena
1-194
processing phenomena in metal injection molding)”, 2002, M.Sc. Thesis National University of Malaysia.
5. Murtadhahadi, “Parameter penyuntikan bagi proses pengacuan suntikan logam bagi bahan suapan daripada SS 316L, PEG, PMMA dan AS (Injection parameter for Metal Injection Molding of the feedstock from SS316L, PEG, PMMA and stearic acid)”, 2006 M.Sc. Thesis National University of Malaysia.
6. S.C. Juang, Y.S. Tarng, “Process parameter selection for optimizing the weld pool geometry in the tungsten inert gas welding of stainless steel”, Journal of Materials Processing Technology, 2002, vol. 122, pp. 33-37.
7. J. Bendell, W.A. Disney, Pridmore, Taguchi Methods: Applications in World Industry, 1989, IFS Publications, UK.
8. H. Oktem, T. Erzurumlu, I. Uzman, “Application of Taguchi optimization technique in determining plastic injection molding process parameters for a thin-shell part”, Materials and Design. 2007, vol. 28, pp 1271-1278.