COMPARATIVE ANALYSIS OF STAGE AND PHASE SIGNAL CONTROL OF A SIGNALISED INTERSECTION
AKINMADE OLUWATOSIN DANIEL
A project report submitted in partial fulfillment of the requirement for the award of the degree of Master of Engineering (Civil –Transportation and Highway)
Faculty of civil Engineering Universiti Teknologi Malaysia
COMPARATIVE ANALYSIS OF STAGE AND PHASE SIGNAL
CONTROL OF A SIGNALISED INTERSECTION
AKINMADE OLUWATOSIN DANIEL
iii
ACKNOWLEDGEMENT
I will like to give special thanks to ALMIGHTY GOD for giving me the strength to complete this study even in hard times, my special thanks also goes to my supervisor Assoc Prof Dr Johnnie Ben Edigbe for his fatherly role and academic guidance towards my study
I also say a big thank you to my friend Ikuesan Richard Adeyemi and those that have supported me morally and spiritually during my studies especially the members of Skudia Joy Gospel Chapel.
iv
ABSTRACT
Traffic signal control can either be based stage or phase based and as such phase is when a set of movements takes place simultaneously and stage is that of cycle in which a particular set of phases receives green. A four arm signalized intersections was studied to make comparison of this two types of signal control, the saturation flow rate, cycle time, turning movement, signal timing, delay and level of service for each approach and the intersections for peak periods for both morning and evening periods was determined. British design, Highway capacity Manual and Transyt 13 were used to analyze for both stage and phase control. At the end of the study it was observed that the cycle time for stage control was high delay was very high, and as such level of service for the
v
ABSTRAK
Kawalan,trafik isyarat boleh sama ada peringkat berasaskan atauberdasarkan fasa dan se bagai fasa itu apabila satu
set pergerakanberlaku serentak dan peringkat adalah bahawa kitaran di manasatu set tertentu fasa menerima hijau. A empat persimpangansignalized lengan telah dikaji untuk membuat perbandingan ini dua
jenis kawalan isyarat, kadar aliran tepu, masa
kitaran, pergerakanmembelok, pemasaan isyarat, kelewatan dan tahap
perkhidmatanbagi setiap pendekatan dan persimpangan bagi tempoh puncakpagi kedua-dua dan tempoh petang telah ditentukan. Reka
bentukBritish, Lebuhraya Manual kapasiti dan Transyt 13 telah digunakan untuk menganalisis untuk mengawal
kedua-dua peringkat dan fasa.Pada akhir kajian diperhatikan bahawa masa kitaran untuk
vi
TABLE OF CONTENTS
CHAPTER TITLE PAGE
DECLARATION ii
ACKNOWLEDGEMENTS iii
ABSTRACT iv
ABSTRAK v
LIST OF TABLES viii-ix
LIST OF FIGURES x
LIST OF APPENDICES xi
1 INTRODUCTION
1.1 Introduction 1-2
1.2 Problem Statement 2-3
1.3 Objectives 3
1.4 Study Area 4-6
1.5 Scope of Study 6-7
1.6 Importance of the study 7
1.7 Organization of the thesis 7
2 LITERATURE REVIEW
2.1 Introduction 8-10
2.2 Types of Intersection 11-12
2.3 Passenger Packer Unit (PCU) 12-13
2.4 Traffic Control Signal 13-14
vii
2.4.3 Fully Actuated Signal Control 15
2.4.4 Signal Phasing. 15-16
2.5 Demand And Saturation Flow Rate 16-18 2.6 Concept of Saturation Flow 18-19
2.7 Capacity. 20-21
2.7.1 Cycle Length. 22
2.7.2 Lost Time 23
2.7.3 Effective-green and Effective-red Time. 24
2.8 Delay. 25-26
2.9 Level of Service. 27-28
3 METHODOLOGY
3.1 INTRODUCTION 29
3.1.1 Site location 30
3.1.2 Data collection 30
3.1.3 Data Analysis 31-34
4 RESULTSANDDATA ANALYSIS 35-90
4.1 Discussion 90-91
5 CONCLUSION 92
viii
LIST OF TABLES
TABLE NO. TITLE PAGE
2.1 Types of Intersection 12
2.2 Source ArahanTeknikJalan 86 13
2.3 Level of Service 27
4.0 Passenger Car Unit 35
4.1 (7.00am-8.00am) 36
4.2 (5.30pm-6.30pm) 37
4.3 Actual Green Timing for each Arm (Am) 38 4.4 Actual Green Timing for each Arm (PM) 39 4.5 (AM) Data for Saturation Flow Rate 40
4.6 Results 41
4.7 (PM) Data for Saturation Flow Rate. 42
4.8 Data analysis 43
4.9 Data for Amber 44
4.10 PM Amber Data 45
4.11 Delay Parameter Arm-A 47
4.12 Delay Parameter Arm-B 48
4.13 Delay Parameter ARM C 49
4.14 Delay Parameter Arm-D 50
4.15 Delay Parameter Arm-A 52
4.16 Delay Parameter Arm-B 53
4.17 Delay Parameter Arm-C 54
ix
4.19 Delay Parameter North Approach 59 4.20 Delay Parameter South Approach 60
4.21 Delay Parameter East Approach 61
4.22 Delay Parameter West Approach 62
4.23 Delay Parameter North Approach 65 4.24 Delay Parameter South Approach. 66
4.2 Delay Parameter East Approach 67
4.26 Delay Parameter West Approach 68
4.29 Delay Parameter East Approach 71
4.28 Delay Parameter South Approach 72 4.27 Delay Parameter North Approach 73
4.30 Delay Parameter West Approach 74
4.31 Delay Parameter East Approach 77
4.32 Delay Parameter South Approach 78 4.33 Delay Parameter North Approach 79
4.34 Delay Parameter East Approach 80
4.35 Summary of the analysis (am) 88
4.36 Summary of AM data 88
4.37 (PM) 89
4.38 Summary of PM data. 89
x
LIST OF FIGURES
FIGURE NO. TITLE PAGE
1.0 On Site Picture Taken On The 9thOf May 2011 5
1.1 EarthView 6
2.0 Basic Intersections Forms 11
2.2 Concept of Saturation Flow. Source: 20
2.3 Concept of Capacity 21
2.4 Concept of Startup Lost Time 23
xi
LIST OF APPENDICES
APPENDIX TITLE PAGE
A STAGING AM 95-112
B STAGING PM 113-147
C PHASE CONTROL AM 139-148
D PHASING FOR PM DATA 149-165
E TRAFFIC VOLUME FOR AM 166-168
1
CHAPTER 1
INTRODUCTION
1.1 Background
Highway transportation relevance to the development and industrialization of any society cannot be over emphasized hence a lot of research has been done in making improvement in highway transportation. Traffic engineers have developed from ages where traffic was controlled manually mainly by human to traffic signals today which has helped in controlling traffic flows ,having in mind that population are increasing, car owners are increasing, development is increasing every day. Analysis of signalized intersections with respect to the capacity and level of service and performance analysis has been conducted several times globally.
2
The importance of signalized intersections where traffic flows from various directions converge cannot be over-emphasized. The capacity of intersections is reduced much more lower than their approach link due to the influence on each other, disturbances of pedestrians and bicycles to vehicles, lost of green time for the beginning and clearance lost time and many more.
In Malaysia there is tremendous increase in population, car ownership and traffic volume in links increases everyday which is causing traffic congestion of different degree in many cites like Johor Bahru and Kuala Lumpur. Traffic signal setting in use is fixed-time for peak and off peak period. Many studies have been conducted on signal timing and the relevance of delays and queues at intersections in Malaysia
At the TermanTaratai signalized intersections along E5 LebuhrayaSkudia-Pontai road, traffic signal operates under staging signal timing i.e 4 stages. Although when the traffic signal lights fail during peak period police officers control traffic movements temporarily till the issue is resolved. This is to be expected. Even when the traffic lights are working properly delays and queues at peak arms are quite high and unacceptable. The signalized intersection operates a four-arm staging sequence at the moment, it can be postulated that a three-phase movement might work better. That has to be tested against a four-arm staging movement for acceptability. After all, it can be argued that the choice of signal timing sequence is a function of traffic directional distribution as well as other competing demand and land use activities in the vicinity.
3
Intersections are a major concern to traffic engineers as a result of conflicting traffic movement and also intersections are major source of vehicle collusion and delay. Stage signal timing involves the allowing of all movement from one arm and every other arm remains red while phase signal timing involves the allowing of movement from two or more arm at the same time and others movement that would result to collusion remain at a halt or are given red. In Malaysia it is strictly stage signal setting hence at the four arm signalized intersection in TermanTaratai along E5 Lebuhrayaskudia –pontia road.
During peak period or hour at the site been consider, traffic congestion, queue especially from 7am till 9am and 5pm till 7pm are been experienced by motorist, it got to a point that a police officer is stationed there to control the traffic and while he does that most times he operates in phase signal timing by allowing all opposing through vehicles at the same time and giving right turning separate right of way. Hence we need to see and investigate if the delay under this type of condition phasing under the same site condition would have a better level of service.
1.3 Objectives
The aim of this study is to compare queues and delays, hence level of service under phase and stage signal control system at TermanTarartaifour arm signalized along E5 LebuhrayaSkudia –Pontain road.
The study objectives are to determine and compare outcomes of the followings: Cycle time for both phase and stage movements
4
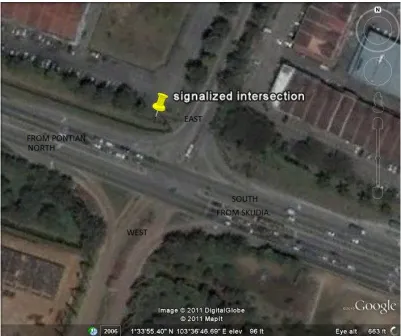
1.4 Study Area
5
6
Figure 1.1 Source:Google earth
1.5 Scope Of Study
7
Collection of field data was done for one day and analysis was based on the level of service achievable under phase and stage assignment of traffic signal setting at the study location.
1.6Significance Of This Study.
This project will help in elucidating the achievable level of service in stage signal timing and three phase signal timing.
1.7Organization Of The Thesis.
The first chapter of the thesis consists of an introduction, objectives, background of the study. The second chapter consists of the literature to the study .Chapter three of the study is on methodology used and it includes the type of data used, equipment and techniques used in the collection of the data.
Chapter 4 focuses on analysis carried out for the study, in Chapter 5 findings were discussed and finally in chapter six conclusions were made and recommendation given.
93
References
Allers S and HJ Stander, 1994. Saturation flow rates at signalized intersections in South Africa. Report No RR 88/208, Department of Transport, Pretoria.
ArahanTeknik (jalan) 13/87.1986.A guide to design of traffic signal,Kualalumpur.JabatanKerja Raya(CawanganJalan)
Bester CJ and PJ Varndell, 2002. The effect of a leading green phase on the start-up lost time of opposing vehicles. South African Transport Conference, Pretoria, 2002. Bonneson J, B Nevers, J Zegeer, T Nguyen and T Fong, 2005. Guidelines for
quantifying the influence of Area Type and other factors on Saturation flow rate. Texas Transportation Institute, College Station, 2005.
C.S. Papacostas and P.D Prevedourous (2008).Transportation Engineering and Planning,thirdedition.Pearson education inc.
Federal Highway Administartion (FHWA website).
http:// cobweb.ecn.purdue.edu/~flm/ce%20361_files/chapter7_notes_pdf
Kidwai and Karim, 2005. Traffic flow analysis of digital count down signalized urban intersection. Proceedings of the Eastern Asia Society for Transportation Studies, Vol 5, pp 1301, 2005.
Mannering Fred.L.,WalterP.Kilareski, Scott S. Washburn.(2004).Principles of Highway Engineering and Traffic Analysis.thirdedition.Johnwiley and sons inc.
94
Transportation Research Board, 2000. Highway Capacity Manual 2000. National Research Council, Washington, D.C., 2000.