Effects of the Different Seismic Input Generation Method and Strong Ground
Motion Duration on the Behavior of a Seismically Isolated NPP Structure
Hyunuk Kim
1, Kwangho Joo
2, Sanghoon Noh
3, and Junsang Yoo
41
Researcher, Central Research Institute of KHNP, Daejeon 305-343, Korea ([email protected])
2
Principal Researcher, Central Research Institute of KHNP, Daejeon 305-343, Korea
3
Senior Researcher, Central Research Institute of KHNP, Daejeon 305-343, Korea
4
General Manager, Civil & Architectural Engineering Team of KHNP, Gyungju 780-935, Korea
ABSTRACT
In this paper, firstly, acceleration-time histories were generated by varying strong motion duration in the frequency domain for application to a seismically isolated nuclear power structure, so as to examine the effects of strong motion duration on the behavior of the structure. Secondly, real recorded earthquakes were modified to match the target response spectrum based on the revised SRP 3.7.1(2007) and the modified time histories were applied to the analysis of a seismically isolated nuclear power structure. The obtained values of acceleration and displacement responses of the structure were, finally, compared with the values obtained in case of applying acceleration-time histories generated in the frequency domain to the structure.
INTRODUCTION
The input motion used in seismic analysis of nuclear power plant structures should be matched to the target response spectrum and has sufficient energy. Further, it is determined by various conditions that reflect the realistic factors of real earthquake. US NRC SRP 3.7.1 (1996) and other international seismic analysis regulations contain various prerequisites related to the generation of input motion, but most of them do not provide specific guidelines on strong motion duration and envelop function.
The revised SRP 3.7.1 of 2007 prohibits the use of acceleration-time histories that have been generated by purely artificial means instead of being based on real recorded earthquakes. In general, frequency content varies over time due to the non-stationary characteristic of real earthquake waves, but this non-stationary characteristic is not taken into account when an acceleration-time history is generated in the frequency domain.
INPUT MOTION GENERATION IN FREQUENCY DOMAIN
Considering the parameters of the trapezoidal envelope function by magnitude ranges specified in ASCE 4-98 (1999) and the minimum strong motion duration of 6 seconds for input motion in US NRC SRP 3.7.1 (1996), the envelop functions can be summarized as shown in Table 1. Here, the strong motion duration (tm) is the time taken for arias intensity, as defined in US NRC SRP 3.7.1, to increase from 5% to 75%. When parameters of the compound envelop function are determined according to energy distribution rate, rise time (tr), decay time (td) and the resulting total duration (Td) differ from those of the trapezoidal envelop function as shown in Table 1. Energy distribution in the tr and td ranges of the compound envelope function was considered by using Eq. 1 and Eq. 2 presented by Jennings et al. (1968).
]
[
21 ) (
P
t
I
t
(1)
) ( ) (
2 P t c
t
e
In this research, acceleration-time histories were matched to the RG 1.60 design response spectrum of US NRC, and five of each following the compound envelope function were generated for each magnitude range as shown in bold in Table 1. The PGA of the generated time histories was 0.3 g. The values in parenthesis represent the parameters of the compound envelope function based on NUREG/CR 6922 (2006).
Table 1: Strong Motion Duration and Envelope Function Parameters for Each Case.
MODELING OF THE STRUCTURE
In this research, the mass and stiffness information of the APR 1400 nuclear power structure was modified to represent translational motion only. The natural frequency in the first mode was 0.19 seconds in the fixed base condition, and 2.0 seconds in case of base isolation.
NONLINEAR TIME DOMAIN ANALYSIS (I)
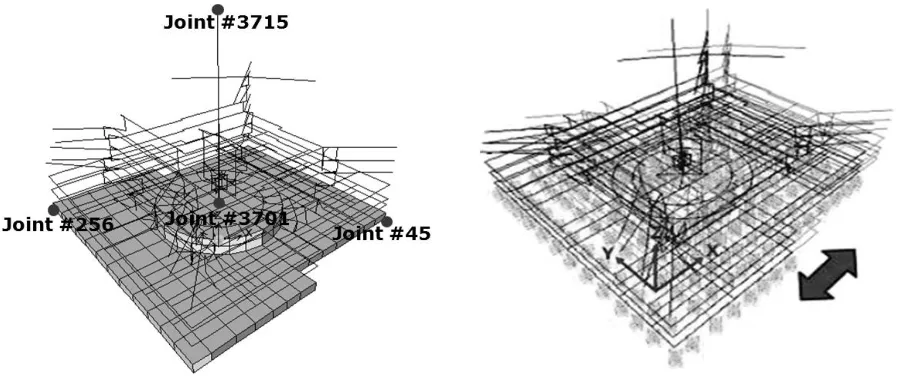
Structural analysis was carried out using totally fifteen acceleration-time histories generated for 3 cases. Based on the median and mean of displacement and acceleration response, the effects of strong motion duration on the response of a seismically isolated nuclear power structure were analyzed. Excitation was applied to a single direction for the target structure. Since the first mode shape was a translation in the x-direction, analysis was limited to x-directional excitation.
Figure 1. the Analysis Model and 1
stMode Shape of the Seismically Isolated Nuclear Power Structure.
During the generation of acceleration-time history, the difference in total duration by case leads to a difference in time interval of acceleration-time histories because the amount of data generated from
M
t
r(sec)
t
m(sec)
t
d(sec)
T
d(sec)
Trap.
Comp.
Trap.
Comp.
Trap.
Comp.
Trap.
Comp.
7.0
∼
7.5
2
2.8
(2.2-3.0)
13
(9.8-12.9)
9
21.6
(-)
24
37.4
(-)
6.5
∼
7.0
1.5
2.1
(1.8-2.2)
10
(7.4-9.8)
7
16.6
(-)
18.5
28.8
(-)
inverse fourier transform in the frequency domain is applied as 2n. To examine the effects of the difference in time interval on acceleration and displacement responses, comparative analyses using each generated acceleration-time history at a time interval of 3.5 ms and 7.0 ms when magnitude was between 6.5 and 7.0 were conducted. As indicated in Table 2, the analysis results for Joint 3715 show that the difference in time interval hardly affects displacement and acceleration response of the target structure.
Table 2: Evaluation of the Effect of the Time Interval on Structural Responses.
No.
Displacement (cm)
Acceleration (g)
Δ
t=3.5 (ms)
Δ
t=7.0 (ms)
Δ
t=3.5 (ms)
Δ
t=7.0 (ms)
M 6.5-7.0
(10 sec)
1
10.4
0.159
2
13.1
0.169
3
13.9
0.167
4
14.0
0.167
5
14.3
14.2
0.169
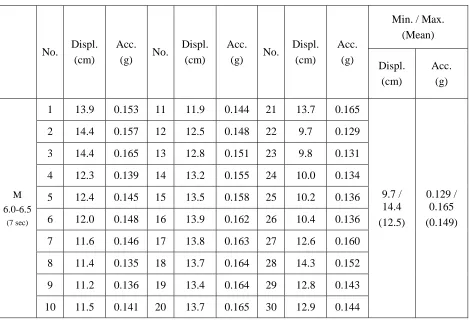
Table 3 shows the results of analyzing a seismically isolated nuclear power structure (Joint 3715) using totally ninety acceleration-time histories generated for 3 cases. Even though the strong motion duration increases, the displacement and acceleration responses did not show remarkable trends. All the results may be due to the limited data, but it can be concluded that longer strong motion duration does not necessarily produce conservative results for artificial time histories, which exceed the minimum requirement of 6 seconds specified in US NRC SRP 3.7.1.
Table 3: Comparison of Responses by Varying Strong Motion Duration
No.
Displ.
(cm)
Acc.
(g)
No.
Displ.
(cm)
Acc.
(g)
No.
Displ.
(cm)
Acc.
(g)
Min. / Max.
(Mean)
Displ.
(cm)
Acc.
(g)
M 6.0-6.5
(7 sec)
1
13.9
0.153
11
11.9
0.144
21
13.7
0.165
9.7 /
14.4
(12.5)
0.129 /
0.165
(0.149)
2
14.4
0.157
12
12.5
0.148
22
9.7
0.129
3
14.4
0.165
13
12.8
0.151
23
9.8
0.131
4
12.3
0.139
14
13.2
0.155
24
10.0
0.134
5
12.4
0.145
15
13.5
0.158
25
10.2
0.136
6
12.0
0.148
16
13.9
0.162
26
10.4
0.136
7
11.6
0.146
17
13.8
0.163
27
12.6
0.160
8
11.4
0.135
18
13.7
0.164
28
14.3
0.152
9
11.2
0.136
19
13.4
0.164
29
12.8
0.143
No.
Displ.
(cm)
Acc.
(g)
No.
Displ.
(cm)
Acc.
(g)
No.
Displ.
(cm)
Acc.
(g)
Min. / Max.
(Mean)
Displ.
(cm)
Acc.
(g)
M 6.5-7.0
(10 sec)
1
10.4
0.159
11
12.2
0.160
21
11.2
0.136
8.5 /
16.6
(12.7)
0.130 /
0.178
(0.154)
2
13.1
0.169
12
12.3
0.160
22
10.6
0.154
3
13.9
0.167
13
12.2
0.160
23
8.5
0.130
4
14.0
0.167
14
16.6
0.176
24
10.7
0.141
5
14.3
0.169
15
16.5
0.178
25
9.5
0.134
6
15.1
0.166
16
11.6
0.135
26
16.5
0.178
7
14.5
0.161
17
11.4
0.138
27
12.5
0.139
8
13.3
0.157
18
10.6
0.142
28
13.6
0.151
9
13.2
0.157
19
11.3
0.139
29
14.5
0.156
10
12.1
0.158
20
11.8
0.140
30
11.6
0.135
M 7.0-7.5
(13 sec)
1
10.3
0.142
11
11.2
0.150
21
10.6
0.144
10.3 /
14.2
(11.5)
0.135 /
0.167
(0.151)
2
11.7
0.135
12
11.1
0.151
22
10.9
0.145
3
13.2
0.159
13
11.1
0.158
23
11.5
0.147
4
13.9
0.166
14
11.4
0.161
24
11.5
0.148
5
14.2
0.167
15
11.7
0.158
25
11.3
0.152
6
11.2
0.147
16
11.7
0.154
26
11.1
0.153
7
10.3
0.140
17
11.6
0.150
27
11.1
0.151
8
12.8
0.153
18
11.5
0.149
28
11.0
0.151
9
12.5
0.155
19
11.4
0.149
29
10.9
0.149
10
12.0
0.153
20
11.3
0.148
30
10.7
0.148
INPUT MOTION GENERATION IN TIME AND FREQUENCY DOMAIN
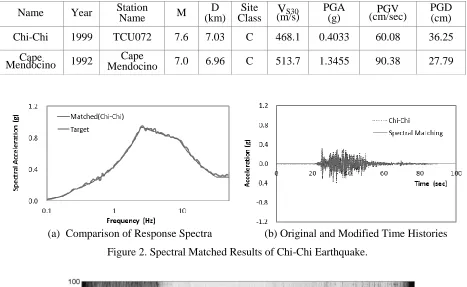
and the response spectra of the time histories have the same amplitude as the target response spectrum in all frequency ranges. In other words, the change in response spectrum (δRi) arising from adding an acceleration-time history δa(t) for modification at a certain time (ti) becomes equal to the difference between the target response spectrum and response spectrum of considered time history (ΔRi). Under this technique, the wavelet function can be seen as the key determinant of δa(t). In this study, RSP Match -09 was used in the matching of acceleration-time histories to the target response spectrum. The wavelet function was an improved tapered cosine wavelet, which does not lead to drifts in velocity and displacement. Based on the 1999 Chi-Chi earthquakes of Taiwan and the 1999 Cape Mendocino earthquakes, the nonstationary spectral matching technique was applied to generate acceleration-time histories to match the US NRC RG 1.60 design response spectrum. The PGA of time-histories was scaled to 0.3 g. Table 4 summarizes the information of real earthquake waves used in this study including station name.
Table 4: Information about Real Earthquake Waves used in this Study
Name
Year
Station
Name
M
(km)
D
Class
Site
(m/s)
V
S30PGA
(g)
(cm/sec)
PGV
PGD
(cm)
Chi-Chi
1999
TCU072
7.6
7.03
C
468.1
0.4033
60.08
36.25
Cape
Mendocino
1992
Mendocino
Cape
7.0
6.96
C
513.7
1.3455
90.38
27.79
(a)
Comparison of Response Spectra (b) Original and Modified Time Histories
Figure 2. Spectral Matched Results of Chi-Chi Earthquake.
(b) Short Time Fourier Transform of Modified Time History
Figure 3. Comparison of Nonstationary Characteristics between Original and Modified Time Histories
Acceleration-time histories were generated in the frequency domain to allow comparison with those generated by the nonstationary spectral matching technique in the time domain. The target response spectrum and strong motion duration (tm) were the common denominator, and the compound envelope function was applied. Rise time (tr) and decay time (td) were determined by the energy distribution rate for an arias intensity of 5-75%. The PGA of the generated acceleration-time histories was scaled to 0.3 g, which coincides with the PGA for those generated in the time domain. The characteristics of the envelop functions are summarized in Table 5.
Table 5: Parameters Determining the Envelope Functions based on Modified Time Histories.
Artificial Time History
t
r (sec)t
m (sec)t
d (sec)T
d (sec)Based on Chi-Chi
3.1
14.4
23.9
41.4
Based on Cape Mendocino
1.1
5.2
8.6
15.0
NONLINEAR TIME DOMAIN ANALYSIS (II)
So as to compare structural responses according to the input generation method, structural analyses were performed for a total of ten acceleration-time histories (five for each modified time history) generated in frequency domain and the other analyses were conducted using two modified acceleration-time histories. Mean and median values were obtained for five acceleration-time histories of each case and the results were compared with the results using each modified time history. During nonlinear time domain analysis, excitation was applied in one direction only. Table 6 shows the analysis results. Compared to artificially generated waves in the frequency domain, both displacement and acceleration response were relatively large when the modified Chi-Chi time was applied to the analysis. On the other hand, the modified Cape Mendocino time history with a strong motion duration of 5.2 seconds resulted in a similar displacement but relatively smaller acceleration.
Table 6: Comparison of the Acceleration and Displacement Responses of the Top Points of the Structure
Time History Generation Method
Mean / Median
Remark
Displacement (cm)
Acceleration (g)
Frequency
Domain
based on Chi-Chi
9.5 / 9.5
0.132 / 0.131
5 Analyses
for Each Case
based on Cape Mendocino
12.9 / 13.2
0.165 / 0.151
Time
Domain
Chi-Chi
14.4
0.158
1 Analysis
CONCLUSIONS
Acceleration-time histories were generated by varying strong motion duration in the frequency domain for application to analyses of a seismically isolated nuclear structure. According to the results, it is found that artificial time histories exceeding the minimum strong motion duration of 6 seconds in US NRC SRP 3.7.1 do not necessarily produce conservative results for longer strong motion durations. Next, spectral matching technique was applied to generate time histories matched to the target spectrum while maintaining the nonstationary characteristics of real earthquakes. Time histories, having the same strong motion duration as the modified time histories, were generated in the frequency domain to compare corresponding responses of the seismically isolated nuclear power structure. For long strong motion durations, the results were fairly conservative due to the inclusion of long period components in the modification process. When the strong motion duration was relatively short, no consistency was observed in the acceleration and displacement responses. From the results, it is concluded that enough total duration is needed to generate acceleration-time histories in time domain unlike the case of generating input motions in frequency domain.
ACKNOWLEDGEMENTS
This work was supported by the Nuclear Research & Development project of the Korea Institute of Energy Technology Evaluation and Planning (KETEP), through a grant funded by the Ministry of Knowledge Economy, Republic of Korea (2011151010010B). This support is gratefully acknowledged.