Automatic Weed Detector and Herbicide
Sprayer Robot
Manisha Joshi[1] , Aishwarya Dhage[2] , Tanuja Bhilare[3] , Roshan Acharya[4] , Avishkar Chawla[5]
Assistant Professor, Dept. of EXTC, V.E.S Institute of Technology, Chembur, Mumbai, India[1] B.E Student, Dept. of EXTC, V.E.S Institute of Technology, Chembur, Mumbai, India[2] B.E Student, Dept. of EXTC, V.E.S Institute of Technology, Chembur, Mumbai, India[3] B.E Student, Dept. of EXTC, V.E.S Institute of Technology, Chembur, Mumbai, India[4] B.E Student, Dept. of EXTC, V.E.S Institute of Technology, Chembur, Mumbai, India[5]
ABSTRACT: The main purpose of our project is to design an algorithm for automatic weed detection using Image Processing along the agricultural field. Weeds compete with crops for sunlight, soil, nutrients and space. Thus, Herbicides are sprayed or spread over the agricultural field to control the weeds. Over 80% of the Herbicides reach a destination other than the required because of which there is an adverse effect on the environment, humans, micro-organisms and crops. The water gets contaminated and causes water pollution. To avoid such an unwanted effect a machine vision system has been developed consisting of a Camera to acquire an image of a part of the field. Then the image is processed in MATLAB where the weeds are detected along with their positions. A Robotic Structure has been developed in CATIA. MATLAB and CATIA are interfaced together. That robotic structure in CATIA has a XY co-ordinate plotter like structure with an arm .The arm reaches the weed position by receiving XY co-co-ordinate values from MATLAB and spray Herbicide on the weeds.
KEYWORDS: Herbicides, MATLAB, CATIA, Wavelet Transform, Biological Morphology Technique.
I. INTRODUCTION
Controlling of weeds is costliest in agricultural field. Herbicides sprayed on weeds creates pollution, affects the environment, animal and human beings. Thus, weeds species need to be controlled in an efficient manner. Today, software and hardware technologies are quickly growing along with production, research, designing, etc. [2]. In this paper an approach to design an algorithm in Image Processing has been developed to detect the weeds with their positions in the image captured by the camera and process in MATLAB and destroy them using Herbicides sprayer to manage the weeds in the agricultural field [1]. Many techniques are available to detect weeds and differentiate them from crops but in this paper Morphological size based feature like area detection has been used. Wavelet Transform Db4 (Daubechies 4) has been used for image compression [5]. Thus, it will reduce the manual labour, provide low production cost and give many benefits to the agricultural field and farmers. Hardware simulation has been done in CATIA software.
II. LITERATURESURVEY
There are basically 3 techniques used to detect weeds in an agricultural field:
A. Biological Morphology Based Technique:
B. Plant Reflectance Based Technique:
Spectral reflectance technique for identification of different plant species is used [7]. Spectrometer is required to record spectral reflectance parameter and characteristics. But cost is higher than the farmer can afford to buy. Plant reflectance is governed by leaf surface properties and internal structure, as well as by the concentration and distribution of biochemical components. Thus remote analysis of reflected light can be used to assess both the biomass and the physiological status of a plant. The features like, variance of the near infrared spectrum, skewness, average gives the high level of accuracy in colour segmentation and detection [1].
C. Visual Texture Based Technique:
This technique includes texture features such as, energy, entropy, contrast, homogeneity and inertia for detection of plant species [7]. A leaf is represented by a pair of local feature histograms, one computed from the leaf interior, the other from the border. Describing the leaf with multi-scale histograms of rotationally invariant features provides a desirable level of invariance which is used for identification of plants. Wavelet Transform Db4 for extracting the texture features of crop and weed images can be used including image compression.
III.METHODOLOGYFORDETECTIONOFWEEDS
A. Image Acquisition:
Digital camera (Web Camera) is used for capturing the part of the agricultural field. The captured coloured image is stored in JPG format. While capturing the images camera is faced towards the ground. Images are captured in the natural sun light condition. Captured images are processed with MATLAB software. The original captured image is as shown in figure 1 consisting of crops and weeds.
Fig. 1. Original Captured Image
B. Excessive Green Colour Detection:
In excessive green colour algorithm soil is removed from the image and only green colour information remains in the image. Here, segmentation of green colour is performed. The algorithm used for detecting the green colour is as follows:
Mask1=Image1(:,:,2)>Image1(:,:,1)&Image1(:,:,2) >Image1(:,:,3);
Image2 = Image1 .* Mask1(:,:,[1 1 1]);
Fig. 2. Segmented Image
C. Image Enhancement:
Coloured image is converted into grayscale image i.e rgb to gray conversion is performed as shown in figure 3. After that noise (salt and pepper) in the grayscale image is removed by using the median filter as shown in figure 4. Then Intensity is adjusted as shown in figure 5 and the image is converted into a binary image as shown in figure 6.
Fig. 3. Grayscale Image Fig. 4. Filtered Image
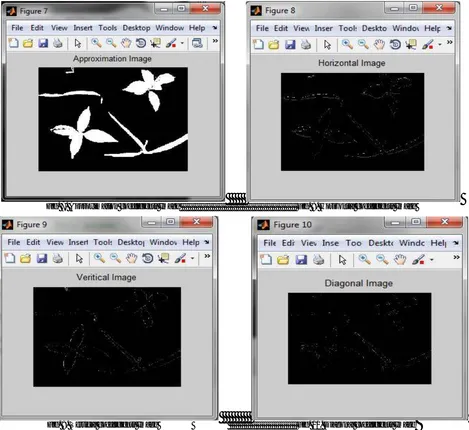
D. Wavelet Transform:
Wavelet Transform is used for a multi-resolution analysis [3] [6]. Wavelet Transform has advantage over a Fourier Transform. In the proposed system Discrete Wavelet Transform is used for compression. Here, Db4 (Daubechies 4) is used to extract approximation, horizontal, vertical and diagonal coefficients as shown in figures 7,8,9 and 10 respectively of the image out of which approximation coefficients are used.
Fig. 7. Approximation coefficients Image Fig. 8. Horizontal coefficients Image
Fig. 9. Vertical coefficients Image Fig. 10. Diagonal coefficients Image
E. Differentiating crops and weeds:
In our proposed system we have considered common garden weeds with narrow leaves and crops with the big and broad leaves as shown in the figure 1. Crops can be of Colocasia, Sunflower, Soyabean, Mung Bean plants, etc. depending on the farmer and the agricultural field.
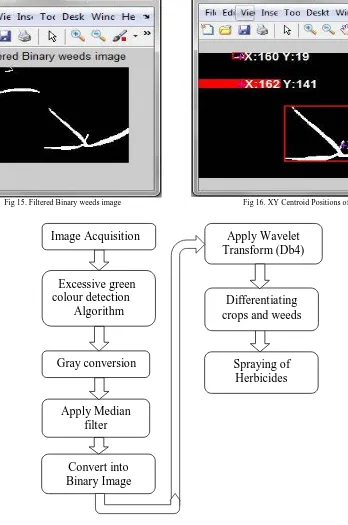
As shown in figure 11, the plants with red colour bounding box are represented as crops and the plants with green colour bounding box are represented as weeds. Only Binary weeds image and Binary crops image are shown in figure 12 and figure 13 respectively. After masking of the crops as shown in figure 14 the XY centroid positions of the weeds are calculated in the binary weeds image as shown in the figure 16. Median filtering is used to remove the small white binary dots in the binary weeds image as shown in figure 15. These small white dots are not weeds in real. To reduce more computations they are removed using median filtering. Then, Herbicide is sprayed on the weeds.
Fig 11.Differentiating crops and weeds Fig 12.Binary weeds
Fig 15. Filtered Binary weeds image Fig 16. XY Centroid Positions of the weeds
Fig. 17. Flowchart of the detection method
Summary of the flow of detection of weeds is shown in the figure 17.
Gray conversion
Convert into
Binary Image
Apply Median
filter
Excessive green
colour detection
Algorithm
Image Acquisition
Apply Wavelet
Transform (Db4)
Differentiating
crops and weeds
IV.PROPOSEDSYSTEM
A. Block Diagram:
Field
Fig. 18. Block Diagram of the proposed system
In the proposed system as shown in figure 18. The web camera captures the coloured image of the part of the agricultural field and passes it further to the MATLAB software to perform Image Processing. After differentiating crops and weeds in the image the XY centroid positions of the weeds are calculated in MATLAB. These values are passed from MATLAB to CATIA simulation software via a linking interface between them. CATIA (an acronym of computer aided three-dimensional interactive application) is a multi-platform software suite for computer-aided design (CAD), computer-aided manufacturing (CAM), computer-aided engineering (CAE), PLM and 3D, developed by the French company Dassault Systemes. CATIA enables the creation of 3D parts, from 3D sketches, sheet metal, composites, molded, forged or tooling parts up to the definition of mechanical assemblies. The robotic structure in CATIA consisting of XY plotter will move its arm towards the XY co-ordinate to spray Herbicide on the weeds.
B. CATIA Simulation Result:
Fig 19. Initial position of the arm (Sprayer) Fig 20. Herbicide sprayed on the weeds reaching at one co-ordinate.
CAMERA
Moving Arm
at XY
position of
Weed
MATLAB
The area covered by the XY plotter is equal to the area of the image captured by camera. The red coloured structure in the XY plotter is the sprayer which sprayes Herbicide on the weeds and the horizontal rod like structure provides support and movement to the sprayer. After accepting the XY co-ordinate values, the rod moves in X direction and the sprayer moves in Y direction and stops at that point to spray Herbicide.Figure 19 shows the initial position of the arm of the XY plotter structure whereas figure 20 shows the later position of the arm after taking inputs of XY co-ordinate values from MATLAB.
V. CONCLUSION AND FUTURE WORK
In our proposed system, an approach has been made to help farmers to reduce labour cost and improve productivity by creating an algorithm in Image Processing. After segmenting green information from the image, it is processed and enhanced further for better results in computation. Wavelet transform Db4 has been used to compress the image and approximation coefficients from the four (approximation, horizontal, vertical and diagonal coefficients) has been used for further processing. Crops and weeds are differentiated based on the morphological size based technique. After testing 15 samples ,12 samples gave proper results. The crops are masked in the image. The XY centroid positions of the weeds are calculated and passed to CATIA for simulating. The arm of the robotic structure reaches at that XY position and spray Herbicides on the weeds.
This system can be improved more by creating separate databases for crops and weeds images and comparing them. Along with size, texture feature extraction may provide more accuracy. It can also be implemented for different types of crops and weeds in the agricultural field.
ACKNOWLEDGMENT
WE are thankful to our Head of the Department Mrs. Shoba Krishnan and project guide Mrs. Manisha Joshi for their guidance and support in the completion of this project.
REFERENCES
1. Amruta A. Aware ,Kavita Joshi , “ Crop and Weed Detection Based on Texture and Size Features and Automatic Spraying of Herbicides, International Journal of Advanced Research in Computer Science and Software Engineering,”, Volume 6, Issue 1, January 2016.
2. Dr. Pusphavalli M, ChandralekaR , “Automatic Weed Removal System using Machine vision” , International Journal of Advanced Research in Electronics and Communication Engineering (IJARECE) Volume 5, Issue 3, March 2016.
3. D.Ashok Kumar , P.Prema ,“A Study on Weed Discrimination through Wavelet Transform, Texture Feature Extraction and Classification”, International Journal of Computer Science & Information Technology (IJCSIT) Vol 7, No 3, June 2015.
4. Hong Y. J., Lei F. T., Heping Z, “Robust Crop and Weed Segmentation under Uncontrolled Outdoor Illumination, Sensors”,11,6270-6283,2011.
5. Sajad Kiani1, Zohreh Azimifar, Saadat Kamgar,”Wavelet based Crop Detection and Classification”, ICEE 2010, may 11-13, 2010 IEEE. 6. Lanlan W, Youxian W, Xiaoyan D, Hui P, “Identification of Weed/Corn using BP Network based on Wavelet Features and Fractal Dimension”,
Scientific Research and Essay Vol.4 (11), pp. 1194-1200, 2009.
7. Kamal N. Agrawal , Karan S, Ganesh C. Bora, Dongqing Lin, “Weed Recognition Using Image- Processing Technique Based on Leaf Parameters”, Journal of Agricultural Science and Technology 899 908,2012.
8. Tehran, iran,“Automatic Weed Detection System and Smart Herbicide Sprayer Robot for Corn Fields”, Proceedings of the 2013 RSI/ISM international conference on robotics and mechatronics, February 13-15, 2013IEEE.
BIOGRAPHY
Aishwarya Dhage currently pursuing B.E in EXTC dept. from V.E.S Institute of Technology, Chembur, Mumbai.
Tanuja Bhilare currently pursuing B.E in EXTC dept. from V.E.S Institute of Technology, Chembur, Mumbai.
Roshan Acharya currently pursuing B.E in EXTC dept. from V.E.S Institute of Technology, Chembur, Mumbai.