ABSTRACT
HIRONS, NATALIE LIANNE. Estimating Chronic Exposure to Steroid Hormones in Water. (Under the direction of Damian Shea.)
Ecological risk assessment (ERA) is a useful process contributing to safeguarding the earth’s ecosystems. Exposure assessment is a vital component of ERAs, as chemical exposure information is used to make decisions involving ecological risk. So, the continued advancement of sampling methodology is essential to better understanding chemical
exposure. While traditional sampling methodologies, including grab sampling, only capture a snapshot of exposure, the development of passive sampling devices (PSDs) has allowed for estimations of chronic contaminant exposure. For many emerging contaminants,
including many endocrine disruptors, determining chronic exposure is pertinent to assessing toxicological risk, and unlike current available sampling methodologies that tend to target specific classes of compounds, a more universal PSD (uPSD) is necessary to capture both hydrophobic contaminants and more hydrophilic contaminants, such as steroid hormones.
In this work, two novel PSDs, a cartridge uPSD and a fiber uPSD, were evaluated as tools to improve our understanding of chronic exposure to steroid hormones, namely
contamination of surface waters via wastewater effluent, increased hormone monitoring efforts have revealed the presence of hormones in surface waters. The goal of this work was to develop novel surface-water monitoring tools to quantitatively assess chronic exposure to free estrogens and androgens.
Both the cartridge uPSD and fiber uPSD contained the same polymeric sorbent, Oasis HLB®; however the cartridge uPSD consisted of a porous, stainless steel casing, while the fiber uPSD consisted of a polyethersulfone membrane. Both devices were calibrated in the laboratory using an uptake experiment, in order to determine sampling rates for all hormones, and an elimination experiment, to determine the effect of flow rate on elimination and to evaluate the suitability of using performance reference compounds (PRCs) during in situ applications.
Over the 30-day uptake experiment, all hormones remained in the linear uptake phase for both devices, demonstrating that both devices have the capacity to function as time-integrative devices. Sampling rates for the cartridge uPSD ranged from 0.09 – 0.11 L/d, and sampling rates for the fiber uPSD ranged from 0.04 – 0.09 L/d. Neither device
demonstrated clear correlations of sampling rates to log Kow values; however calibrations of both devices to contaminants with expanded ranges of log Kow values is necessary to
confirm these results.
In the 30-day elimination experiment, neither device demonstrated any effect of flow rate on elimination rate; however, for two hormones, estrone and androstenedione, a
however, PRCs may be necessary to monitor changes in uptake due to biofouling or temperature in situ.
The final component to validating the use of both devices included field deployments in surface waters receiving inputs from wastewater treatment plants and concentrated animal feeding operations. Mean estimated water concentrations from cartridge uPSD and fiber uPSD residues were in general agreement with mean grab sample mean concentrations of surface waters.
Estimating Chronic Exposure to Steroid Hormones in Water
by
Natalie Lianne Hirons
A thesis submitted to the Graduate Faculty of North Carolina State University
in partial fulfillment of the requirements for the Degree of
Master of Science
Toxicology
Raleigh, North Carolina 2009
APPROVED BY:
____________________________ _____________________________ Chris S. Hofelt, PhD Patricia McClellan-Green, PhD
Committee Member Committee Member
____________________________ Damian Shea, PhD
DEDICATION
BIOGRAPHY
With a family nickname like “Miss Chievous,” her innate curiosity was obvious by the age of two. Though somewhat tempered since her kitten-swimming-lessons-in-the-toilet days, that same innate curiosity has been a driving force in her life, and paired with father and grandfather engineers, it is not surprising that her educational path led to the field of science.
Upon completion of the International Baccalaureate Programme at Marietta High School, Marietta, Georgia, Natalie pursued a degree in Environmental Health Science at the University of Georgia in the College of Public Health. The range of exposure in coursework piqued her interest in a multidisciplinary approach to science, aiming to understand how human populations affect their environment, in turn how those environmental changes affect ecosystems and human health, and ultimately what, if any, action is necessary to mediate those alterations. In her third year, she took a course that gave a name to her previously faceless interest, Environmental Toxicology. Under the mentorship of Dr. Mary Alice Smith, Natalie decided to pursue a graduate career in toxicology.
The summer of 2006 marked a culminating point in her life, with the completion of her B.S.E.H., marriage, and a move seven hours away from her childhood home to
ACKNOWLEDGEMENTS
I would like to begin by extending my gratitude to Dr. Mary Alice Smith for planting the seed of toxicology in my learning experience. Her class inspired the direction of my graduate studies.
This work would not be accomplished without the support and wisdom of my advisor, Damian Shea, and committee members, Chris Hofelt and Pat McClellan-Green, thank you. I would also like to thank Greg Cope for keeping the door open to my questions, my technical support team and lab members, Norman Glassbrook, Peter Lazaro, Kelly O’Neal, Xiang Kong, and Xin Rui-Xia, lending both technical expertise and open ears to weekly troubles and joys, and another thank you to my fellow “tox” buddies for their support.
TABLE OF CONTENTS
Page
LIST OF TABLES ……….. vii
LIST OF FIGURES ………viii
INTRODUCTION ……….. 1
Environmental Exposure………... 1
Chronic Toxicity and Effects……… 5
Passive Sampling Devices………. 9
References………. 15
Tables……… 27
CHAPTER 1: Calibration and Field Verification of a Cartridge-Based Passive Sampling Device for Estimating Chronic Exposure to Steroid Hormones in Water………... 31
Abstract ……… 32
Introduction ……….. 33
Experimental Section ……… 36
Materials ………... 36
Uptake Experiment ………... 37
Elimination Experiment ……… 38
Field Set-Up and Sample Collection ……….38
Sample Processing ……… 39
Instrumental Analysis ……….. 40
Quality Control ……… 41
Results and Discussion ……….. ……. 41
Uptake Curves ………. 41
Sampling Rates ……… 43
Elimination Rate Constants ………. 44
Performance Reference Compounds ……… 45
Field Verification ………. 46
References ………... 50
Tables ………... 55
Figure Legends……….. 58
Figures ………. 59
CHAPTER 2: Development and Field Validation of a Fiber-Based Passive Sampling Device for Measuring Free Estrogens and Androgens in Surface
Waters………. 68
Abstract ……….. 69
Introduction ………. 70
Experimental Section ……….. 72
Chemicals and Materials……….. 72
Fiber-uPSD Construction and Preparation ………. 73
Uptake Experiment ……….. 73
Elimination Experiment ………... 74
Field Set-Up and Sample Collection ……… 74
Sample Processing ……… 75
Instrumental Analysis and Quality Control ………. 76
Results and Discussion ……….. ……. 77
Calibration Experiment ……… 77
Elimination ………... 82
Field Validation ..……….. 85
Conclusion ……… 87
References ……… 88
Tables ………... 94
Figure Legends ………. 97
Figures ……….. 98
CONCLUSION ………. 103
APPENDICES………... 106
Appendix A. Fiber uPSD Uptake Curves………... 107
LIST OF TABLES
Page
INTRODUCTION
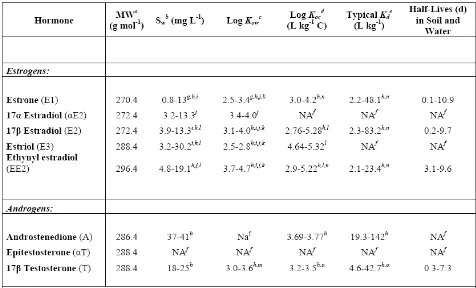
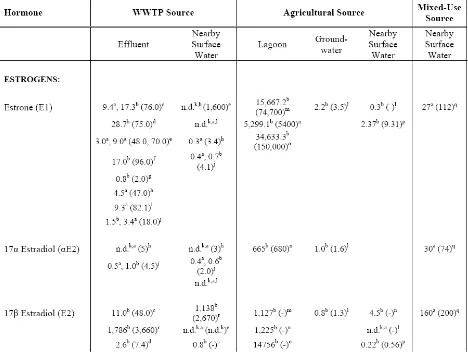
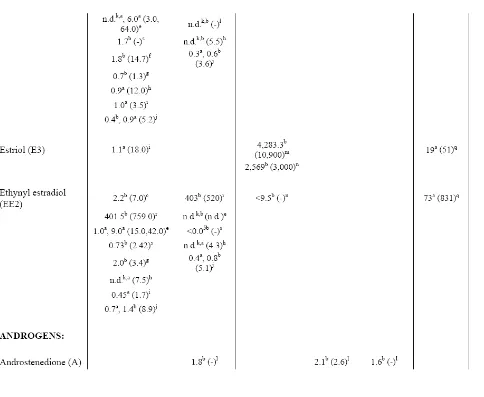
Table 1. Selected Physicochemical Properties of Steroidal Hormones ……….. 27 Table 2. Selected Examples of Steroid Hormone Median or Mean (Maximum)
Concentrations ………. 28
CHAPTER 1: Calibration and Field Verification of a Cartridge-Based Passive Sampling Device for Estimating Chronic Exposure to Steroid Hormones in Water
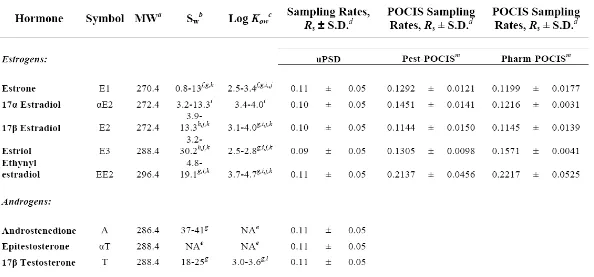
Table 1. Summary of Sampling Rates and Select Physicochemical Properties of
Steroid Hormones ……… 55
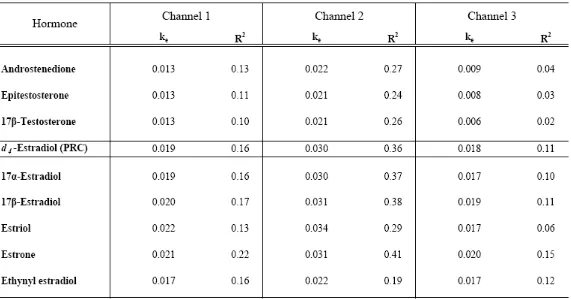
Table 2. Summary of Elimination Rates (ke, d-1) of Steroid Hormones under
Different Flow Velocities: Channel 1 (~ 30 cm s-1), Channel 2 (~ 15 cm s-1), and
Channel 3 (~ 7.5 cm s-1) ……….. 56
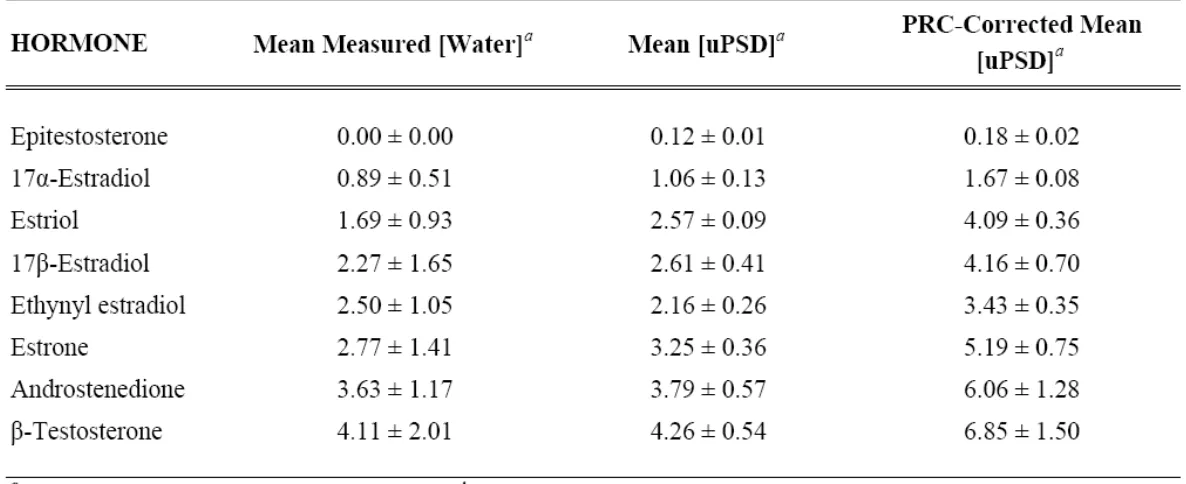
Table 3. Mean Water Concentrations Measured from 7 Grab Samples, Estimated
from Triplicate Cartridge uPSD Residues, and Estimated Using a PRC Correction
from Triplicate Cartridge uPSD Residues ……… 57
Table SI 1. Summary of Chromatographic and Mass Spectrometric Parameters Used
to Identify and Quantify Hormones During Analysis ……….. 64
CHAPTER 2: Development and Field Validation of a Fiber-Based Passive
Sampling Device for Measuring Free Estrogens and Androgens in Surface Waters
Table 1. Summary of Physicochemical Properties and Sampling Rates (L/d) for
Steroid Hormones ……… 94
Table 2. Elimination Rates (ke, 1/d) of Hormones Subject to Different Flow
Conditions: Channel 1 (~ 30 cm/s), Channel 2 (~ 15 cm/s), and
Channel 3 (~ 7.5 cm/s)……….. 95
Table 3. Mean Water Concentrations Measured from 7 Grab Samples and Estimated
LIST OF FIGURES
Page
CHAPTER 1: Calibration and Field Verification of a Cartridge-Based Passive Sampling Device for Estimating Chronic Exposure to Steroid Hormones in Water
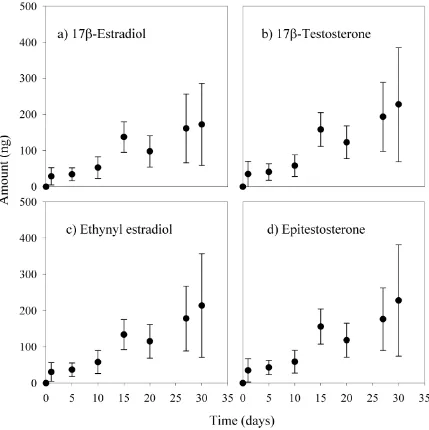
Figure 1. Uptake curves for four representative steroid hormones, two estrogens and
two androgens: 17β-estradiol, ethynyl estradiol, epitestosterone, and 17β-testosterone. (●)s represent means, and vertical lines represent standard deviations (n = 3) of
cartridge uPSD samples ………... 59
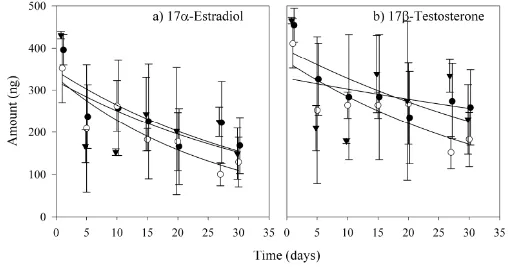
Figure 2.Elimination curves of two representative steroid hormones, one estrogen
and one androgen: 17β-estradiol and epitestosterone, subject to three different flow velocities: 30 cm/s in channel 1 (●), 15 cm/s in channel 2 (○), and 7.5 cm/s in
channel 3 (▼) ………... 60
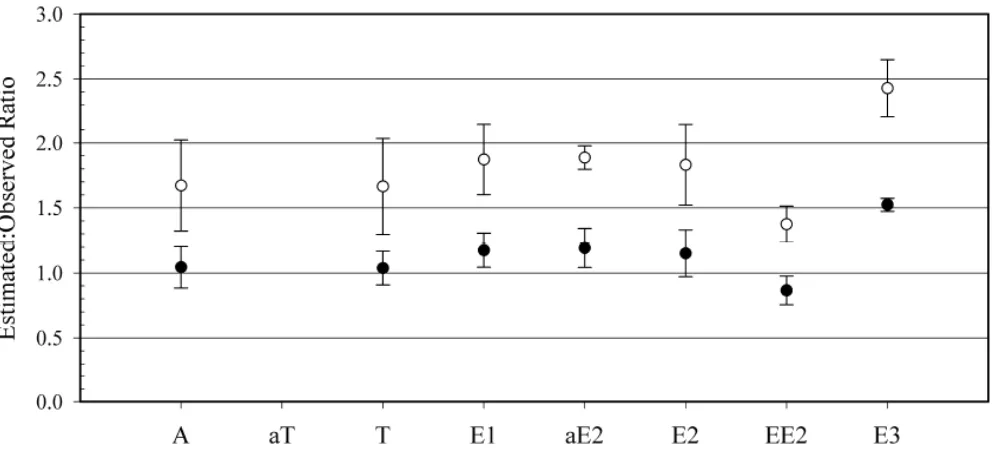
Figure 3. Ratio of freely dissolved steroid hormone concentrations derived from
cartridge uPSD residues (predicted) to that measured in filtered water downstream from municipal wastewater treatment plant with (○) and without corrections using
PRCs (●) ………. 61
Figure 4. Mean surface water estrogen concentrations (ng/L) measured from grab
samples near a concentrated animal feeding operation, n = 15, (○), and estimated from cartridge uPSD residues, n = 3, (●), with vertical bars representing standard
deviations ………. 62
Figure SI 1. Uptake curves for 8 steroid hormones, 5 estrogens and 3 androgens:
estrone, 17α-estradiol, 17β-estradiol, estriol, ethynyl estradiol, androstenedione, epitestosterone, and 17β-testosterone. (●) represent means, and vertical lines
represent standard deviations (n = 3) of cartridge uPSD samples ……… 66
Figure SI 2.Elimination curves of 8 steroid hormones, 6 estrogens and 3 androgens:
estrone, 17α-estradiol, 17β-estradiol, estriol, ethynyl estradiol,
17β-estradiol-2,4,16,16-d4 (PRC), androstenedione, epitestosterone, and
CHAPTER 2: Development and Field Validation of a Fiber-Based Passive
Sampling Device for Measuring Free Estrogens and Androgens in Surface Waters
Figure 1. Uptake curves for three representative steroid hormones: 17α-estradiol,
estriol, and androstenedione. The symbol, (●), represents mean values, and vertical lines represent standard deviations (n = 3) of fiber uPSD samples ………. 98
Figure 2. Correlations between sampling rates (Rs; mean (●) ± standard deviation)
and octanol-water partition coefficients (log Kow) for all steroid hormones in this
study ………. 99
Figure 3. Elimination curves of two representative steroid hormones, one estrogen
and one androgen: 17β-estradiol and epitestosterone, subject to three different flow velocities: 30 cm/s in channel 1 (●), 15 cm/s in channel 2 (○), and 7.5 cm/s in
channel 3 (▼) ………. 100
Figure 4. Comparison of mean concentrations of hormones measured from 7 filtered
grab samples of water (○) to that estimated from triplicate fiber uPSD residues (●). Vertical lines represent standard deviations based on triplicate values ………. 101
Figure 5. Mean surface water estrogen concentrations (ng/L) measured from grab
samples near a confined animal feeding operation, n = 15, (○), and estimated from fiber uPSD residues, n = 3, (●), with vertical bars representing standard
INTRODUCTION
1. Environmental Exposure
Sources
The scientific community has become increasingly aware that many compounds released into the environment have the potential to block or mimic the actions of sex steroids (1, 2). So, the possibility of agonistic or antagonistic activity is potentially dangerous
because sex steroids, particularly androgens and estrogens, irreversibly program aspects of sexual differentiation and reproduction early in development (3). Ultimately, exposure to exogenous steroid hormones, even at low levels, during these susceptible windows can result in detrimental and irreversible alterations in development and potentially, reproductive success of the population (4, 5).
Aquatic inputs of hormones chiefly derive from agricultural sources, either due to runoff from waste-amended fields or waste lagoon spills, or municipal waste sources, in effluent from wastewater treatment plants (WWTP) or sewage treatment plants (STP) (6-10).
Over the past 20 years, large-scale concentrated animal feeding operations (CAFOs) have flourished for the space- and resource-efficient production of meat. CAFOs are
protect the Nation’s water quality. CAFOs are a major source of release of bioactive steroidal compounds (6, 8, 11).
Estrone, 17α-estradiol, and 17β-estradiol are the most abundant forms of parent
estrogens released into the environment by CAFOs (2, 8, 12). Estrogens are largely
eliminated by swine and poultry in urine (70-99%) (13, 14), indicating that these compounds are released as polar, glucuronic acid or sulfate, conjugates (8, 15, 16). Polar conjugates are significantly more mobile in aqueous environments than their parent compounds and may facilitate the transport of estrogens from CAFOs to surface waters. Once in receiving waters, conjugated estrogens can undergo biotic or abiotic hydrolysis yielding a highly estrogenic parent compound (10, 17). Unlike swine and poultry, cattle typically excrete estrogen in feces, largely as unconjugated, or free, estrogens which are less mobile in aquatic environments (13).
Among the androgens, 17α-testosterone, 17β-testosterone, and androstenedione are
most commonly associated with CAFOs (12). Like estrogens, androgens are eliminated from swine predominantly as polar conjugates which would enhance their environmental mobility and transport to surface waters (14).
Unlike CAFOs, surface water contamination of natural and synthetic hormones by WWTPs is not a recent phenomenon. However, only in the past two decades when
employed, resulting in varying removal efficiencies among treatment facilities, one study estimated that ~ 20% of human-derived estrogens survive standard sewage treatment (18).
The most abundant forms of estrogens released by WWTPs include the parent forms of natural estrogens, estrone (E1) and 17β-estradiol (E2), and the synthetic oral
contraceptive, ethynyl estradiol (EE2) (19, 20). These natural and synthetic estrogens enter WWTPs as polar, primarily glucuronic acid, conjugates, which results in enhanced mobility in the aquatic environment (21).
Similar to CAFO-derived androgens, the most common androgens associated with WWTP effluent are 17α-testosterone, 17β-testosterone, and androstenedione, although
significantly less work has been done on environmental androgens (22, 23). Like estrogens, androgens enter WWTPs primarily as glucuronic acid conjugates, to a lesser extent sulfate conjugates, and are released as free androgens, chiefly due to transformation by bacteria concurrent in wastewater influent (21, 24). However, studies have demonstrated major removal of androgens from effluent in conventional wastewater treatment processes (22-24). Regardless of their source (CAFO or WWTP), all androgens and estrogens have the
free hormones, particularly testosterones, are largely removed via sludge in wastewater treatment (24). Androgens and estrogens have moderately high partitioning coefficients (log Kow values ~ 3-4), and therefore can be sorbed to sediments or suspended organic material (Table 1). In soil, sludge, or sediment, there is the potential for biological uptake,
degradation and transformation to less mobile or more mobile forms (11). So, while polar conjugates have increased aqueous mobility, bacterial deconjugation could result in free steroids released to the aquatic environment. In summary, estrogens and androgens contaminate the environment from CAFOs and WWTPs largely as parent compounds, hydroxylated derivatives, or polar conjugates, with environmental polar compounds being the most mobile and the parent compound being the least mobile.
Environmental Concentrations
Reported values of estrogens and androgens in surface waters downstream of CAFOs and WWTPs widely vary (Table 2). However, concentrations in WWTP effluent can be translated to rough environmentally-relevant averages. Reported WWTP effluent mean concentrations for estrogens range from non-detects – 1.8 μg/L, with maximum
than for androgens. Average lagoon concentrations of estrogens range from 9.5 – 34.6 μg/L, with maximum concentrations of 150 μg/L measured. Average concentrations of estrogens in surface waters near CAFOs range from non-detects to 2.4 ng/L, with maximum
concentrations reported at 9.3 ng/L, and nearby groundwater averages ranging from 0.8 – 2.2 ng/L with maximums reported at 3.5 ng/L. Both groundwater and surface water concentrations of androgens near CAFOs exhibit average and maximum values in the low nanogram-per-liter range (0.6 – 5.0 ng/L). Surface waters receiving mixed-use impacts have average estrogen concentrations ranging from 19 – 160 ng/L with maximum concentrations reported at 831 ng/L and average androgen concentrations at 116 ng/L with reported
maximums as high as 214 ng/L.
2. CHRONIC TOXICITY & EFFECTS
Biochemical to Individual Level
Contamination of surface waters with natural and synthetic steroid hormones chiefly arises from agricultural uses for efficient growth promotion in animals and from humans naturally and for contraception and various hormone replacement therapies. In addition to understanding environmental exposure to steroid hormones, understanding the levels and time points at which aquatic organisms are impacted is essential to protecting critical populations and ultimately, ecosystem integrity.
Organisms susceptible to impacts by steroid hormones primarily include vertebrates, although some invertebrates, such as select mollusks, are also susceptible. This vulnerability is due to the presence or absence of an estrogen or androgen receptor, as exogenous
organism expressing the estrogen or androgen receptor is susceptible to impacts from exogenous estrogens or androgens. The general mechanism of action for estrogens and androgens involves entry of the hormone into the nucleus, first crossing the cell membrane into the cytosol, binding to its associated receptor at the ligand-binding domain and crossing the nuclear membrane. This ligand-receptor complex then binds to DNA estrogen or
androgen response elements via the receptor’s DNA-binding domain and with the recruitment of other transcription-associated proteins, controls gene expression, either upregulating or downregulating associated genes (31).
As stated above, the most common parent estrogens and androgens released into the environment include estrone, 17α-estradiol, and 17β-estradiol and 17α-testosterone
(epitestosterone), 17β-testosterone, and androstenedione, respectively (2, 8, 12, 19, 20). However, all estrogens do not equally activate the estrogen receptor with the same potency, and likewise, not all androgens activate the androgen receptor with equal potency. Hence, hormones are measured in toxicity equivalents (TEQs) based on their relative activation of their associated receptors to the most potent natural hormone. For instance, 17β-estradiol is the most potent natural estrogen, having a TEQ of 1.0, and all other natural estrogens have a TEQ ≤ 1.0 due to lower potencies (8). However, synthetic hormones, such as ethynyl
At the biochemical level, numerous studies have demonstrated altered levels of circulating androgens or estrogens upon exposure to exogenous hormones (5, 32-35). In a short-term in vivo study exposing juvenile male turbot (Psetta maxima) to 3.5 ng/L of EE2, altered sex steroid profiles were observed in males with androgen to estrogen hormone ratios in the testes and plasma reaching values observed in females (35). Another study exposing male zebra fish to EE2 demonstrated decreased levels of circulating androgens (33). Conversely, female fathead minnows (Pimephales promelas) exposed to 17α- and 17β -trenbolone, synthetic androgens used in primarily in beef cattle growth production, demonstrated altered plasma hormone profiles and decreased production of vitellogenin (VTG), a female egg yolk precursor protein (5, 32, 34). VTG synthesis is an estrogen receptor–mediated response, which occurs naturally in female fish following endogenous estrogen exposure through blood plasma (36). So, in studies where male fish have been exposed to the strong estrogen agonist, EE2, VTG induction in has been observed (30, 37). Additionally, alterations in secondary sex characteristics have been observed upon exposure to exogenous hormones (32, 34). For instance, female fathead minnows exposed to 17α- and 17β-trenbolone develop the typically-male secondary sex characteristics of dorsal (nuptial) tubercles (32, 34), and while these changes in secondary sex characteristics do not directly impact reproduction capabilities, there is potential for alterations in sexual or mating behavior as a result.
effects, including endpoints such as survival, growth, and reproduction, relate more closely to population-level effects (5). One study, however, attempted to demonstrate a predictive link between biochemical observations and population-level effects (5). In this study, fecundity was predicted by observed VTG production based on the established link between VTG production in female fish and egg production. Other studies, focused on individual-level effects, have demonstrated alterations in development and reductions in reproductive success upon exposure to exogenous hormones (33, 38-40). Particularly, reduced fecundity in female fathead minnows upon exposure to < 3 ng/L 17α- and 17β-trenbolone has been observed (32, 34). Numerous studies have focused on the effects of the synthetic estradiol, EE2, in male fish (33, 38-40). A no-observed-effects-concentration (NOEC) based on growth, survival, and reproductive endpoints in the male fathead minnow was determined to be 1.0 ng/L (39). Another study demonstrated altered reproductive hierarchies through the disruption of sexual selection in group-spawning zebrafish when exposed to
environmentally relevant concentrations of EE2 (33). Two lifecycle studies demonstrated demasculinization through gonadal feminization of males and a decrease egg fertilization success following exposure to < 1 ng/L and 3 ng/L of EE2, respectively (38, 40).
low-level, chronic exposure would adversely impact the sustainability of wild fish populations (4). The results of this study demonstrated that chronic exposure of the fathead minnow to low EE2 concentrations led to feminization of males (VTG production, intersex), altered reproduction in females (oogenesis disruption), and a near extinction of the fathead minnow from the lake. Hence, exposure to low, environmentally-relevant concentrations of
exogenous hormones can impact sustainability of wild fish populations.
3. PASSIVE SAMPLING DEVICES
With the understanding that EDCs, like steroid hormones, have the potential to cause irreversible alterations in organism development and reproduction when exposure is chronic at low nanogram-per-liter levels, the ability to detect and quantify low-level, chronic
exposure is very important to protecting the integrity of ecosystems impacted by EDCs. Traditional contaminant monitoring methods include grab sampling, which involves the collection of a water sample, transport to laboratory facilities, extraction, and analysis to give an estimated aqueous concentration, and biological sampling, which involves the collection of native or transplanted organisms, transport to laboratory facilities, sacrifice and extraction, and analysis. Grab sampling can be a limiting method of environmental
chemical within the sample, which may not be representative of the bioavailable fraction of the chemical in that sample.
Although biological samples potentially allow for a measure of bioavailable exposure to chemicals, they present their own limitations as well. Sampling of native organisms leaves a large uncertainty in exposure history and may be restrictive due to endangerment of certain species. Regardless of using native or transplanted organisms, biological samples may miss exposure to non-bioaccumulative compounds or may not account for chemical metabolism or depuration in the organism, ultimately leading to uncertainty in how well measured exposure correlates to actual exposure (42). Other potential points of uncertainty include intra-species differences in organism metabolic rate, health, and other behaviors, including extent of locomotion, feeding, and mating or
reproduction.
A tool to overcome the limitations of grab sampling and biological sampling is the passive sampling device (PSD), which is a device that passively accumulates and
concentrates contaminants over time to give a time-weighted-average (TWA) estimate of chronic exposure. Contaminants passively diffuse into the PSD until a steady-state condition, or equilibrium is reached. Hence, uptake curves for PSDs are logarithmic,
measure of the sampling rate of the device, measuring the volume of water quantitatively sampled per unit time (L/d), and are determined using the following equation,
Rs = Nt / Cw t (1) where Rs is the sampling rate (L/d), Nt is the amount (ng) of analyte accumulated in the
sampler at the end of exposure, time in days, Cw is the average concentration of freely-dissolved analyte in water (ng/L), and t is the duration of the exposure measured in days (44).
In field samples, estimates of chronic exposure (Cw) can be determined by rearranging equation 1 as follows,
Cw = Nt / Rs t (2) where Nt is the amount (ng) of analyte in the PSD at the end of the deployment period, t, in
days, Rs is the laboratory-derived sampling rate (L/d), and t is the duration of the deployment in days (44).
compounds that share similar chemical properties to analytes of interest (46). PRCs are added to samplers prior to deployment and elimination over the duration of deployment is monitored. So, with the understanding of isotropic exchange kinetics, changes in elimination rate of PRCs are proportional to changes in uptake rate of targeted analytes (46-48).
Release kinetics of compounds from PSDs can be modeled assuming first-order release kinetics using the following equation (47),
Nt = N0 × e(-ket) (3)
where Nt is the amount (ng) of PRC remaining in the sampler at time t in days, N0 is the amount (ng) of PRC initially loaded into the sampler, ke is the elimination or exchange rate constant (d-1), and t is the time in days.
Hence, field ke values for PRCs can be compared to laboratory-derived ke values for PRCs through an environmental adjustment factor (EAF), which is calculated using equation 4 (46),
EAF ≡ kePRC-f / kePRC-cal (4)
where kePRC-f represents the PRC elimination rate constant in the field (d-1) and kePRC-cal represents the PRC elimination rate constant determined in a laboratory calibration
experiment (d-1). Ultimately, changes in uptake rate are corrected for by applying the EAF to resultant PSD-estimated water concentrations.
membrane device (SPMD) (52), that aim to quantify chemical exposure to micropollutants with greater accuracy (42). Importantly, many of the newer PSDs, including solid-phase micro extraction (SPME) devices (53) and polyethylene devices (54), are designed to sample compounds sharing similar chemical properties, namely hydrophobic organic compounds like PCBs, PAHs, and other organophosphates and organochlorines (42). However, few samplers have been developed to target sampling of polar compounds, those samplers including the organic version of the Chemcatcher (55) and the polar organic chemical integrative sampler (POCIS) (56). Despite these technological advances, a recent review of PSD technology stressed the need for the development of samplers targeting the class of polar organic compounds (42). Moreover, sampling of compounds varying across chemical classes currently requires the use of multiple sampling technologies, which is costly, requires additional time-consuming analysis, and may ultimately exclude certain classes of compounds from monitoring efforts (57). As more polar compounds, like synthetic
endocrine disrupting compounds (EDCs) and steroid hormones, become a part of our slew of environmental contaminants, a more holistic approach to environmental sampling will be required, and as an extension, the development of a PSD with the capacity to sample
REFERENCES
1. Colborn, T., C.C., eds. 1992. Chemically-Induced Alterations in Sexual and Functional Development: the Wildlife/Human Connection. Princeton, NJ: Princeton Scientific Publishing Co.
2. Matthiessen, P., Arnold, D., Johnson, A.C., Pepper, T.J., Pottinger, T.G., Pullman, K.G.T. 2006. Contamination of Headwater Streams in the United Kingdom by Oestrogenic Hormones from Livestock Farms. Sci Tot Environ: 367, 616-630. 3. Bern, H.1992. The Fragile Fetus, in Chemically-Induced Alterations in Sexual and
Functional Development: the Wildlife/Human Connection. C.C. Colborn, T., eds. Princeton Scientific Publishing Co: Princeton, NJ. P. 9-15.
4. Kidd, K.A., Blanchfield, P.J., Mills, K.H., Palace, V.P., Evans, R.E., Lazorchak, J.M., and Flick, R.W. 2007. Collapse of a Fish Population after Exposure to a Synthetic Estrogen. PNAS: 104, 8897-8901.
5. Miller, D.H., Jensen, K.M., Villeneuve, D.L., Kahl, M.D., Makynen, E.A., Durhan, E.J., and Ankley, G.T. 2007. Linkage of Biochemical Responses to Population-Level Effects: A Case Study with Vitellogenin in the Fathead Minnow (Pimephales promelas). Environ Toxicol Chem: 26, 521-527.
6. Furuichi, T., Kannan, K., Suzuki, K., Tanaka, S., Giesy, J.P., and Masunaga, S. 2006. Occurrence of Estrogenic Compounds in and Removal by a Swine Farm Waste Treatment Plant. Environ Sci Technol: 40, 7896-7902.
8. Johnson, A.C., Williams, R.J., and Matthiessen, P. 2006. The Potential Steroid Hormone Contribution of Farm Animals to Freshwaters, the United Kingdom as a Case Study. Sci Tot Environ: 362, 166-178.
9. Kolodziej, E.P., Harter, T., and Sedlak, D.L. 2004. Dairy Wastewater, Aquaculture, and Spawning Fish as Sources of Steroid Hormones in the Aquatic Environment. Environ Sci Technol: 38, 6377-6384.
10. Ternes, T.A., Stumpf, M., Mueller, J., Haberer, K., Wilken, R.-D., and Servos, M. 1999. Behavior and Occurrence of Estrogens in Municipal Sewage Treatment Plants – I. Investigations in Germany, Canada, and Brazil. Sci Tot Environ: 225, 81-90.
11. Campbell, C.G., Borglin, S.E., Green, F.B., Grayson, A., Wozei, E., and Stringfellow, W.T. 2006. Biologically Directed Environmental Monitoring, Fate, and Transport of Estrogenic Endocrine Disrupting Compounds in Water: A Review. Chemosphere: 65, 1265-1280.
12. Lange, I., Daxenberg, A., Schiffer, B., Witters, H., Ibarreta, D., and Meyer, H.H.D. 2002. Sex Hormones Originating from Different Livestock Production Systems: Fate and Potential Disrupting Activity in the Environment. Anal Chem: 473, 27-37. 13. Hanselman, T.A., Graetz, D.A., and Wilkie, A.C. 2003. Manure-Borne Estrogens as
Potential Environmental Contaminants: A Review. Environ Sci Technol: 37, 5471-5478. 14. Palme, R., Fischer, P., Schildorfer, H., and Ismail, M.N. 1996. Excretion of Infused 14
15. Guengerich, F. 1990. Metabolism of 17β-Ethynylestradiol in Humans. Life Sci: 47, 1981-1988.
16. Hutchins, S.R., White, M.V., Hudson, F.M., and Fine, D.D. 2007. Analysis of Lagoon Samples from Different Concentrated Animal Feeding Operations for Estrogens and Estrogen Conjugates. Environ Sci Technol: 41, 738-744.
17. Panter, G., Thompson, R.S., Beresford, N., and Sumpter, J.P. 1999. Transformation of a Non-Oestrogenic Steroid Metabolite to an Oestrogenically Active Substance by Minimal Bacterial Activity. Chemosphere: 38, 3579-3596.
18. Johnson, A.C., and Williams, R.J. 2004. A Model to Estimate Influent and Effluent Concentrations of Estradiol, Estrone, and Ethinylestradiol at Sewage Treatment Works. Environ Sci Technol: 38, 3549-3658.
19. Desbrow, C., Routledge, E.J., Brighty, G.C., Sumpter, J.P., and Waldock, M. 1998. Identification of Estrogenic Chemicals in STW Effluent. 1. Chemical Fractionation and in Vitro Biological Screening. Environ Sci Technol: 32, 1549-1558.
20. Furhacker, M., Breithofer, A., and Jungbauer, A. 1999. 17β-Estradiol: Behavior During Waste Water Analyses. Chemosphere: 39, 1903-1909.
21. Shackleton, C.H.L. 1986. Profiling Steroid-Hormones and Urinary Steroids. J Chrom: 379, 91-156.
23. Lee, H.-B., Peart, T.E., Chan, J., and Gris, G. 2004. Occurrence of Endocrine-Disrupting Chemicals in Sewage and Sludge Samples in Toronto, Canada. Water Qual Res J
Canada: 39, 57-63.
24. Esperenza, M., Suidan, M.T., Marfil-Vega, R., Gonzalez, C., Sorial, G.A., McCauley, P., and Brenner, R. 2007. Fate of Sex Hormones in Two Pilot-Scale Municipal Wastewater Treatment Plants: Conventional Treatment. Chemosphere: 66, 1535-1544.
25. Waxman, D., Ko, A., and Walsh, C. 1983. Regioselectivity and Sterioselectivity of Androgen Hydroxylations Catalyzed by Cytochrome P-450 Isozymes Purified from Phenobarbital-Induced Rat Liver. J Biol Chem: 258, 11937-11947.
26. Swinney, D., Ryan, D.E., Thomas, P.E., and Levin, W. 1987. Regioselective Progesterone Hydroxylation Catalyzed by Eleven Rat Hepatic Cytochrome P-450 Isozymes. Biochem: 26, 7073-7083.
27. Orme, M.L., Back, D.J., and Breckenridge, A.M. 1983. Clinical Pharmacokinetics of Oral-Contraceptive Steroids. Clin Pharmacokin: 8, 95-136.
28. Dannan, G., Guengerich, F.P., and Waxman, D.J. 1986. Hormonal Regulation of Rate Liver Microsomal Enzymes. J Biol Chem: 261, 10728-10735.
29. Wilson, V., McLachlan, J.B., Falls, J.G., and LeBlanc, G.A. 1999. Alteration in Sexually Dimorphic Testosterone Biotransformation Profiles as a Biomarker of Chemically-Induced Androgen Disruption. Environ Health Perspec: 107, 377-384.
31. Levin, E.R. 2005. Integration of the Extracellular and Nuclear Actions of Estrogen. Mol Endocrinol: 19, 1951-1959.
32. Ankley, G.T., Jensen, K.M., Makynen, E.A., Kahl, M.D., Korte, J.J., Hornung, M.W., Henry, T.R., Denny, J.S., Leino, R.L., Wilson, V.S., Cardon, M.C., Hartig, P.C., and Gray, L.E. 2003. Effects of the Androgenic Growth Promoter 17β-Trenbolone on Fecundity and Reproductive Endocrinology of the Fathead Minnow. Environ Toxicol Chem: 22, 1350-1360.
33. Coe, T.S., Hamilton, P.B., Hodgson, D., Paull, G.C., Stevens, J.R., Sumner, K., and Tyler, C.R. 2008. An Environmental Estrogen Alters Reproductive Hierarchies, Disrupting Sexual Selection in Group-Spawning Fish. Environ Sci Technol: 42, 5020-5025.
34. Jensen, K.M., Makynen, E.A., Kahl, M.D., and Ankley, G.T. 2006. Effects of the Feedlot Contaminant 17α-Trenbolone on Reproductive Endocrinology of the Fathead Minnow. Environ Sci Technol: 40, 3112-3117.
35. Labadie, P. and Budzinski, H. 2006. Alteration of Steroid Hormone Profile in Juvenile Turbot (Psetta maxima) as a Consequence of Short-Term Exposure to 17α
-Ethynylestradiol. Chemosphere: 64, 1274-1286.
36. Sumpter, J.P, and Jobling, S. 1995. Vitellogenesis as a Biomarker for Estrogenic Contamination of the Aquatic Environment. Environ Health Perspec: 103, 173-178. 37. MacLatchy, D.L., Courtenay, S.C., Rice, C.D., and Van Der Kraak, G.J. 2003.
Hormone and Vitellogenin End Points in the Estuarine Mummichog (Fundulus heteroclitus). Environ Toxicol Chem: 22, 996-1008.
38. Fenske, M., Maack, G., Schäfers, C., and Segner, H. 2005. An Environmentally Relevant Concentration of Estrogen Induces Arrest of Male Gonad Development in Zebrafish, Danio rerio. Environ Toxicol Chem: 24, 1088-1098.
39. Länge, R., Hutchinson, T.H., Croudace, C.P., Siegmund, F., Schweinfurth, H., Hampe, P., Panter, G.H., and Sumpters, J.P. 2001. Effects of the Synthetic Estrogen 17α -Ethinylestradiol on the Life-Cycle of the Fathead Minnow (Pimephales promelas). Environ Toxicol Chem: 20, 1216-1227.
40. Parrott, J.L., and Blunt, B.R. 2005. Life-Cycle Exposure of Fathead Minnows
(Pimephales promelas) to an Ethinylestradiol Concentration Below 1 ng/L Reduces Egg Fertilization Success and Demasculinizes Males. Environ Toxicol: 20, 131-141.
41. Nash, J.P., Kime, D.E., Van der Ven, L.T.M., Wester, P.W., Brion, F., Maack, G., Stahlschmidt-Allner, P., and Tyler, C.R. 2004. Long-Term Exposure to Environmental Concentrations of the Pharmaceutical Ethynylestradiol Causes Reproductive Failure in Fish. Environ Health Perspec: 112, 1725-1733.
42. Stuer-Lauridsen, F. 2005. Review of Passive Accumulation Devices for Monitoring Organic Micropollutants in the Aquatic Environment. Environ Pollut: 136, 503-524. 43. Huckins, J.N. Petty, J.D., Prest, H.F., Clark, R.C., Alvarez, D.A., Orazio, C.E., Lebo,
Contaminants: Report for the American Petroleum Institute (API). Washington, D.C., API Publication No. 4690.
44. Luellen, D.R., and Shea, D. 2002. Calibration and Field Verification of Semipermeable Membrane Devices for Measuring Polycyclic Aromatic Hydrocarbons in Water. Environ Sci Technol: 36, 1791-1797.
45. Huckins, J.N., Petty, J.D., Orazio, C.E., Lebo, J.A., Clark, R.C., Gibson, V.L., Gala, W.R., and Echols, K.R. 1999. Determination of Uptake Kinetics (Sampling Rates) by Lipid-Containing Semipermeable Membrane Devices (SPMDs) for Polycyclic Aromatic Hydrocarbons (PAHs) in Water. Environ Sci Technol: 33, 3918-3923.
46. Huckins, J.N., Petty, J.D., Lebo, J.A., Almeida, F.V., Booij, K., Alvarez, D.A., Cranor, W.L., Clark, R.C., and Mogensen, B.B. 2002. Development of the
Permeability/Performance Reference Compound Approach for In Situ Calibration of Semipermeable Membrane Devices. Environ Sci Technol: 36, 85-91.
47. Booij, K., Sleiderink, H.M., and Smedes, F. 1998. Calibrating the Uptake Kinetics of Semipermeable Membrane Devices Using Exposure Standards. Environ Toxicol Chem: 17, 1236-1245.
48. Booij, K., Smedes, F., and van Weerlee, E.M. 2002. Spiking of Performance Reference Compounds in Low Density Polyethylene and Silicone Passive Samplers. Chemosphere: 46, 1157-1161.
50. DiGiano, F.A., Elliot, D., and Leith, D. 1989. Application of Passive Dosimetry to the Detection of Trace Organic Contaminants in Water. Environ Sci Technol: 22, 1365-1367.
51. Zhang, G.Z., and Hardy, J.K. 1989. Determination of Phenolic Pollutants in Water Using Permeation Sampling. J Environ Sci Health A: 24, 279-295.
52. Huckins, J.N., Tubergen, M.W., and Manuweera, G.K. 1990. Semipermeable Membrane Devices Containing Model Lipid: a New Approach to Monitoring the Bioavailability of Lipophilic Contaminants and Estimating their Bioconcentration Potential. Chemosphere: 20, 533-552.
53. Verbruggen, E.M.J., Vaes, W.H.J., Parkerton, T.F., and Hermens, J.L.M. 2000. Polyacrylate-Coated SPME Fibers as a Tool to Simulate Body Burdens and Target Concentrations of Complex Organic Mixtures for Estimation of Baseline Toxicity. Environ Sci Technol: 34, 324-331.
54. Adams, R.G., Lohmann, R., Fernandez, L.A., MacFarlane, J.K., and Gschwend, P.M. 2007. Polyethylene Devices: Passive Samplers for Measuring Dissolved Hydrophobic Organic Compounds in Aquatic Environments. Environ Sci Technol: 41, 1317-1323. 55. Vrana, B., Mills, G.A., Allan, I.J., Dominiak, E., Svensson, K., Knutsson, J., Morrison,
G., and Greenwood, R. 2005. Passive Sampling Techniques for Monitoring Pollutants in Water. Trends Anal Chem: 24, 845-868.
Hydrophilic Organic Contaminants in Aquatic Environments. Environ Toxicol Chem: 23, 1640-1648.
57. Petty, J.D., Huckins, J.N., Alvarez, D.A., Brumbaugh, W.G., Cranor, W.L., Gale, R.W., Rastall, A.C., Jones-Lepp, T.L., Leiker, T.J., Rostad, C.E., and Furlong, E.T. 2004. A Holistic Passive Integrative Sampling Approach for Assessing the Presence and Potential Impacts of Waterborne Environmental Contaminants. Chemosphere: 54, 695-705.
58. Lai, K.M., Scrimshaw, M.D., and Lester, J.N. 2002. Prediction of the Bioaccumulation Factors and Body Burden of Natural and Synthetic Estrogens in Aquatic Organisms in the River Systems. Sci Tot Environ: 289, 159-168.
59. Lai, K.M., Johnson, K.L., Scrimshaw, M.D., and Lester, J.N. 2000. Binding of
Waterborne Steroid Estrogens to Solid Phases in River and Estuarine Systems. Environ Sci Technol: 34, 3890-3894.
60. Yamamoto, H., Lilijestrand, H.M., Shimizu, Y., and Morita, M. 2003. Effects of
Physical-Chemical Characteristics on the Sorption of Selected Endocrine Disruptors by Dissolved Organic Mater Surrogates. Environ Sci Technol: 37, 2646-2657.
61. Carballa, M., Fink, G., Omil, F., Lema, J.M., and Ternes, T. 2008. Determination of the Solid-Water Distribution Coefficient (Kd) for Pharmaceuticals, Estrogens and Musk Fragrances in Digested Sludge. Water Res: 42, 287-295.
63. Jurgens, M.D., Holthaus, K.I.E., Johnson, A.C., Smith, J.J.L., Hetheridge, M., and Williams, R.J. 2002. The Potential for Estradiol and Ethinylestradiol Degradation in English Rivers. Environ Toxicol Chem: 21, 480-488.
64. Ying, G.-G., Kookana, R.S., and Ru, Y.-J. 2002. Review Article: Occurrence and Fate of Hormone Steroids in the Environment. Environ Int: 28, 545-551.
65. Casey, F.X.M., Hakk, H., Šimůnek, J., and Larsen, G.L. 2004. Fate and Transport of Testosterone in Agricultural Soils. Environ Sci Technol: 38, 790-798.
66. Servos, M.R., Bennie, D.T., Burnison, B.K., Jurkovic, A., McInnis, R., Neheli, T., Schnell, A., Seto, P., Smyth, S.A., and Ternes, T.A. 2005. Distribution of Estrogens, 17β-Estradiol and Estrone, in Canadian Municipal Wastewater Treatment Plants. Sci Tot Environ: 336, 155-170.
67. Wang, Y., Hu, W., Cao, Z., Fu, X., and Zhu, T. 2005. Occurrence of Endocrine-Disrupting Compounds in Reclaimed Water from Tianjin, China. Anal Bioanal Chem: 383, 857-863.
68. Belfroid, A.C., Van der Horst, A., Vethaak, A.D., Schäfer, A.J., Rijs, G.B.J., Wegener, J., and Cofino, W.P. 1999. Analysis and Occurrence of Estrogenic Hormones and their Glucuronides in Surface Water and Waste Water in The Netherlands. Sci Tot Environ: 225, 101-108.
70. Kuch, H.M., and Ballschmiter, K. 2001. Determination of Endocrine-Disrupting Phenolic Compounds and Estrogens in Surface and Drinking Water by HRGC-(NCI)-MS in the Picogram per Liter Range. Environ Sci Technol: 35, 3201-3206.
71. Vuillet, E., Wiest, L., Baudot, R., Grenier-Loustalot, M.-F. 2008. Multi-Residue Analysis of Steroids at Sub-ng/L Levels in Surface and Ground-Waters Using Liquid Chromatography Coupled to Tandem Mass Spectrometry. J Chrom A: 1210, 84-91. 72. Fine, D.D., Breidenbach, G.P., Price, T.L., and Hutchins, S.R. 2003. Quantitation of
Estrogens in Ground Water and Swine Lagoon Samples Using Solid-Phase Extraction, Pentafluorobenzyl/trimethylsilyl Derivatizations and Gas Chromatography-Negative Ion Chemical Ionization Tandem Mass Spectrometry. J Chrom A: 1017, 167-185.
73. Raman, D.R., Williams, E.L., Layton, A.C., Burns, R.T., Easter, J.P., Daugherty, A.S., Mullen, M.D., and Sayler, G.S. 2004. Estrogen Content of Dairy and Swine Wastes. Environ Sci Technol: 38, 3567-3573.
74. Kolpin, D.W. 2002. Pharmaceuticals, Hormones, and Other Organic Wastewater Contaminants in U.S. Streams, 1999-2000: A National Reconnaissance. Environ Sci Technol: 36, 1202-1211.
Chapter 1. Calibration and Field Verification of a Cartridge-Based Passive Sampling
Device for Estimating Chronic Exposure to Steroid Hormones in Water
NATALIE L. HIRONS,* DAMIAN SHEA,
North Carolina State University, Department of Environmental and Molecular Toxicology, Box 7633, Raleigh, North Carolina 27695-7633
* Corresponding author telephone: 919-515-1960; fax: 919-515-7169; e-mail: nlguill@ncsu.edu.
This manuscript is in the format required for submission to the Journal
Abstract. A novel passive sampling device (PSD) was developed in our laboratory to take a
more holistic approach to aquatic exposure. The cartridge-style universal passive sampling device (uPSD) was designed with the purpose of sampling compounds varying in
physicochemical properties, including more polar compounds. In this work, the uPSD was calibrated under controlled laboratory conditions over a 30-day period to determine
Introduction
As an emerging class of contaminants, endocrine active chemicals (EACs) have the potential to adversely affect highly-valued and critical populations in aquatic ecosystems (1, 2, 3). Adverse effects typically have been observed when exposure is chronic and at very low concentrations (4, 5). So, the ability to quantify low-level, chronic exposure to EACs in surface waters is essential to assessing ecosystem health and further, in characterizing and managing risks associated with EACs. EACs of particular importance, natural and synthetic hormones, are found in both human and animal wastes and have the potential to contaminate surface waters (6-8). Because endogenous androgens and estrogens program aspects of sex differentiation and reproduction during development, exogenous steroid exposure during those susceptible windows can result in detrimental and irreversible alterations in
development and by extension, reproductive success of the population (2, 9-11).
So, detection and quantification of emerging contaminants are of great importance to environmental and public health protection. Surface water monitoring of natural and
synthetic steroid hormones can prove difficult because toxicologically-significant
concentrations are often low, at the part-per-trillion (ppt) level (2, 12). While detecting low, toxicologically-significant concentrations is possible by traditional methods (grab sampling), this sampling only gives an exposure estimate of a single point in time. To obtain an
estimate of chronic exposure, grab samples must be taken frequently. Developments in sampling technology, namely passive sampling devices (PSDs), have allowed for estimations of chronic exposure for a broad suite of chemicals. PSDs concentrate
estimation, PSDs are calibrated under controlled conditions in the laboratory to determine effective sampling rates for each compound, and effective sampling rates are determined during an initial period of linear uptake using the following equation,
Rs = Nt / Cw t (1) where Rs is the sampling rate (L/d), Nt is the amount (ng) of analyte accumulated in the
sampler at the end of exposure, time in days, Cw is the average concentration of freely-dissolved analyte in water (ng/L), and the duration of the exposure, t, where time is
measured in days (13). Once laboratory-derived sampling rates have been determined, eq 1 can be rearranged to solve for Cw, the freely-dissolved field exposure estimate (ng/L),
Cw = Nt / Rs t (2) where Nt is the amount (ng) of analyte in the PSD at the end of the deployment period, t, in
days, Rs is the laboratory-derived sampling rate (L/d), and t is the duration of the deployment in days (13).
So, estimating exposure in the field using eq 2 requires laboratory-derived sampling rates, determined under a controlled flow-through system. Differences in field conditions compared to calibration conditions, such as stream flow velocity, temperature, or biofouling, can affect the uptake rate of chemical into the PSD (14). Assuming isotropic exchange kinetics, changes in uptake rate are directly proportional to changes in elimination, and so the use of performance reference compounds (PRCs) have been used to translate
duration of the deployment can be modeled assuming first-order release kinetics using the following equation (15),
Nt = N0 × e(-ket) (3)
where Nt is the amount (ng) of PRC remaining in the sampler at time t in days, N0 is the amount (ng) of PRC initially loaded into the sampler, ke is the elimination or exchange rate constant (d-1), and t is the time in days. By comparing laboratory PRC ke values to field PRC ke values, an environmental adjustment factor (EAF) can be calculated and applied to
resultant PSD-estimated water concentrations (14),
EAF ≡ kePRC-f / kePRC-cal (4)
where kePRC-f represents the PRC elimination rate constant in the field (d-1) and kePRC-cal represents the PRC elimination rate constant determined from the laboratory calibration experiment (d-1).
environmental assessments. The purpose of this work is to present the first laboratory-derived sampling rates for eight select androgens and estrogens in a cartridge-style uPSD developed in our laboratory, determine if flow-rate affects elimination kinetics from the uPSD, and to provide a first field verification of cartridge uPSD sampling rates for those steroid hormones.
Experimental Section
Materials. Acetone (ACE), dichloromethane (DCM), and hexane were purchased from J.T.
Baker Inc. (Phillipsburg, NJ). Acetonitrile (ACN) and ethyl acetate were purchased from Burdick and Jackson™ (Muskegon, MI). Methanol was purchased from Fisher Scientific (Fairlawn, NJ). All hormone standards were brought up in methanol or acetonitrile. Androstenedione (A) was purchased from Steraloids Inc. (Newport, RI). Epitestosterone, 17β-testosterone, estrone (E1), 17α-estradiol (αE2), 17β-estradiol (E2), estriol (E3), ethynyl estradiol (EE2), and diethylstilbestrol (DES), used as a surrogate internal standard, were purchased from Sigma Aldrich Co. (St. Louis, MO). Recovery internal standard, benzo-a-pyrene-d12, was purchased from Cambridge Isotope Laboratory (Andover, MA). 17β -estradiol-2,4,16,16-d4 was used as a performance reference compound (PRC) (C/D/N
Isotopes Inc., Quebec, Canada). The derivatizing reagents, trimethylsilyldimethylamine with 10% hexamethyldisilazane (TMSDMA + 10% HMDS), were purchased from Fisher
Scientific Inc. (Pittsburg, PA) and Sigma Aldrich Co. (St. Louis, MO), respectively, and the derivatizing solvent, acetonitrile with 100mM n-methylmorpholine and 50mM
from Sigma Aldrich Co. (St. Louis, MO). Oasis® HLB SPE columns were purchased from Waters Corporation (Milford, MA).
Cartridge uPSDs were constructed using stainless steel inlet filters manufactured by Upchurch Scientific (Oak Harbor, WA) and purchased through Fisher Scientific Inc.
(Pittsburg, PA), having a 10μm pore diameter, external diameter of 1.25cm, length of 2.8cm, and interior surface area of approximately 6.19 cm2. Inlet filters were packed with 200 ± 1 mg Oasis® HLB sorbent (Waters Corporation, Milford, MA) and enclosed with an
impermeable Teflon frit. Cartridge uPSDs were washed prior to use in 6 1-hour repeats using DCM, alternating with ACE. Cartridge uPSDs used on laboratory and field
experiments were fortified with 500ng PRC per device immediately prior to deployment. All glassware was silanized using Sylon CT (Sigma Aldrich Co., St. Louis, MO) before use. Aluminum foil was baked (300 °C) overnight before use, and all glassware was solvent-rinsed using ACE, DCM, and HEX and then baked (300 °C) overnight prior to use.
Uptake Experiment. An uptake experiment was conducted, exposing cartridge uPSDs to
samples not immediately processed were stored at 4°C and extracted within 48 hours after sampling.
Elimination Experiment. A flow-through elimination system was created to simulate 3
stream flow velocities within a single 19 L aquarium (~24 °C). Three channels were created within the aquarium, and varying flow velocities were achieved by altering channel
dimensions such that channel 1 had the highest flow velocity of approximately 30 cm/s, channel 2 flow velocity was approximately 15 cm/s, and channel 3 had the slowest flow velocity of approximately 7 cm/s. Flow was maintained using pumps, one to recycle water within the system, another to supply new de-ionized water to maintain a constant water concentration of approximately zero. Cartridge uPSDs, loaded with 500ng of PRC and hormones, were suspended in the center of each channel for the duration of the 30-day experiment and were sampled in triplicate on days 0, 1, 5, 10, 15, 20, 27, and 30. Samples not immediately processed after sampling were stored at -20 °C and analyzed within 48 hours after storage.
Field Set-Up and Sample Collection. Cartridge uPSDs were deployed at two sites: 1) in the
dilution zone of a municipal wastewater treatment plant outfall, and 2) in surface waters near a concentrated animal feeding operation (CAFO).
30-day period, on days 0, 4, 7, 12, 18, 24, and 30 and were filtered through a 0.7 μm glass-fiber filter (Whatman) prior to the processing below.
Cartridge uPSDs were deployed in triplicate in surface waters near a CAFO with grab samples of water collected every other day over the 30-day deployment period. At the end of deployment, uPSDs were transported to the laboratory, wiped clean, and immediately processed, as described below. The 15 water samples were filtered prior to extraction and extracted using the methods below.
Sample Processing. Prior to extraction, excess water was removed from cartridge uPSDs by
centrifugation, placing samplers in a 15-mL plastic centrifuge tube and centrifuging at 3000 rpm for 15 min at 23 °C. 500 ng of the surrogate internal standard was run with each sample. Cartridge uPSDs were shaker-table extracted twice using 15 mL ethyl acetate for 1 hour at 180 rpm for each extraction. Eluent was transferred to a 50-mL glass vial and evaporated to dryness under a gentle stream of nitrogen at 50 °C. The sample was reconstituted in three 0.5-mL ethyl acetate rinses and filtered through a 0.45 μm PTFE Whatman® UNIPREP syringeless filter into a deactivated 2-mL glass autosampler vial and again evaporated to dryness under nitrogen. 200 μL of derivatization solvent, as well as 100 μL of derivatization reagent, were added to each autosampler vial. The vials were then sealed with PTFE-lined rubber crimp caps, and samples were then incubated at 60 °C for 1.25 hr. Samples were then cooled to room temperature, 500 ng internal standard was added, and brought up to ~ 0.5 mL in ACN prior to analysis by GC-MS.
cartridges (6 mL, 500 mg; Waters Corporation, Milford, MA). Cartridges were conditioned with 5 mL ethyl acetate, washed with 5 mL MeOH, and equilibrated with 5 mL de-ionized water, and samples were then pressure-extracted at ~ 10 mL/min. Steroids were eluted with 5 mL ethyl acetate. Eluent was evaporated to dryness under a gentle stream of nitrogen at 50 °C. The sample was reconstituted in three 0.5-mL ethyl acetate rinses and filtered through a 0.45 μm PTFE Whatman® UNIPREP syringeless filter into a deactivated 2-mL glass autosampler vial and again evaporated to dryness under nitrogen. Samples were then derivatized, using the method described above for cartridge uPSD samples, brought up to ~ 0.5 mL in ACN, and analyzed by GC-MS.
Instrumental Analysis. All hormone quantification was performed by GC-MS, using an
Quality Control. Data quality was assessed using procedural blanks, cartridge uPSD
blanks, matrix spikes, and replicate analyses, as well as surrogate internal standards. Method blanks were clean with no qualitative evidence of contamination. Surrogate and matrix spike recoveries were between 55 - 129%, and results were not corrected for these recoveries.
Results and Discussion
Uptake Curves. The eight androgens and estrogens (log Kows ranging from 2.5 – 4.0)
investigated in this study are listed in Table 1. Uptake curves for four representative steroid hormones, two estrogens and two androgens, are shown in Figure 1; uptake curves for all hormones in this study are given in supporting information (see below). All hormones remained in the linear uptake phase throughout the 30-day period with variability among triplicates greatest at day 30 (R2≥ 0.86 for all 8 curves). This validates the appropriateness of using a linear model to derive sampling rates (eq 1) and also illustrates that linear uptake over a 4-week period can be assumed in field sampling.
Traditional PSDs, like SPMDs (17), demonstrate linear uptake over a 30-day period only for compounds with log Kow ≥ 4.5 (13, 15). For compounds with log Kow < 4.5,
PSDs over traditional sampling methods starts to diminish when shortening sampling deployment.
Another factor that could influence the deployment duration of cartridge uPSDs is a nonzero intercept. In order to maintain the use of the linear model (eqs 1 and 2), deployment periods must be long enough to diminish the initial uptake contribution leading to nonzero intercepts. Intercepts observed in this study ranged from 6.4 – 15.6 ng (Figure 1). Although other studies have demonstrated that deployment periods of a few days are sufficient to negate the contribution of initial uptake (13, 15), Booij et al. (23) observed greater
contributions of initial uptake that necessitated longer deployment windows, as high as 53 days. This study also established that a maximum intercept contribution equal to 10% of the total amount accumulated in the PSD was sufficient to estimate minimum exposure time required to negate nonzero intercepts in field deployment (23). By this criterion, minimum field exposures between 9 – 22 days for cartridge uPSDs were calculated using linear regressions generated from uptake curves in this study. So, typical field deployments of 3 – 4 weeks are suitable for providing measurable exposure to the androgens and estrogens from this study while negating contributions of initial uptake into the cartridge uPSD.
analytes, as both androgens and estrogens contain the same basic structure but differ in functional groups. The three hormones demonstrating slightly slower uptake contain two or more (sterically-unhindered) hydroxyl groups, unlike the other 5 hormones that contain zero or one hydroxyl groups. Ethynyl estradiol is an exception, as this compound has two
hydroxyl groups; however, one of the hydroxyl groups may be sterically hindered due to the presence of a methyl functional group bonding at the same carbon. Ultimately, hydroxyl groups represent ionizable functional groups whose presence or absence may govern uptake or diffusion of steroid hormones into the sorbent matrix of the cartridge uPSD.
Sampling Rates. Effective sampling rates (Rs) for target androgens and estrogens were
calculated using eq 1 at each time point beyond day one. If any analyte did not remain in the linear uptake phase, Rs’s would only be calculated within the region of linear uptake. Mean Rs’s are reported in Table 1 with corresponding standard deviations. Cartridge uPSD sampling rates were determined under controlled laboratory conditions, including a stipulation of using eq 1 requiring relatively constant aqueous concentrations of hormones (Cw), which was verified by collecting and analyzing samples at least three times every week. Average water concentrations ranged from 47 – 64 ng/L. Rs’s remained constant throughout the exposure (Table 1) and mean Rs’s were constant across analytes in this study, ranging from 0.09 – 0.11 L/d .
comparing Rs’s generated in this study to those generated by Arditsoglou et al. (24) for select estrogens, the apparent volume of water quantitatively extracted from the cartridge uPSD is lower than for the POCIS, with uPSD Rs’s ranging between 0.09 and 0.11 L/d and POCIS Rs’s between ~0.11 and 0.22 L/d (Table 1). However, a couple factors to consider include differences in surface area between the two PSDs and how Rs’s relate to log Kow values. POCIS surface area (~ 18 cm2) (20) is considerably larger than the cartridge uPSD surface area (~ 6.19 cm2); so, normalizing Rs’s to surface area would produce higher Rs’s per device for the cartridge uPSD. Additionally, when comparing Rs’s across log Kow’s for estrogens, POCIS Rs’s appear to vary more across log Kow’s. For instance, there is less than a 1.3-fold difference in uPSD Rs’s, compared to a ~2-fold difference in POCIS Rs’s, for 5 select estrogens (log Kow values ranging from 2.5 – 4.7, a 150-fold difference). Further research establishing uPSD Rs’s for compounds with wider ranging log Kow’s is necessary to be able to definitively compare log Kow-dependence of uPSD and POCIS Rs’s. However, the relatively constant Rs’s observed in this study suggests that uPSD uptake rates may be independent (or less dependent) of MW or log Kow values, and hence, a more universal Rs may be used in the future for analytes without laboratory-calibrated Rs’s.
Elimination Rate Constants. Because environmental conditions have been shown to
In the elimination calibration experiment, cartridge uPSDs were initially loaded with a known amount of each steroid hormone and then subject to three different flow conditions (~ 30, 15, and 7 cm/s). Release kinetics to determine elimination rate, or exchange rate (ke), constants were modeled using eq 3, which follows a first-order exponential elimination model and has been used previously to model elimination in other PSDs (13, 14, 25). Elimination curves of one representative androgen and estrogen are presented in Figure 2. High variability observed among time points indicates potential problems with initial
loading in this experiment. ke values determined using eq 3 ranged from 0.013 – 0.022 d-1 in channel 1, 0.021 – 0.034 d-1 in channel 2, and 0.006 – 0.020 d-1 in channel 3 (Table 2), signifying no effect of flow rate on ke. However, coefficients of correlation (R2 values) are very low (Table 2), indicating elimination does not follow first-order kinetics; this
observation is not surprising due to the biphasic nature of the uPSD sorbent, Oasis HLB®. Additionally, there was no apparent correlation between log ke and log Kow, which supports observations in the uptake experiment that mass transfer may be independent of physicochemical properties of analytes as long as water can get into the uPSD (little or no biofouling). Importantly though, these compounds are not expected to be under aqueous boundary layer control because log Kow’s < 4.5. So regardless of stream flow velocity, the aqueous boundary layer would not be the rate-limiting step; rather mass transfer of these compounds would be under membrane control (19).
Performance Reference Compounds. Performance reference compounds have been
flow-rate, biofouling, and temperature (14, 16, 26, 27). PRCs are chemically non-interfering compounds not normally found in nature that are loaded into the PSD prior to field
deployment. PRC elimination is typically modeled assuming first-order exponential decay, eq 3, to determine a PRC ke. Differences in laboratory and field PRC elimination are accounted for using eq 4 by calculating environmental adjustment factor (EAF), and ultimately, the EAF is applied to equation 3 to provide for a more accurate estimate of in-situ Cw.
As observed in the elimination experiment, the use of a ke determined by eq 3 is not appropriate because elimination from uPSDs does not appear to follow a first-order
exponential model. So, in order to account for differences in laboratory and field conditions, ratios of percent PRC are used in field calculations,
EAF ≡ [(N0,field – Nt,field) / (N0,field)] / [(N0,cal – Nt,cal) / (N0,cal)] (5) where N0,field is the amount (ng) initially loaded in the uPSD prior to field deployment, Nt,field
is the amount (ng) of PRC remaining in the uPSD at the end of the deployment, N0,cal is the amount (ng) of PRC initially measured in the uPSD in laboratory calibration, and Nt,cal is the amount (ng) of PRC measured in the uPSD at the end of the laboratory calibration period.
Field Verification. The primary purpose of developing the uPSD in this work is to estimate
data in Table 1, we can estimate concentrations of steroid hormones in surface waters receiving inputs from a wastewater treatment plant and downstream of an agricultural area.
Concentrations of hormones dissolved in water were estimated using eq 2, the mean sampling rates (Table 1) and hormone residues in the field-deployed uPSDs. Concentrations were estimated first using only laboratory-derived Rs’s and then concentrations were
estimated by applying a PRC-correction in samples collected in wastewater effluent (eq 5) (Table 3). These estimated concentrations were then compared to measured hormone concentrations from grab samples of wastewater effluent in Figure 3. The
estimated:observed comparisons in Figure 3 were based on field measurements using the mean of seven grab samples over a 30-day period and the mean of triplicate cartridge uPSD residues deployed for 30 days. Approximations using mean uPSD residues were calculated both with and without a PRC-correction. In both approximations (with and without PRC correction), most hormones are overestimated, generally under a factor of two (Figure 3). Surprisingly, the mean uPSD estimates (without any PRC correction) were in good agreement with observed mean concentrations with ratios very close to one. With the exception of estriol (ratio of 1.52), all ratios for mean uPSD estimates without PRC correction, were between 0.75 and 1.25, indicating < 25% deviation from estimated to observed values. All PRC-corrected estimates were overpredictions with ratios ranging from 1.37 – 2.43 (Figure 3), indicating that PRC-corrected estimates demonstrated a larger
deviation from observed values than estimates without a PRC correction.
mean that αT was not present in the sampled water, rather that concentrations could have been below method detection limits for the volume of water extracted. Cartridge uPSD residues placed mean estimates between 0.12 – 0.18 ng/L, which although low, the estimates indicate that αT contributes to the overall androgenicity of the effluent (Table 3). So, the case of αT shows that while repetitive or exhaustive grab sampling may underestimate or completely miss exposure, the use of uPSDs allows very low chronic exposures to be captured and quantified.
DOC-complexed hormones. An additional explanation could be competition for uPSD sorption sites by other organic compounds in water. This would reduce the amount of hormone sorbed to the PSD. The standard conditions employed in the calibration of the uPSD used de-ionized water with no DOC or competing organic compounds.
So, cartridge uPSDs have proven useful in providing quantitative estimates of steroid hormone exposure. uPSDs offer many advantages over traditional sampling methodologies, including reducing cost by decreasing required sample size, saving time in both the
laboratory and field by taking and processing fewer samples, representing the bioavailable fraction of exposure, and capturing and quantifying transient or trace exposure that could otherwise be missed by grab sampling. Additionally, elimination experiment results (Figure 2) and field validation (Figure 3) have demonstrated that PRC-correction may not be
necessary to gain an estimate of chronic exposure to hormones using cartridge uPSDs.