Developing Partially-Transcribed Speech Corpus from Edited Transcriptions
Kengo Ohta
#1, Masatoshi Tsuchiya
∗2, Seiichi Nakagawa
#3#Department of Information and Computer Sciences /∗Information and Media Center,
Toyohashi University of Technology,
1–1 Hibarigaoka, Tempakucho, Toyohashi-shi, Aichi, 441–8580 Japan 1
Abstract
Large-scale spontaneous speech corpora are crucial resource for various domains of spoken language processing. However, the available corpora are usually limited because their construction cost is quite expensive especially in transcribing speech precisely. On the other hand, loosely transcribed corpora like shorthand notes, meeting records and closed captions are more widely available than precisely transcribed ones, because their imperfectness reduces their construction cost. Because these corpora contain both precisely transcribed regions andeditedregions, it is difficult to use them directly as speech corpora for learning acoustic models. Under this background, we have been considering to build an efficient semi-automatic framework to convert loose transcriptions to precise ones. This paper describes an improved automatic detection method of precise regions from loosely transcribed corpora for the above framework. Our detection method consists of two steps: the first step is a force alignment between loose transcriptions and their utterances to discover the corresponding utterance for the certain loose transcription, and the second step is a detector of precise regions with a support vector machine using several features obtained from the first step. Our experimental result shows that our method achieves a high accuracy of detecting precise regions, and shows that the precise regions extracted by our method are effective as training labels of lightly supervised speaker adaptation.
Keywords:Speech processing, Text-to-speech alignment, Acoustic model training
1.
Introduction
Large-scale spontaneous speech corpora are crucial re-source for various domains of spoken language processing. For example, the simplest approach to construct a language model, which covers spoken-style expressions as well as the specified domain topics, is training it from a large-scale spontaneous corpus including many precise transcriptions of spontaneous speech in the specified domain. However, the available corpora are usually limited because their con-struction cost is quite expensive especially in transcribing speech precisely.
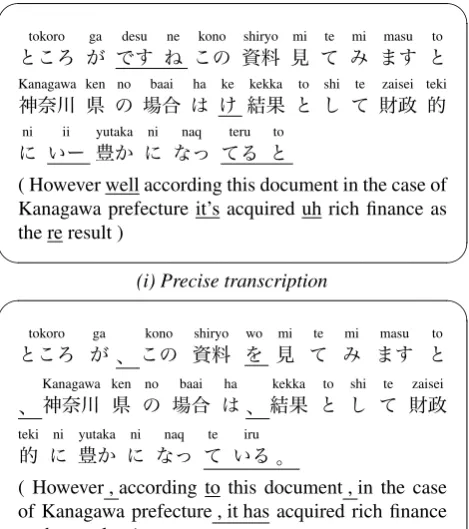
On the other hand, loosely transcribed corpora like short-hand notes, meeting records and closed captions are more widely available than precisely transcribed ones, because their imperfectness reduces their construction cost. Fig.1 shows an example snippet of the Japanese National Diet Record, which is a loosely transcribed corpus of debates in the Japanese National Diet. It is continuously maintained by the Japanese National Diet Library1, and covers the de-bates over the past 60 years. The corpus consists ofedited transcriptions shown in the lower part of Fig.1, and there are three kinds of editing operations between the edited transcription and the precise transcription shown in the up-per part of Fig.1. The first is removing redundant expres-sions (e.g., ” /desune/”, ” /to/”), disfluencies such as filled pauses (e.g., ” /ee/”, ” /ii/”), and hesita-tions (e.g., ” /ke/”). The second is that colloquial expres-sions (e.g., ” /teru/”) are replaced by literary expres-sions (e.g., ” /teiru/”), and that omissions of parti-cles (e.g., ” /wo/”) are recovered. The third is that certain commas are added or removed according to the shorthand
1
http://kokkai.ndl.go.jp/
tokoro ga desu ne kono shiryo mi te mi masu to
Kanagawa ken no baai ha ke kekka to shi te zaisei teki
ni ii yutaka ni naq teru to
( However well according this document in the case of Kanagawa prefecture it’s acquired uh rich finance as the re result )
(i) Precise transcription
tokoro ga kono shiryo wo mi te mi masu to
Kanagawa ken no baai ha kekka to shi te zaisei
teki ni yutaka ni naq te iru
( However , according to this document , in the case of Kanagawa prefecture , it has acquired rich finance as the result . )
(ii) Edited transcription
Figure 1: Example of precise and edited transcriptions
Table 1: Editing operations in existing loosely transcribed corpora
Sub Del Ins Total Audiobook (Braunschweiler et al., 2010) 0.4% 1.4% 3.6% 5.4% Japanese National Diet Records 1.0% 6.3% 0.7% 8.0%
Under this background, we have been considering to build an efficient semi-automatic framework to convert edited transcriptions to precise ones. This paper describes an im-proved automatic detection method of precise regions from loosely transcribed corpora for the above framework. Our detection method consists of two steps: the first step is a force alignment betweeneditedtranscriptions and their ut-terances to discover the corresponding utterance for the cer-tain editedtranscription, and the second step is to detect precise regions with a support vector machine using several features obtained from the first step.
There are two major directions of related works. The first direction is reducing the construction cost of precisely tran-scribed corpora. (Roy et al., 2010) employed an acous-tic score obtained from an automaacous-tic alignment to estimate the accuracy and difficulty in transcribing speech record-ings. (Maruyama et al., 1999) suggested using an automatic alignment for timing detection of closed captioning in doc-umentary programs. Our experimental result shows that it is quite difficult to detecteditedregions accurately, but still shows that our proposed method achieves promising performance to reduce the conversion time by hand from editedtranscriptions into precise ones. The second direc-tion is speaker adaptadirec-tion of acoustic models. (Paulik and Panchapagesan, 2011) proposed that regions, where loose transcriptions and LVCSR outputs were identical, were ef-fective as training labels of lightly supervised speaker adap-tation. (Watanabe et al., 2004) proposed that the identi-cal regions between the outputs of several LVCSR systems were used as training labels of lightly supervised speaker adaptation. (Lamel et al., 2001) employed an automatic alignment for lightly supervised acoustic model training. In their work, the automatic alignment is used to filter out unreliable training data in acoustic model training. (Braun-schweiler et al., 2010) employed lightly supervised recog-nition for automatic alignment between text and speech of Audiobooks. Table 1 shows the statistics of editing oper-ations between precise transcriptions andedited transcrip-tions. As shown in Table 1, Japanese National Diet Records contains more deletion errors than Audiobooks, and these errors make a force alignment more difficult. Our exper-imental result shows that our proposed method achieves high accuracy of detecting precise regions, and shows that precise regions extracted by our proposed method are effec-tive as training labels of lightly supervised speaker adapta-tion.
The remainder of this paper is organized as follows: Sec-tion 2. describes a force alignment method between the editedtranscriptions and their utterances. Section 3. de-scribes the detector of precise regions with a support vec-tor machine. The evaluation experiment on the Japanese National Diet Record is presented in Section 4.. Finally,
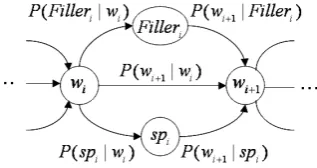
Figure 2: Bigram constraint for the force alignment
Section 5. concludes this paper.
2.
Force Alignment between Edited
Transcriptions and Their Utterances
As the first step of our method, a force alignment between edited transcriptions and their utterances is employed to discover the corresponding utterance for the certain edited transcription. The force alignment is carried out by the LVCSR decoder which works on the bigram language model shown in Fig. 2. Here,widenotes thei-th word in the transcription, andspiandF illeridenote a short pause and a filled pause occurring immediately after wordwi, re-spectively. This constraint restricts the output of the auto-matic speech recognition to the same word sequence as one in the edited transcription.An example of the force alignment between an pre-cise/edited transcription and its corresponding utterance is shown in Fig. 3. As shown in Fig. 3, when the precise tran-scription is aligned with the corresponding utterance, the syllable durations resemble their inherent values. On the other hand, when the edited transcription is aligned with the corresponding utterance, the force alignment makes the best effort possible to align the input utterance with the transcription. As a result, frames of spurious syllables are absorbed by a silence segment or another syllable segment. This causes the syllable duration to be distorted and the acoustic score in the alignment degrades because of a mis-match between the syllable and the aligned model. In the example in Fig. 3, the model /ga/ is forced to align with the frames of syllable /de/. Besides, the short pause models are also forced to align with the frames of syllables /ga/ and /su ne/. Additionally, a filled pause /oh/ is inserted. Hence, if syllable durations are overly long or short com-pared with their inherent values, or if acoustic scores are worse than a standard value, it may suggest that there are mismatches between the text and the utterances due to the text having been edited.
Figure 3: Example of alignment between edited transcription and its corresponding utterance
edited transcriptions. In this paper, we formalize the detec-tion of precise regions as a binary classificadetec-tion problem for each word in the edited transcriptions. Each word is classi-fied either as a precise (non-edited) word or an edited word based on the features obtained from the force alignment. We used TinySVM (ver 0.09) (Kudoh, ) as the support vec-tor machine implementation with a polynomial kernel. A force alignment between the precise transcription and its corresponding utterance of the training corpus gives the syllable duration d(si), and the syllable acoustic log-likelihood L(si)for a sequence of syllablessN1 whereN
is the number of syllables. In this assumption, the mean duration of the syllable typexis calculated by
Ed(x) =
∑N
i=1δ(si=x)d(si)
∑N
i=1δ(si=x)
(1)
and the variance of the syllable typexis calculated by
Vd(x) =
∑N
i=1δ(si=x) (d(si)−Ed(x))
2 ∑N
i=1δ(si=x)
(2)
Using these equations, the normalized syllable duration of a certain syllablesjin the test corpus is defined as follows:
˜ d(sj) =
d(s√j)−Ed(sj)
Vd(sj)
(3)
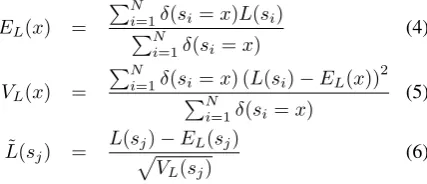
We expect that this measure will represent peculiarity of the given syllable. As well as syllable duration, the normalized acoustic log-likelihood of a certain syllablesj in the test corpus is also defined as follows:
EL(x) =
∑N
i∑=1δ(si=x)L(si)
N
i=1δ(si=x)
(4)
VL(x) =
∑N
i=1δ(si=x) (L(si)−EL(x))
2 ∑N
i=1δ(si=x)
(5)
˜
L(sj) =
L(s√j)−EL(sj)
VL(sj)
(6)
Because the major editing operation of Japanese National
Diet Records is deletion of redundant expressions and hesi-tations, the following five acoustic features are employed2:
1. The maximum normalized syllable duration in the word,
2. The minimum normalized acoustic log-likelihood in the word,
3. The normalized acoustic log-likelihood of the syllable which gives the maximum normalized syllable dura-tion in the word,
4. The normalized syllable duration of the syllable which gives the minimum normalized acoustic log-likelihood in the word, and
5. The acoustic log-likelihood of whole the word.
Furthermore, the following three linguistic features are also employed:
1. Word identity,
2. Part-of-speech, and
3. The number of syllables of the word.
All these features for the focused word, the preceding two words, and the succeeding two words are combined into a feature vector for each word.
4.
Experiment
In this section, we discuss our evaluation experiments using the Japanese National Diet Record.
4.1. Experimental Setup
Table 2 shows the data statistics of a part of the Japanese National Diet Record, which is used for our experiment. The in-house large vocabulary continuous speech recogni-tion system, SPOJUS++ (SPOken Japanese Understanding System) (Fujii et al., 2011) is employed as the decoder for
2
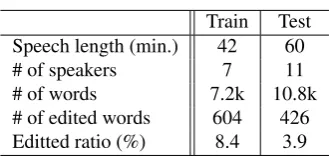
Table 2: Data statistics
Train Test Speech length (min.) 42 60
# of speakers 7 11
# of words 7.2k 10.8k # of edited words 604 426 Editted ratio (%) 8.4 3.9
Table 3: Conditions of acoustic analysis for input speech
Sampling rate 16kHz Preemphasis 0.98
Analysis window Hamming window Analysis frame length 25ms
Analysis frame shift 10ms
Feature parameter
MFCC
+4MFCC +44MFCC +4Pow +44Pow (38 dimensions)
the force alignment described in Section 2. and continuous syllable recognition described in Section 3.. The acous-tic model of this stage is the Japanese context-independent syllable-based acoustic model (Nakagawa et al., 1999) (116 syllables, a left-to-right topology, 4 emitting states, and a single Gaussian mixture with full covariance matrix), which is trained from academic presentation speech data and simulated public speech data of CSJ (Corpus of Spon-taneous Japanese) (Maekawa, 2003). The acoustic analysis condition of this stage is shown in Table 3.
Based on a preliminary experiment, we set
P(F illeri|wi) = 0.05, P(wi+1|wi) = 0.475 and
P(spi|wi) = 0.475for the alignment constraint shown in Fig.2.
4.2. Baseline Method
(Paulik and Panchapagesan, 2011) proposed that regions, where loose transcriptions and LVCSR outputs were iden-tical, were effective as training labels of lightly supervised speaker adaptation. As the first step of their method, the word alignment between loose transcriptions and LVCSR outputs was computed in the same manner as it was done for word error rate evaluation. And then, identical regions which were equal or longer than the specified threshold were considered as precise regions and were used as train-ing labels of lightly supervised speaker adaptation. The following baseline method based on their idea is used in our experiment.
(a) The first step is to compute the word alignment be-tween edited transcriptions and LVCSR outputs in the same manner as it is done for word error rate evalua-tion.
(b) The second step is to extract identical regions between them, which are contain equal or more words than the specified threshold, as precise regions.
Figure 4: Recall-precision curve for detection of edited re-gions
(c) The remaining regions are considered as edited re-gions.
As the LVCSR decoder for the baseline method, SPO-JUS++ is also used. Its acoustic model of the baseline method is the Japanese context-dependent syllable-based acoustic model, which contains 928 syllable models with 8 left contexts (5 vowels, silence, /N/, and short pause includ-ing /q/). It was trained from academic presentation speech data of CSJ. Each continuous density HMM had 5 states, and 4 of them had pdfs of output probability. Each pdf consisted of 64 Gaussians with diagonal covariance ma-trices. As the language model of the baseline method, a word-based trigram model with Witten-Bell backoff, which was trained from the Japanese National Diet Record con-tains 38,668K words in 1,083 meetings, is employed. Be-cause the edited transcriptions of the Japanese National Diet Record contain neither filled pause nor silent pause, our previously proposed filler prediction model (Ohta et al., 2008) and pause insertion model (Ohta et al., 2009) are em-ployed to estimate the probability of filled pause and silent pause.
4.3. Detection Results of Edited Regions
Figure 5: Detection of edited regions using LVCSR
Fig.5 shows the results of our proposed method, the base-line method using LVCSR, and the combination method of these two methods. The combination method consists of the following three steps:
(a) the first step is to compute the word alignment be-tween edited transcriptions and LVCSR outputs in the same manner as it is done for word error rate evalua-tion,
(b) the second step is to extract identical regions between them, which contain equal or more words than the specified threshold, as precise regions, and
(c) the last step is to employ our proposed method to ex-tract precise regions from the remaining regions.
Fig.5 shows that the performance of our proposed method and one of the baseline method using LVCSR outputs are comparable because LVCSR performance of the Japanese National Diet Record is not high as shown in No Adap-tationrow of Table 4. Therefore, the performance of the combination method is also comparable.
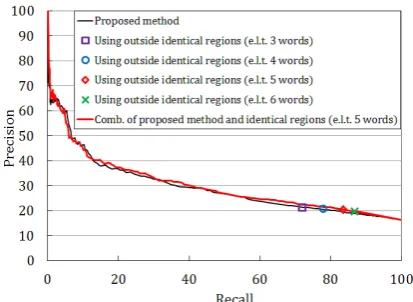
4.4. Detection Results of Precise Regions
Fig. 6 shows the recall-precision curve of the detection of precise regions. As shown in Fig. 6, the ratio of precise regions without our method (recall = 100%) is 80.1% on the syllable level. This is improved to 86.5% by fil-tering 60% of the whole transcription (recall= 60%) with our method. This change is same to an improvement from 83.7% to 88.9% on the word level.
Fig. 6 shows that the baseline method using the identical regions which are equal or longer than 5 words achieves a slightly better precision than our proposed method. There-fore, the combination method achieves a bit better perfor-mance for the40%≤recall≤60%section.
4.5. Lightly Supervised Speaker Adaptation
This section describes the result of the lightly super-vised speaker adaptation experiment using automatically extracted precise regions as training labels.
Maximum A Posteriori (MAP) estimation method is em-ployed for speaker adaptation of HMMs (Tsurumi and Nak-agawa, 1994). All training and adaptation of HMMs were performed using the HTK HMM toolkit ver. 3.4.1 (Young
Figure 6: Detection of precise regions (syllable units)
et al., 2006). Because transcriptions of Japanese National Diet Record contain many ideographic characters, CRF-based Japanese morphological analyzer MeCab ver. 0.963
(with UniDic ver. 1.3.124) is employed to convert them
into syllable sequences. The LVCSR decoder, its acous-tic model, and its language model are already described in Section 4.2..
We prepared 5,642 syllables of 3 speakers for training, and 4,411 syllables of same speakers for testing. The result is shown in Table 4. The column Prec. shows the ratio of the correct labels in the training labels of speaker adapta-tion, and the columnCoverage column shows the ratio of syllables covered by the training labels of speaker adapta-tion in the testing syllables. The first row No adaptation shows the result without speaker adaptation. The second rowUsing edited transcriptionsshows the baseline result, in which the whole edited transcriptions are used for train-ing labels. The another baseline result uses identical re-gions which are extracted by the method described in Sec-tion 4.2. as training labels is shown in the third rowUsing identical regions. The sixth rowUsing precise transcrip-tions shows the upper bound of our proposed method, in which the precise transcriptions are manually prepared and used for training labels5. The fourth rowUsing extracted precise regions shows the result of our proposed method using the automatically extracted precise regions under the conditionrecall= 90%.
As shown in Table 4, our proposed method achieves a higher performance than baselines, although our proposed method uses less training labels. It means that automatic extraction of precise regions is effective to refine edited transcriptions for lightly supervised speaker adaptation of acoustic models. Table 4 shows that the baseline method using LVCSR, which gives the higher precision and the lower coverage of the training labels than our proposed method, achieves a lower speaker adaptation result. This fact suggests that the coverage of the training labels is also
3
http://mecab.sourceforge.net/ 4
http://www.tokuteicorpus.jp/dist/
5Because editing operations of Japanese National Diet Record
Table 4: Results of lightly supervised speaker adaptation
Training label statistics LVCSR performance Adaptation method # of labels Prec. (%) Coverage (%) Cor. (%) Acc. (%)
No adaptation 0 — 0 71.5 67.2
Using edited transcriptions 5,155 (91.4%) 80.1 84.3 74.3 70.6
Using identical regions (e.l.t. 5 words) 1,728 (30.6%) 90.0 69.3 73.9 70.1 Using extracted precise regions (recall= 90%) 4,056 (71.9%) 83.0 83.0 75.1 70.7 Combination of the above two methods 4,212 (74.7%) 83.5 83.2 75.0 71.0 Using precise transcriptions 5,642 (100.0%) 100.0 92.6 76.2 71.6
important as well as their precision is.
Because there is no big difference between the perfor-mance of our proposed method to extract precise regions and one of the combination method under the condition
recall= 90%as shown in Fig.6, there is only a bit differ-ence between the speaker adaptation result of our proposed method and one of the combination method.
5.
Conclusion
In this paper, we proposed developing partially-transcribed speech corpus from editedtranscriptions based on an au-tomatic detection method of precise regions. The evalua-tion experiments using the Japanese Naevalua-tional Diet Record showed that our proposed method achieves86.5%precision under the conditionrecall= 60%. Furthermore, the exper-iment showed that precise regions extracted automatically by our proposed method was effective as the training data of lightly supervised speaker adaptation of acoustic models.
6.
References
Norbert Braunschweiler, Mark J. F. Gales, and Sabine Buchholz. 2010. Lightly supervised recognition for au-tomatic alignment of large coherent speech recordings. In Proceeding of INTERSPEECH-2010, pages 2222– 2225.
Y. Fujii, K. Yamamoto, and S. Nakagawa. 2011. Large vocabulary speech recognition system: Spojus++. In Proceeding of 11th WSEAS International Conference MUSP–11.
Taku Kudoh. TinySVM. http://chasen.org/
˜taku/software/TinySVM/.
Lori Lamel, Jean Luc Gauvain, and Gilles Adda. 2001. Investigating lightly supervised acoustic model training. InProcessing of International Conference on Acoustics, Speech, and Signal Processing (ICASSP), pages 477– 480.
K. Maekawa. 2003. Corpus of spontaneous japanese: Its design and evaluation. In Proceeding of the ISCA & IEEE Workshop on Spontaneous Speech Processing and Recognition (SSPR2003), pages 7–12.
I. Maruyama, Y. Abe, T. Ehara, and K. Shirai. 1999. A study on detecting time of superimposing captions in documentary programs. In Proceeding of the Autumn Meeting of Acoustical Society of Japan (ASJ), pages 177–178. (in Japanese).
S. Nakagawa, K. Hanai, K. Yamamoto, and N. Minematsu. 1999. Comparison of syllable-based hmms and triphone-based hmms in japanese speech recognition. In Pro-ceeding of International Workshop on Automatic Speech Recognition and Understanding, pages 393–396. Kengo Ohta, Masatoshi Tsuchiya, and Seiichi Nakagawa.
2008. Evaluating spoken language model based on filler prediction model in speech recognition. InProceedings of Interspeech2008, pages 1558–1561, September. Kengo Ohta, Tsuchiya Masatoshi, and Seiichi Nakagawa.
2009. Effective use of pause information in language modelling for speech recognition. InProceedings of In-terspeech2009, pages 2691–2694, September.
Kengo Ohta, Tsuchiya Masatoshi, and Seiichi Nakagawa. 2011a. Automatic detection of edited parts in inexact transcribed corpora based on alignment between edited transcription and corresponding utterance. In Proceed-ing of 11th WSEAS International Conference MUSP–11. Kengo Ohta, Masatoshi Tsuchiya, and Seiichi Nakagawa. 2011b. Detection of precisely transcribed parts from in-exact transcribed corpus. In Proceedings of the Auto-matic Speech Recognition and Understanding Workshop, pages 541–546.
Matthias Paulik and Panchi Panchapagesan. 2011. Lever-aging large amounts of loosely transcribed corporate videos for acoustic model training. In Proceedings of the Automatic Speech Recognition and Understanding Workshop, pages 95–100.
Brandon C. Roy, Soroush Vosoughi, and Deb Roy. 2010. Automatic estimation of transcription accuracy and dif-ficulty. InProceeding of Interspeech, pages 1902–1905. Yutaka Tsurumi and Seiichi Nakagawa. 1994. An unsuper-vised speaker adaptation method for cotinuous parameter hmm by maximum a posteriori probability estimation. In Proceedings of ICSLP’94, pages 431–434.
T. Watanabe, H. Nishizaki, T. Utsuro, and S. Nakagawa. 2004. Unsupervised speaker adaptation using high con-fidence portion recognition results by multiple recogni-tion systems. In Proceedings of International Confer-ence Spoken Language Processing, pages 1989–1992. S. J. Young, G. Evermann, M. J. F. Gales, T. Hain,