University of Twente
EEMCS / Electrical Engineering
Control Engineering
Data logging and monitoring
for real-time systems
Ronald Posthumus
MSc Report
Supervisors: prof.dr.ir. J. van Amerongen dr.ir. J.F. Broenink ir. P.M. Visser ir. M.A. Groothuis
May 2007
i
Summary
At the Control Engineering group control schemes are designed. These control schemes need to be tested and validated. Therefore it is necessary to implement the control schemes on digital computers. The ForSee toolchain is an example of a set of tools which have been developed for this purpose. The ForSee toolchain helps the mechatronic design engineer to implement the control scheme on a digital computer. Data logging and monitoring is necessary during this implementation. At the start of this project, data logging and monitoring is not supported by the ForSee toolchain.
A framework for data logging and monitoring is designed and implemented during this project.
An analysis has been performed in order to get insight in data logging and monitoring. Available types of digital computers and setups at the Control Engineering group and existing solutions for data logging and monitoring have been analyzed.
At the start of this project the ForSee toolchain was not ready for adding extra functionality.
Therefore, the ForSee toolchain is prepared to make adding extra functionality possible. The ForSee toolchain consists of separated tools with own user interfaces (GUI). A framework for one integrated GUI has been designed.
The framework for data logging and monitoring is flexible in sense of supported digital computers and the possibilities for post-processing. Flexibility is guaranteed by the use of plug-ins. With the use of plug-ins it is made easy to add support for new digital computers and types of post-processing. An implementation has been made and is integrated to the GUI framework of the ForSee toolchain.
The framework for data logging and monitoring has been designed and implemented. With the use of a plug-in system for data logging and monitoring, flexibility is guaranteed. This framework is
successfully integrated into the ForSee toolchain which has been updated to enable further integrations. A prototype of the GUI for data logging and monitoring has been created. To
demonstrate the framework, three plug-ins have been created. One plug-in for targets which use the targetdaemon is created. Two plug-ins for post-processing have been created: file and 20-sim. With these plug-ins available, the framework is demonstrated on the paper path setup.
The GUI of the implementation which has been created can be improved. Distributed systems and targets with multiple applications are supported by the framework for data logging and monitoring but are not implemented. The demonstration of the framework for data logging and monitoring was performed on the PC/104 with targetdaemon. Other targets can also be used in the future in
Samenvatting
Op de vakgroep Control Engineering worden diverse regelaars ontworpen. Deze regelaars moeten worden getest en gevalideerd. Hiervoor moet het mogelijk zijn om deze regelaars te implementeren op een digitale computer. De ForSee toolchain is een voorbeeld van een aantal tools die beschikbaar zijn voor dit doel. De mechatronische engineer wordt door de ForSee toolchain geholpen om de regelaar te implementeren op een digitale computer. Data logging en monitoring is noodzakelijk tijdens deze implementatie. Op het moment van starten van dit project, data logging en monitoring is niet beschikbaar in de ForSee toolchain.
Een framework voor data logging en monitoring is onworpen en geïmplementeerd tijdens dit project.
Een analyse is gedaan om inzicht te krijgen in data logging en monitoring. Beschikbare soorten digitale computers en setups op de vakgroep Control Engineering en een bestaande oplossing voor data logging en monitoring zijn geanalyseerd.
Op het moment van starten van dit project was de ForSee toolchain niet klaar om te worden uitgebreid met extra functionaliteit. Daarom is de ForSee toolchain klaargemaakt om het toevoegen van extra functionaliteit mogelijk te maken. De ForSee toolchain bestond uit diverse aparte tools met elk zijn eigen user interface (GUI). Een framework voor 1 geïntegreerde GUI is ontworpen.
Het framework voor data logging en monitoring is flexibel in termen van ondersteunde digitale computers en mogelijkheden voor post-processing. Deze flexibitliteit is gegarandeerd met het gebruik van plug-in’s. Het gebruik van plug-in’s maakt het mogelijk om eenvoudig ondersteuning voor nieuwe digitale computers en types post-processing toe te voegen. Een implementatie is gemaakt en deze is toegevoegd aan het nieuwe GUI framework van de ForSee toolchain.
Het framework voor data logging en monitoring is ontworpen en geïmplementeerd. Het gebruik van plug-in’s garandeerd flexibiliteit. Dit framework is succesvol toegevoegd aan de ForSee toolchain welke is klaargemaakt om verdere uitbreidingen mogelijk te maken. Een prototype van de GUI voor data logging en monitoring is gemaakt. Een plug-in voor targets die de targetdaemon gebruiken is gemaakt. Verder zijn er 2 plug-in’s voor post-processing gemaakt; bestand en 20-sim. Met deze plug-in’s beschikbaar is het framework gedemonstreerd op de paper path setup.
iii
1.4 Outline of the report...8
2 Analysis of data logging and monitoring ...9
2.1 Terminology and principles ...9
2.2 Available targets and setups ...10
2.3 Related work: OLE for Process Control (OPC)...11
2.4 Framework ...12
2.5 Conclusions...13
3 Preparation of theForSee toolchain ...15
3.1 Finalizing the Target Connector : code modification ...15
3.1.1 Tokens ...15
3.1.2 Plug-in system for tokens ...15
3.2 Refinement of the GUI framework for the ForSee toolchain ...16
3.3 Conclusions...17
4 Design and implementation of the framework ...19
4.1 Approach...19
4.2 Routing the log plug-ins ...20
4.3 Interface between Logger and log plug-ins ...21
4.4 Implementation ...21
4.5 GUI ...22
4.6 Conclusions...24
5 Case / demonstration ...27
5.1 Paperpath setup ...27
5.2 Data logging...28
5.3 Monitoring ...29
5.4 Conclusions...30
6 Conclusions and recommendations ...33
6.1 Conclusions...33
6.2 Recommendations...33
Appendix A – Token replacement plug-ins ...35
Compiling the token replacement plug-in ...37
Appendix B – Howto add panels to the GUI...38
Introduction ...38
Generated class: dlgMyExample...38
The custom class: MyExample ...39
Integration in the main program...41
Example Usage...42
Appendix C – Log plug-ins...43
Naming convention ...43
Return values...43
Multiple instances ...43
Data storage...43
Interface...44
Compiling the log plug-in ...45
Appendix D–Using DialogBlocks for pluginGUI...46
Appendix E – Information in the toolchain...51
Appendix F – target experiment (TXP) file ...52
Appendix G – Additional recommendations...54
Introduction 5
1 Introduction
During design and development of real-time systems, support for logging and monitoring data signals is necessary. The real-time systems used at the Control Engineering group are embedded control systems (ECS). Different setups containing one or more ECS have been made. The computers in these setups may vary from a microcontroller to a PC. An example of such a setup is the paper path, see Figure 1.
Figure 1 Paper path setup
The mechanical part of this setup in on top of the cart. On the bottom of the cart, four ECS are
available. The setup uses at the moment one ECS for controlling the plant. A more detailed description of the plant and the ECS can be found in chapter 5 where the demonstration of data logging and monitoring for this setup is explained.
Currently, for each setup, different tools for data logging and monitoring are used. It is desirable to have the same framework for all setups with a uniform interface to the user. Then it is not necessary to create a new tool for data logging and monitoring when a new setup is introduced.
1.1 Design trajectory
Physical
Figure 2 Design trajectory for embedded control systems software
A short description of each step is given below.
Physical system modeling. In this step the plant is modeled and verified by simulation. If necessary, more iterations can be used to improve the model of the plant.
Control law design. The design of the controller is done in this step, followed by verification by simulation.
Embedded control system implementation. The controller must be translated into computer code. Furthermore, components (e.g. I/O) considered ideal before are now modeled more precisely. Furthermore, effects of the hardware must be taken into account (rounding, timing, precision). This step is also verified by simulation.
Realization. Transformation to the real embedded system. This can be done stepwise by using hardware-in-the-loop (HIL) simulation.
The ForSee toolchain is used in the third and fourth step.
1.2 ForSee toolchain
The ForSee toolchain (Visser et al., 2007) is used to help the mechatronic engineer implement the designed controller (Figure 3). To implement a controller on an ECS, the designed controller must be transformed into computer code (via code generation). Therefore, the modeling tool which is used in the first two steps of Figure 2 must be capable to transform models and algorithms into computer code. Examples of modeling tools (with or without simulation engine) are 20-sim, gCSP and
Matlab/Simulink. After the code generation has been finished, the ForSee toolchain is used to make the generated code ready for execution on a target. A target is the computer on which an application is deployed. The term target must not be confused with setup, which contains one or more targets and one or more plants.
target
ForSee
modeling tool
Figure 3 From modeling tool to target
Introduction 7
Figure 4 ForSee toolchain
Connect,
The model of the controller does not contain information about the target. Therefore it is necessary to indicate which inputs and outputs of the model are connected to which pins on the target. This information is added to the generated code.
Configure
Some targets need extra configuration, e.g. selecting the processor speed. Furthermore, configuration for data logging and monitoring might be necessary.
Compile
The code must be compiled and linked in order to get an executable application.
Command
The resulting application from compilation must be deployed on the target. Starting, pausing and stopping the application is functionality for command. For fine tuning purposes the modification of variables is necessary. Data logging and monitoring is included in this C.
The structure of the toolchain can be different for each target. Not every target does support each step or sub-steps in the toolchain or there are other tools outside the toolchain which covers certain steps.
At the start of this project, Connect is not completely finished. At the moment users can connect modelports to pins but the functionality to add this information to the code framework (code
modification) was not finished. The remainder of Connect will be designed and implemented during this project. The tool used for this C is the Target Connector.
The data logging and monitoring part of Command is designed and implemented during this project.
The four C’s from the toolchain are separate tools. These separate tools will be merged into one user interface. This is more consistent and friendly to the user.
1.3 Approach
The main aspects of the assignment are described in the remainder of this section.
Universal. The framework must be universal in terms of supported targets and post-processing of the logged or monitored data. Usefulness of the framework is only gained if universality can be
guaranteed for targets and post-processing. The framework for data logging and monitoring consists of 2 parts; specification and implementation. The specification must preserve the universal character. The implementation will be a software application based upon the specification. The GUI of the Logger tool will be a prototype to demonstrate the functionality. In terms of basic use this GUI must be mature.
Integration in the ForSee toolchain.The framework for data logging and monitoring must be integrated in the ForSee toolchain. Therefore the toolchain must be ready for integration. In order to integrate data logging and monitoring, the Target Connector must be completed first. Another important part of the integration is the graphical user interface (GUI). Currently, all tools are
separated. In the future, the tools in the toolchain will be combined into one GUI. To enable one GUI in combination with a modular structure, a framework has to be defined. The logger will be the first step in this single-GUI integration.
Demonstration.The setup which will be used for the demonstration is the paper path setup. The types of post-processing which will be demonstrated are a file output and 20-sim. The file can be imported in a tool (e.g. excel or 20-sim). Furthermore, 20-sim can be used to visualize the data at run-time.
1.4 Outline of the report
To design and implement a framework for data logging and monitoring an analysis has been
performed first. General concepts, related work and existing setups and targets have been researched. This analysis is discussed in chapter 2.
The framework for data logging and monitoring must be integrated into the ForSee toolchain. To make this and eventually other extensions possible for the ForSee toolchain, some preparation had to be done. First preparation is implementing the functionality for code modification in the Target Connector. The second preparation is refine the GUI framework which is used for the ForSee toolchain. The preparations of the ForSee toolchain are discussed in chapter 3.
Chapter 4 discusses the framework for data logging and monitoring. The design and implementation are explained. An important part of the framework is the interface between the log plug-ins and Logger, this interface is summarized in this chapter. The GUI which has been created for the Logger is explained
The framework for data logging and monitoring is demonstrated on a setup. The necessary log plug-ins are implemented. The paper path setup has been used as demonstration setup. This case is discussed in chapter 5.
Conclusions and recommendations are presented in chapter 6.
Appendix A gives a description of the token replacement plug-in. This appendix can be used as starting point to write a new token plug-in.
A manual which explains the process of adding a new panel to the GUI framework is included in Appendix B. This appendix gives detailed information about adding panels to the GUI.
The detailed description of the log plug-ins can be found in Appendix C. This appendix can be used as starting point for the development of a new log plug-in. Because most log plug-ins will contain a GUI, Appendix D contains a manual to add a GUI to a log plug-in.
Analysis of data logging and monitoring 9
2 Analysis of data logging and monitoring
This chapter deals with the analysis which is required to propose a solution for data logging and monitoring. General concepts of data logging and monitoring are presented in section 2.1. After having the concepts clear, related work is discussed in section 2.3. As described in chapter 1, different setups are available at the control engineering group with different approaches for data logging and monitoring. These setups are summarized in section 2.2.
2.1 Terminology and principles
During the development and deployment of an ECS, data logging and monitoring of the application on a target is useful.
The process referenced as data logging is the retrieval of data for a certain period of time. This data is available for post-processing after data logging has been finished. The data for all timestamps is stored. The data which is available after data logging can be further analyzed.
Monitoring is the process of retrieving data at run-time. This data is directly available for post-processing. Monitoring can be compared with sampling, only the data at the sampled timestamps is available (snapshots). Monitoring is used for diagnose or maintenance.
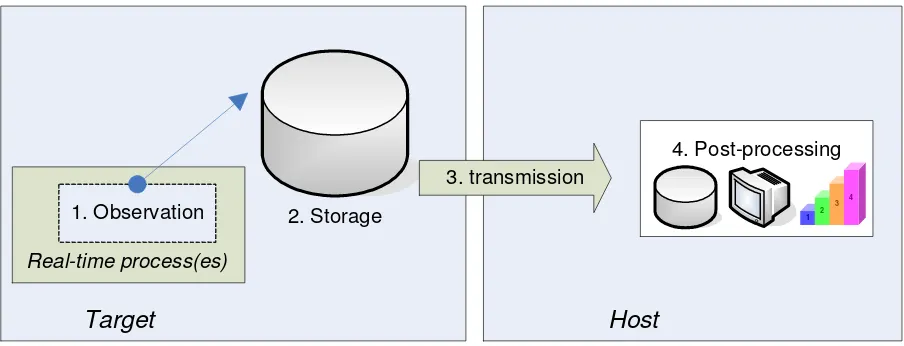
A model for data logging/monitoring is defined in (ten Berge, 2005). The distributed structure (Figure 5) consists of four activities: observation (data generation), storage, transmission and post-processing.
2. Storage
Figure 5 Distributed structure
Observation is the retrieval of data from the real-time process. The observed data is stored in local storage. Observation and storage is performed on the target itself. The post-processing of the data is performed on a host. The host has enough facilities (CPU power, enough storage) to perform post-processing. In order to get the data on the host, transmission is necessary. It might be possible that observation and transmission are separate, parallel running processes which both can access the storage at the same time.
3. Storage
Figure 6 Alternative distributed structure
This alternative structure enables data logging/monitoring on limited targets. These limited targets have often a small amount of storage, the alternative structure compensates this limitation.
2.2 Available targets and setups
This section describes the different setups and targets which are available at the Control Engineering group. A setup may contain one or more targets. The possibilities for data logging and monitoring depend heavily on the target(s) used. An inventory has been made in order to give an overview of the setups and targets with their possibilities for data logging and monitoring.
Table 1 gives an overview of targets.
PC PC/104 ARM ADSP AVR
Table 1 Available targets
Analysis of data logging and monitoring 11
Plotter Dribbel Tripod
Target PC/104 PC/104 PC/104 PC/104 AVR PC
Output special tool developed by
CLP
file file file 20-sim,
file
file
Table 2 Available setups
The possibilities for data logging and monitoring depend heavily on the operating system used. Currently, data logging and monitoring is not implemented for the CT-library. The Cosateq ProSys-RTsoftware (Cosateq, 2006) used for the mechatronic demonstrator provides good facilities for data logging and monitoring. However, this software has drawbacks (Dirne, 2005). Due to these drawbacks this framework is not maintainable and is therefore not used on the other setups. The targetdaemon provides an interface to communicate with the target. Currently, the targetdaemon is used in combination with commandline tools, therefore data logging and monitoring are difficult at the moment.
CLP (CLP, 2005) developed a tool which is designed to work with the Cosateq ProSys-RT software. Data can be stored into a file and a run-time animation of the signals and 3D-model are displayed.
2.3 Related work: OLE for Process Control (OPC)
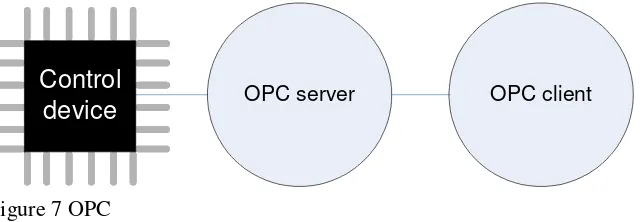
OPC (OPC, 2007) is a standard for process control. OLE stands for Object Linking and Embedding. OPC defines a set of objects, interfaces and methods. These can be used for the communication of real-time plant data between the control device(s) (e.g. PLC’s) and software applications (e.g. Supervisory Control And Data Acquisition (SCADA), Human Machine Interface(HMI)). OPC is based on Microsoft’s OLE, COM and DCOM technologies (Microsoft, 2007). These technologies are used for data transfer and communication between software objects. Using OPC, any software
application which is aware of OPC interfaces (client), can communicate with any control device which has an OPC server attached (Figure 7). OPC covers the gap between applications and process control hardware.
OPC server OPC client
Control
device
Figure 7 OPC
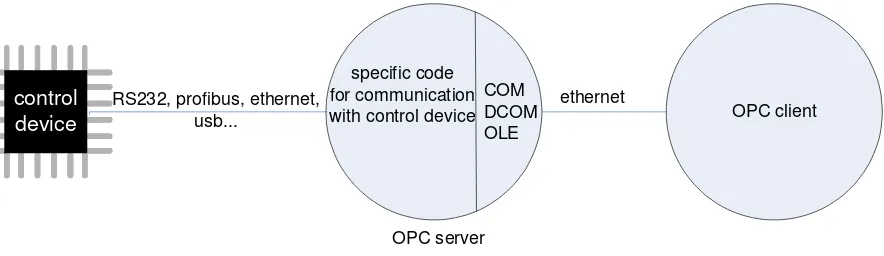
Each control device needs to be connected to an OPC server. This server uses the OLE, COM and DCOM technologies to communicate with the application that acts as an OPC client. The OPC server consists of 2 parts: specific functionality according to the device and OLE/COM/DCOM interfaces (Figure 8).
2.1 and the definitions from OPC (between the brackets), OPC seems to be useful for data logging and monitoring.
The OPC specification does specify the aspects needed for data logging and monitoring. However, currently it is unknown what the influence is of the overhead which comes with such a specification. Because the specification is the preferred method for use in the industrial automation area, it is not for sure that OPC is useful with embedded real-time devices. Some challenges to use OPC on embedded real-time devices are defined in (Serughetti, 2007). Important problems are the memory which is available and the timing constrains (performance) on a real-time device. These problems become really a problem when using limited targets like ADSP of AVR
OPC client
Figure 8 OPC structure
To use OPC, an OPC server must be written for each target. A part of such a server consists of the OLE/COM/DCOM interface (Figure 8). Writing such an interface from scratch is a lot of work. To speed up the process of writing an OPC server, code frameworks are available. A framework consists of completed OLE/COM/DCOM interfaces; the only part to develop is the part which is referred as ‘specific code’ in Figure 8. The costs for a framework start at around €800,-.
Each client which contains an OPC interface can communicate with each OPC server. Matlab and LabView can act as an OPC client.
There has been chosen not to use OPC. If OPC is used, a feasibility study must be performed first. A feasibility study for using OPC with real-time devices is an assignment by itself. To use and test OPC an OPC server has to be written for different real-time devices which are available at the Control Engineering group. The development of these OPC servers is straightforward and therefore not suitable to do during this project. Furthermore, the doubts about the usability of OPC on limited targets leads to the decision not to use OPC. These simple targets do exist and are used at the Control Engineering group. For this reason data logging and monitoring must be possible for limited targets.
2.4 Framework
The structure for data logging and monitoring consists of two parts; target and host (Figure 5 and Figure 6). The approach for data logging and monitoring must be universal. A wide range of different targets must be supported and different types of post-processing (file, database, 20-sim, etc) must be possible.
Analysis of data logging and monitoring 13
Logger input
file, database, 3rd party software, ... output
target
Figure 9 Interfaces with Logger tool
2.5 Conclusions
Data logging and monitoring are explained. It has been explained that to create a data logging and monitoring framework which is universal, the most profit can be get on the host side. Important terms for this project are defined.
Some research has been performed on OPC, OPC will not be used for this project.
The available setups and targets have been analyzed. Also the currently used methods for data logging and monitoring are inventoried.
To implement a new framework for data logging and monitoring into the ForSee toolchain, some preparations have to be made. The preparation of the ForSee toolchain for further extensions is discussed in the next chapter.
Preparation of the ForSee toolchain 15
3 Preparation of the
ForSee toolchain
In order to integrate the logger into the ForSee toolchain, the ForSee toolchain must be prepared for the integration. The preparation of the toolchain consists of two parts:
• Finalizing the Target Connector. • Refinement of the GUI framework.
These preparations are discussed in this chapter.
3.1 Finalizing the Target Connector: code modification
The functionality to connect the inputs and output ports from the model to pins on the target was ready and working. The second part of the functionality which the Target Connector must provide, code modification, was not ready.
The process of code modification which is to be provided by the Target Connector must add the ‘missing’ target specific information to the generated code. Examples are:
- Read and write functions for I/O access. - Definition of include files.
- Initialization functions for I/O. - Termination functions for I/O.
- Declaration of variables used by the different functions described above.
3.1.1 Tokens
To let the Target Connector know where which information should be placed in the generated code, tokens are used (Posthumus, 2006). A token in this situation is used as a placeholder for information. Tokens can be defined as follows: %TOKEN%. Such a token can be replaced with any text. To indicate a read function one can define the token as %TC_READ_ROUTINE%. The prefix ‘TC_’ is used to indicate that this token is meant for the Target Connector. This to avoid naming conflicts with other tools. It is possible that another tool has to process the generated code after the Target Connector and that this tool also uses tokens.
Code modification is basically searching and replacing tokens with text. To ensure the flexibility of this process in terms of allowed tokens, it must be possible to add, remove or edit the list of
recognized tokens. Furthermore, the text that will replace the token is not fixed by definition. The text that replaces the token can be dependent on the created connections by the user. If the model where the code has been generated for has 2 inputs, 2 read functions are needed. The amount of ports is not the only information which is needed to compose the right text to replace. The information about the already created connections is also necessary to compose the correct read functions.
Because of the fact that the replacement text is not fixed by definition, each token in the list of recognized tokens needs a function which composes the right replacement text.
To enable flexibility of the code modification the choice was made to use a plug-in system for the search and replacement of tokens. The dedicated functions for each token can be defined in such a plug-in. In this way tokens can be added without affecting the implementation of the Target Connector itself
3.1.2 Plug-in system for tokens
The how (procedures to compose the replacement text) is described in one or more plug-in(s). The what (information necessary for composition of replacement text) is described in the tcf and txp (Figure 10).
Figure 10 Position of information for token replacement
The tokens which are indicated in the tcf are called primary tokens. It is possible that the composed replacement text also contains tokens (secondary tokens). The processing of these secondary tokens is done in the plug-in. The idea of tokens-in-tokens can be extended to an unlimited amount of levels (recursive). Advantage is a more generic approach. The level of tokens is not bound to a certain amount. Disadvantage is that such an approach is hard to understand for a human because of the recursive character. Because the functions for composing the replacement text are written by hand, this approach is sensitive for errors. Each token that must be replaced has a function associated in a plug-in which describes how the token is replaced. When using a recursive approach, the path of the loop is difficutl to write down beforehand and therefore writing correct functions is hard.
Each plug-in must provide the following functions:
- InitPlugin().Called by the Target Connector after the code modify has been started. - GetTokens().Called by the Target Connector during startup. Each plugin is loaded and this
function is called immediately.
- StartModify().Called by the Target Connector when a token has been found and this plug-in must be plug-involved.
The detailed information about these functions can be found in appendix A.
3.2 Refinement of the GUI framework for the ForSee toolchain
The framework for data logging and monitoring must fit in the ForSee toolchain. Currently, the toolchain consists of physically separated tools. To make the toolchain more mature and consistent, it is wishful to have one graphical user interface (GUI) which consists of all tools. The refinement of the ForSee toolchain was started by (Posthumus, 2006) with a re-design of the Hardware Connector. The new tool which was created is called Target Connector. The Target Connector is used as the starting point for the GUI framework. The logger will be integrated into this framework. At a later stage, the other tools can also be integrated into this new framework.
The GUI framework will contain a notebook with several tabs where the tools reside (Figure 11).
Figure 11 Notebook
Preparation of the ForSee toolchain 17
Figure 12 Panel
Figure 13 Notebook with panel
The specification of the panels are stored in separate files. In this way it is possible to create tools including the GUI independently. Appendix B explains the integration of all separate tools and their GUIs to the GUI framework.
3.3 Conclusions
The code modification functionality has been added to the Target Connector. This code modification is structured in such a way that changes in the future in sense of tokens can be easily done. A
framework for the GUI of the ForSee toolchain has been presented.
With the Target Connector finished and a new GUI framework, the ForSee toolchain can be extended with other functionality like data logging and monitoring.
Design and implementation of the framework 19
4 Design and implementation of the framework
This chapter discusses the design and implementation of the data logging and monitoring framework. The framework consists of two parts: specification and implementation.
The tool which is referred as Logger is the tool in the ForSee toolchain which performs the data logging and monitoring. The Logger is the implementation of the framework. The framework must be able to handle a wide range of different targets. If a new target is introduced, it must be possible to use this target without changing the implementation of the logger. This requirement holds also for post-processing.
4.1 Approach
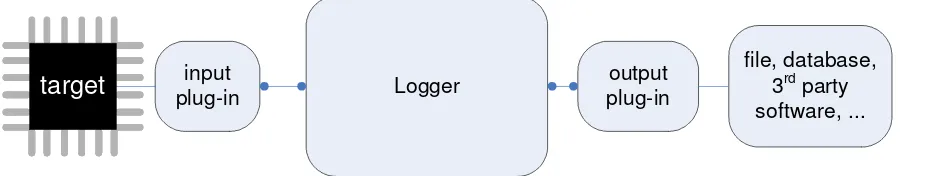
The Logger has interfaces on 2 sides: target and post-processing. To preserve flexibility with respect to both interfaces, a plug-in system is chosen. Without the use of plug-ins the functionality for inputs and outputs is included in the implementation of the Logger. If a input or output must be changed or added, the implementation of the Logger must be changed. With the use of plug-ins the functionality for inputs and outputs can be added or changed outside the Logger implementation. When a new input or output is introduced, the implementation of the Logger does not need any modifications.
Each target as well each post-processing requires a dedicated plug-in. The interface to the target is referred as input plug-in interface. The interface to the post-processing is referred as outputplug-in interface.
Logger input
plug-in
file, database, 3rd party software, ... output
plug-in
target
Figure 14 Plug-in system
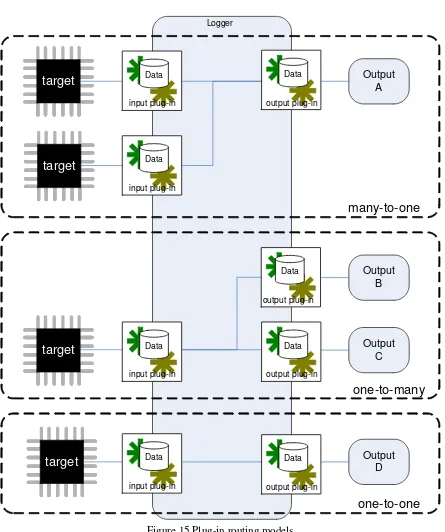
4.2 Routing the log plug-ins
The Logger supports multiple inputs and outputs. It is possible to route the plug-ins (Figure 15). The possible routing models are:
- Many-to-One.
Figure 15 Plug-in routing models
Design and implementation of the framework 21
4.3 Interface between Logger and log plug-ins
The interface of the log plug-ins for input and output are almost the same. The ‘basic’ interface is summarized below:
Some specific additions for the input log plug-in: - Read().
- GetModelInfo().
Some specific additions for the output log plug-in: - WriteDataBlock().
- WriteDataBuffer().
A more detailed description of these functions can be found in appendix C and in the doxygen documentation. Furthermore the detailed structure of a log plug-in is explained in this appendix.
4.4 Implementation
The log plug-ins are implemented as a dynamic link library (dll). It must be possible to use more instances of a plug-in (e.g. multiple files). Loading a dll more than once results in a re-load of the dll: it is not possible to instantiate more than one instance of a dll. This is the default behavior of operating systems. To overcome this behavior, the instantiation of a plug-in is performed via instantiations of classes (objects). Each object does contain the data which is necessary to let the dll work correctly (Figure 16).
object object object log plug-in
Figure 16 Objects for log plug-in
The interfaces which are defined for the input and output log plug-ins are the interfaces with the Logger. The developer of a plug-in is completely free in the interfaces to the ‘real’ input or output (RS232, TCP/IP, CAN, etc).
It can be necessary to configure a plug-in. Each plug-in may have a dialog to configure. This dialog is ‘stored’ inside the dll. With this approach, the developer of a plug-in has the freedom to design his own GUI for a plug-in. Storage of the information from the GUI is done in the target experiment file (txp). The txp file is the file in which information is stored by the different tools of the toolchain. A general format for settings has been defined: {settingname} – {settingvalue}.
The thread for logging calls the read-function continuous. It is the responsibility of the input plug-in to wait or sleep within this read-function if necessary. Data logging and monitoring cannot run
simultaneously.
4.5 GUI
In order to structure the GUI a few steps have been defined which should be taken in the GUI: 1. Add output log plug-ins.
2. Configure output log plug-ins. 3. Connect output log plug-ins. 4. Configure input log plug-ins. 5. Conect input log plug-ins. 6. Route outputs to inputs.
7. Select variables to log or monitor. 8. Select data logging or monitoring. 9. Configure data logging (if selected). 10. Start.
11. Pause/Resume/Stop (in case of monitoring).
Figure 17 shows the GUI which covers the steps 1, 2 and 3. The list can be seen as a list of available outputs.
Figure 17 GUI for steps 1, 2 and 3
The steps 4,5 and 6 are taken in the GUI which is shown in Figure 18.
Figure 18 GUI for steps 4, 5 and 6
Adding inputs is not available here. When a new target is added, the corresponding input log plug-in which is defined in the tcf is automatically added. This is done to prevent confusion by the user. In this way also the amount of steps to be taken by the user are moderated. The left list is the summary of added input log plug-ins. The right list shows the output log plug-ins which are routed with the selected input.
Design and implementation of the framework 23
Figure 19 Ttree with model variables Figure 20 GUI for steps 8, 9, 10 and 11
The steps 8, 9, 10 and 11 are taken in the GUI shown in Figure 20.
The ‘control’ (start, pause, resume and stop) of data logging or monitoring has strong dependencies with the command part of the ForSee toolchain. Because of the current implementation of the ForSee toolchain, it was too complex to comply with this dependency. Therefore the ‘control’ of data logging and monitoring has been added to the Logger. This ‘control’ must not be confused with the actual control (Command) of the application.
Figure 21 Complete Logger GUI
If the user wants to log data from t=0, logging must be started before the application is started.
However, there are targets which can let the application wait for a ‘start-to-log’ to start the application in sync. with data logging. This situation does not occur for monitoring, monitoring is started at t≠0.
4.6 Conclusions
The framework for data logging and monitoring is presented in Figure 22.
framework
specification = interfaces
implementation = Logger tool
Figure 22 Framework for data logging and monitoring
Besides the Logger tool as implementation, the different input and output log plug-ins are a kind of implementation of the framework.
The plug-in approach has been explained. Also a mapping for using OPC in combination with the plug-in approach has been presented. Routing the input log plug-ins to output log-plugins has been elaborated with the use of three models; one-to-many, many-to-one and one-to-one.
25
If a user wants to use OPC, it is possible to use the mapping shown in Figure 23. The output plug-in acts in this case as an OPC server. This picture is a combination of Figure 7 and Figure 14.
Logger input
plug-in OPC server OPC client output
plug-in
target
Case / demonstration 27
5 Case / demonstration
This chapter discusses a case which was used to demonstrate the framework for data logging and monitoring. In order to enable the demonstration one input log plug-in and two output log plug-ins have been created.
The created input log plug-in supports the targetdaemon. The targetdaemon is explained shortly in the next section. An output plug-in for a file has been created which is used for data logging. The other output plug-in is created for 20-sim and is used for monitoring. If the user wants to use 20-sim to read a file, the first output plug-in must be used.
5.1 Paperpath setup
The framework for data logging and monitoring is demonstrated on the paper path setup (Otto, 2005). Figure 24 shows a schematic overview of this setup.
PIM Paper guides Pinch Sheet Detector Output tray
Figure 24 Overview of the paper path setup
From this figure, four components can be distinguished:
• Pinch. The driving force of the paper path. Consists of a motor which is connected to a set of rubber wheels via a timing belt. These wheels can pinch a sheet and drive it through the path. The complete path counts five pinches.
• Sheet detector. Detects the presence of a sheet by the reflection of light emitted by the sensor. • Paper Input Module (PIM). Consists of the input tray that holds the paper and two pinches that
feed the paper into the path.
• Output tray. A bin that collects the paper after being fed through the path.
Figure 25 PC/104 stack
The input log plug-in must communicate with the targetdaemon. For this purpose, a library is
available. This input log plug-in for the targetdaemon uses this library. In order to communicate with the target, several setting must be done. These settings are done in a dialog which is included in the plug-in, see Figure 26.
Figure 26 GUI for targetdaemon input log plug-in
5.2 Data logging
The targetdaemon provides functionality for data logging. The functions in the library which must be used are:
• LogValMS(). This function starts data logging for a given amount of ticks (timestamps). Log data is stored on the target and must be manually retrieved after the given ticks. • GetLogMS(). This function retrieves the stored log data.
Case / demonstration 29
Figure 27 GUI for file output log plug-in
If the 20-sim header option is selected, this file can easily imported into 20-sim. Figure 28 shows the results of a log displayed in 20-sim.
0
Figure 28 Log results displayed in 20-sim
From Figure 28 it can be seen that data is represented from t=0.
5.3 Monitoring
Monitoring is also supported by the targetdaemon. The function GetValMS() provided by the library can be used for this purpose. This function retrieves the values of the given variables at the moment when the function is called. Monitoring can be established with this function when periodically calling. The output log plug-in for 20-sim is used as output.
Basically, 20-sim does not provide an interface that enables writing to 20-sim. However, it is possible to use dll’s in combination with 20-sim. Such a dll contains a function which is called every
Before monitoring is started in the Logger, the simulator in 20-sim must be started. Figure 29 shows the results of monitoring. The simulator calls the communicate() function from the dll each integration step during simulation.
0.05
Figure 29 Monitor results in 20-sim
Because of the digital nature of the values retrieved from the paper detectors (pd[1] until [pd[4] in Figure 29), the interpolation in 20-sim for this signal is set to ‘zero order hold’. In this way these signals are represented as blocks.
Because monitoring has been started after the application was started the first seconds there was no data retrieved and this results in a blank field in the plot on the left side. The blank field in the plot on the right side is because the simulator was stopped after monitoring was stopped. From the moment that monitoring is stopped the simulator was still running without retrieving data. field on the right.
parameters
string filename = 'xxmonitor.dll'; string function = 'communicate';
variables
real x[1]; real y[20];
code
x = [time];
Case / demonstration 31
what is going on inside the application. With data logging, every timestamp is recorded. Therefore these data is more precise and can be used for further processing.
Because of implementation issues within the targetdaemon the maximum frequency for monitoring is limited at 10 Hz. In other words, the loop in which the GetValMS() function is called a sleep of 100 ms is added. The actual monitor frequency can be calculated using the plot shown in Figure 30. Each block of data retrieved from the target represents the values for the selected variable for a certain timestap. This timestamp is the first value in this datablock. This value is assigned to the x-axis in 20-sim. In order to determine the gained monitoring frequency, these values are plotted. The dots in the figure denote the timestamp retrieved from the target each time GetValMS() was called. By measuring the time between these timestamps one can determine the monitoring frequency.
Figure 30 Determine the monitor frequency
The measured timestamps are: 8.085
8.197 8.308 8.417 8.528
The average time interval between the timestamps is 111 ms. The average monitor frequency is 9 Hz.
It is not within the context of this assignment to investigate in the implementation of the targetdaemon to correct the limitations.
Conclusions and recommendations 33
6 Conclusions and recommendations
6.1 Conclusions
A framework for data logging and monitoring has been designed and implemented. In order to present a proposal, OPC has been investigated globally and an analysis has been performed on available targets and setups at the control engineering group.
The Target Connector has been finished with code modification. With the completion of the Target Connector’s functionality, the Hardware Connector has been replaced. To make the first step in a combined GUI for the whole ForSee toolchain, the GUI framework in which the Target Connector was created has been refined. The logger is the first integration in this new GUI framework.
The proposed plug-in system preserves a flexible interface from Logger to input plug-ins and output plug-ins. The toolchain does not enforce the user to use certain targets and/or post-processing software. If a new target of post-processing is introduced, a plug-in must be created in order to use with the Logger.
A prototype of a GUI for the logger has been made. This GUI enables the user to use most
functionality provided by the data logging and monitoring framework. A maturity step has been made to make the GUI useful for basic use.
Besides the design and implementation of the framework for data logging and monitoring, 3 log plug-ins have been implemented. The input log plug-in for the targetdaemon and the output log plug-plug-ins for file and 20-sim have been made. This is demonstrated by a case.
6.2 Recommendations
The framework for data logging and monitoring can be used for distributed systems and with targets which do run multiple applications. However, the GUI and parts of the implementation are currently not ready to support these aspects.
The GUI of the logger is made as a first prototype in order to show functionality. In the future
representations of information in the GUI may be changed. Favorite variables are now indicated with a bold italic font and the type of element (variable, input or output) is indicated with a color (blue, green and red). The user has to select the variables to log or monitor using ctrl of shift pressed and click with the mouse. A dedicated tree with images to indicate several aspects of an element and e.g. checkboxes to check if a variable must be logged can be used in order to create a better GUI.
The ForSee toolchain is tested for the targetdaemon in combination with PC/104. It might be useful to extend this to other targets like ADSP or ARM. It should be mentioned that the Target Connector is currently already used for the ADSP.
To demonstrate the monitoring functionality, 20-sim was used. The process of using 20-sim for monitoring is a little laborious. It should be much better to have a tool like the monitor for the
mechatronic demonstrator available for monitoring. It might be possible to write an output log plug-in for this tool.
OPC has been investigated globally and was not chosen to use because of uncertainties about the usability for a real-time system and limitations to the user with respect to targets and post-processing to use. In order to test OPC for a real-time system the OPC server must be created. Implementing an OPC server might be an assignment on its own. Writing an OPC server for a target at the control engineering group and test for usefulness might be valuable. If this is done, the mapping presented in Figure 23 can be implemented and tested.
Appendix A – Token replacement plug-ins 35
Appendix A – Token replacement plug-ins
This appendix describes the plug-ins used for token replacement in more detail. A template for a token replacement plug-in is available as starting point for a new token replacement plug-in.
The plug-ins are implemented as a dll. A naming convention has been defined in order indicate a token replacement dll. Each dll which is used a plug-in for token replacement must have a name like
‘TokenPluginXXX.dll’. XXX can be replaced with a more descriptive expression. The dll used for the common tokens is called TokenPluginCommon.dll.
During startup of the Target Connector, all plug-ins available in the binary directory of the toolchain are loaded and stored. For each plug-in a list of supported tokens by this plug-in is retrieved. One plug-in can support one or more tokens.
When code modification is started, the assignment of plug-ins to tokens is done. The code
modification can only start if all tokens have have a plug-in assigned. There are 2 options to perform the find and replace:
1. Search file by file. 2. Search token by token.
If the search is performed token by token, the files are opened and closed more often than a search file by file. Therefore, option 1 (see also Figure 31) leads to the most efficient way of find and replace regarding file I/O. Each plug-in is implemented as a dll. Therefore each plug-in is loaded once (during startup of the Target Connector) unloaded when the Target Connector exits. It is very inefficient to load a plug-in each time it is called by the Target Connector. A plug-in is called each time a token has been found.
Figure 31 Replacement strategy
The dll must export 4 functions:
• InitPlugin(Utils*,TXPFileParser*,ConfigFileParser*,ModelInfoPar ser*).
This function is called in order to set the links with objects created by the calling application. • GetTokens(vector<string>*).
This function ‘returns’ a pointer to the vector with supported tokens. Returning the vector via a pointer is done because it is complex to return values other than integers via a dynamically linked dll.
• StartModify(tokenID, *tokenList, *replacementText).
This is the function which is called to start the composition of the text for replacement. The return value of this function is the replacementText which is passed via a pointer.
• CleanUp().
Function which is called to clean up memory when everything is done.
A detailed description of the functions described above can be found in the doxygen documentation.
The InitPlugin() function must be called in the application before token replacement is started. Take care of the fact that all objects which are passed with this function call are created before calling InitPlugin(). For most cases the InitPlugin() function is already finished. If it is necessary to perform additional initialization, this can be implemented here. If there is a need to clean up data, this can be done in the CleanUp() function.
The dll contains a vector with token objects. Each token object has a name and an ID. This vector is filled with token-object when the GetTokens() function is called. If the user wants to add a token to this dll, the token must be added in this function. In the GetTokens() function the tokens which are supported by this plug-in are defined. A vector which consists of t_token objects is used for this purpose. The constructor for a t_token object needs a name and an ID. The programmer is responsible to assign anh unique ID to the constructor. The GetTokens() function might look like this:
The plug-in with this GetTokens() function supports 7 tokens. The ID’s assigned to each token are necessary in the StartModify() function.
The StartModify() function is mainly a switch-statement. The ID of the token is passed to the void GetTokens(std::vector<std::string>* tokens)
{
…
//add the supported tokens to the tokenslist
supportedTokens.push_back(new t_token("%TC_CLOSE%", 0));
supportedTokens.push_back(new t_token("%TC_READ_FUNCTION%", 1)); supportedTokens.push_back(new t_token("%TC_WRITE_FUNCTION%", 2));
supportedTokens.push_back(new t_token("%TC_GLOBALS%", 3)); supportedTokens.push_back(new t_token("%TC_INIT%", 4)); supportedTokens.push_back(new t_token("%TC_INCLUDES%", 5)); supportedTokens.push_back(new t_token("%TC_TEST%", 6));
Appendix A – Token replacement plug-ins 37
does have a name and a targetindex (indicating the tcf). The developer of a token replacement plug-in is totally free with the implementation of the switch-statement in the StartModify() function. Because only integer return values are supported with this type of dll’s, the calling application has reserved memory for the replacement text.
Compiling the token replacement plug-in
The token replacement plug-in can be compiled and linked using CMAKE. In the template directory a file called ‘CMakeLists.txt’ is included. The string ‘TokenPlugin<name>’ must be replaced with the correct name for this plug-in. The plug-in for common tokens is called TokenPluginCommon.
The file(s) to compile are indicated in the line which starts with
Appendix B – Howto add panels to the GUI
Introduction
In the ForSee program, it is possible to assign a page of the notebook to a certain tool. The GUI for a tool can be created in dialogblocks. The following options can be used to create the GUI:
1. Draw GUI directly in the notebook of the mainframe.
2. Draw GUI in same dialogblocks project a mainframe but create separate top-level panel. In this way the generated xrc-code is included in the ‘main’ zip-file used for the GUI.
3. Draw GUI in separate dialogblocks project. In this way a new (zip-)file is created with XRC-code.
The second option is suggested. In this way everything can be kept together. If you wish to use the generated code by dialogblocks to create a stand-alone application, this is no problem. Dialogblocks has the ability to set the code generation settings per element.
It is recommended to use the C++ code generation ability of dialogblocks for. The code generated by dialogblocks consists of a class. This class contains the pointers to widgets in the GUI, some general functionality and the functions which are called in case of an event (e.g. user clicks a button). To ensure the separation between functional- and GUI-code another class will be created. In this class you can program anything necessary for the functionality. E.g. an event-handler that will call functions from this class to perform the real functionality according to a certain event.
To keep things clear the following naming convention must be used:
The generated class by dialogblocks must have a name like dlgXX, The custom class must have a name like XX. In this way it is always clear which class is for the dialog and which is the custom one containing the functional implementation. Here ‘myexample’ will be used to clarify the process.
GUI class dlgmyexample.cpp, dlgmyexample.h Functional class myexample.cpp, myexample.h
To add a new panel the following files must be added/changed: dlgmyexample.cpp
Draw the GUI with dialogblock and generate the code.
The generated class has 2 constructors by default.
dlgMyExample( );
dlgMyExample ( wxWindow* parent, wxWindowID id, const wxPoint& pos, const wxSize& size, long style );
Appendix B – Howto add panels to the GUI 39
argument functionalParent must be added and this argument is stored in the (private) member functionalParent.
dlgmyexample.h:
dlgMyExample ( wxWindow* _functionalParent, wxWindow* parent, wxWindowID id = SYMBOL_DLGMYEXAMPLE_IDNAME, const wxPoint& pos =
SYMBOL_DLGMYEXAMPLE_POSITION, const wxSize& size = SYMBOL_DLGMYEXAMPLE_POSITION_SIZE, long style = SYMBOL_DLGMYEXAMPLE_POSITION_STYLE );
Create(parent, id, pos, size, style); }
The custom class: MyExample
This class must be derived from the wxWindow class.
The custom class must contain at least 2 functions: - Constructor.
class MyExample : public wxWindow {
public:
/**
* Constructor. *
* Creates link to relations object. * @param r pointer to relations object. */
MyExample(Relations* r);
/**
* StartBehaviour. *
* Sets links to necessary objects. */
void StartBehaviour();
dlg MyExample * dlgmyExample;
Utils* utils;
private:
Relations* relations;
WxSupport* wxSupport;
MainFrame* mainFrame;
Application* application;
};
#endif /* MYEXAMPLE_H_*/
myexample.cpp:
MyExample::MyExample(Relations* r) {
//store the address of the relations object in the private variable
relations = r;
}
MyExample::~MyExample() {
OutputDebugString("MYEXAMPLE ~MyExample()"); }
void DeploymentManager::StartBehaviour(void) {
OutputDebugString("MYEXAMPLE StartBehaviour()");
mainFrame = relations->mainFrame;
wxSupport = relations->wxSupport;
application = relations->application;
utils = relations->utils;
dlgmyExample = mainFrame->dlgmyExample;
Appendix B – Howto add panels to the GUI 41
Integration in the main program
Add class MyExample on top of the file. Otherwise an error will occur “struct xx is not declared”. Add member of type class MyExample to the class.
relations.h:
class MyExample;
MyExample* myExample;
Include header file of the new custom class. Add constructor for the new custom class.
Call StartBehaviour() after the StartBehaviour() of the mainframe. In the StartBehaviour() of the mainframe, the panel is ‘created’ and therefore must be called first.
relations.cpp:
#include "myexample.h"
Relations::Relations(Application* a) {
Add class dlgMyExample on top of the file. Otherwise an error will occur “struct xx is not declared”. Add public member of type class dlgMyExample.
Add private member of type class MyExample.
mainframe.h:
class dlgMyExample;
public: ...
dlgMyExample* dlgmyExample;
...
private: ...
MyExample* myExample;
...
Include header file of the new custom class. Include header file of the generated class.
In the StartBehavour() function, store pointer of new class from relations object.
Create new instance of dialog class generated by dialogblocks and add this to the notebook.
myExample = relations->myExample; ...
dlgmyExample = new dlgMyExample(myExample, noteBook);
noteBook->AddPage((wxScrolledWindow*)dlgmyExample, "myEaxample");
... }
Do not forget to add the new sources to the Cmakelists.txt
Example Usage
void dlgMyExample::OnButtonClick( wxCommandEvent& event ) {
Appendix C – Log plug-ins 43
Appendix C – Log plug-ins
This appendix describes the plug-ins used for data logging and monitoring in more detail. A template for a input log plug-in and output log plug-in is available as starting point for a new log plug-in. These templates support a GUI with wxWidgets. How to create a GUI for a log plug-in is explained in Appendix D.
Naming convention
The plug-ins are implemented as a dll. A naming convention has been defined in order indicate a dll used for data logging and monitoring. Each dll which is used as an input log plug-in must have a name like ‘InputLogPluginXXX.dll’. Each dll which is used as an output log plug-in must have a name like ‘OutputLogPluginXXX.dll’. XXX can be replaced with a descriptive expression of the output or input.
Return values
If an export function in the dll should return a value, this must be done using pointers. The calling application must reserve memory for the return value. The location of this reserved memory is passed with the calling function as a pointer. The log plugin is loaded dynamically. In other words, this dll is loaded and linked at run-time.
Multiple instances
Because a dll can only loaded once, objects are used in order to instantiate multiple instances of a dll. The dll must be able to contain a dialog. Therefore it is necessary to have a class in the dll which is derived from wxWidgets. Because the C interface is exported with the dll’s a kind of private class is necessary which is derived from wxWidgets. The C interface is not capable of exporting classes. For this reason each log plug-in does have a private class. This private class does contain all member functions which are internally used by the dll.
General classes have been defined which enable the multiple instances of a dll. This general class does contain flags about the status of the plug-in and a buffer where retrieved data is stored. Different objects are created from this class and represent the different instances of a dll. Depending on the plug-in, private or local data can be necessary. But because the structure of these data is not known beforehand (cannot be declared in the general class), each log plug-in declares a class PrivateData. During initialization of the log plug-in this object is created and stored in the general object.
An overview of the structure of a log plug-in is shown in Figure 32.
Data storage
-variableID
Figure 32 Structure log plug-in
Interface
The interface of the log plug-ins for input and output are almost the same. The ‘basic’ interface is summarized below:
- Initialize(LogPlugin*, Utils*, TXPFileParser*, Logger*). - Terminate(LogPlugin*).
- ShowDialog(LogPlugin*). - Connect(LogPlugin*). - Disconnect(LogPlugin*).
Some specific additions for the input log plug-in:
- Read(InputLogPlugin*, mode, &modelName, logTime, &modelElementIDs).
- GetModelInfo(InputLogPlugin*, TiXmlNode*).
Some specific additions for the output log plug-in:
- WriteDataBlock(OutputLogPlugin, DataBlock*, &modelElementIDs). - WriteDataBuffer(OutputLogPlugin, &databuffer, &modelElementIDs).
Appendix C – Log plug-ins 45
To indicate if the read function is intended for data logging or monitoring the mode argument is used. In case of data logging the logTime argument indicates the time to log, this argument makes no sense with monitoring. The ID’s of the variables to log or monitor are included in a vector
modelElementIDs. Which model should be logged is indicated with the modelname argument. It is obliged to assign unique names to each model. The log plug-in can optional translate this name of the model in an identifier for internal use.
The WriteDataBlock() function is used to write a datablock (a datablock contains all values for the variables for a certain timestamp) to an output, this is used with monitoring. When data logging, the WriteDataBuffer() function must be used to write the complete buffer.
Compiling the log plug-in
The token replacement plug-in can be compiled and linked using CMAKE. In the template directory a file called ‘CMakeLists.txt’ is included. The string ‘InputLogPlugin<name>’ or
‘OutputLogPlugin<name>’ must be replaced with the correct name for this plug-in.
The file(s) to compile are indicated in the line which starts with
‘ADD_LIBRARY(OutputLogPlugin<name> SHARED <filename>.cpp’. The names of the files which must be compiled can be included after SHARED.
Appendix D–Using DialogBlocks for pluginGUI
Step1
Start DialogBlocks. In the dialog that appears, click ‘Create new project’.
Step2
Appendix D–Using DialogBlocks for pluginGUI 47
Step3
Select ‘Generate C++ for XRC’. Enter the name for the xrc filename. Be carefull that you enter .xrc after the filename otherwise a file without extension will be created.
Step4
Step5
Click ‘Next’.
Step6
Appendix D–Using DialogBlocks for pluginGUI 49
Step7
Select ‘Element->Add Dialog’.
Step8
Step9
Select ‘Build->Configurations...’
Step10
Appendix E – Information in the toolchain 51
Appendix E – Information in the toolchain
The ForSee toolchain does need different types of information in order to perform the tasks. One can define 4 types of information:
- Information about the model (modelinfo.mcf). The Target Connector must know which ports a model has to connect with pins on the target. For data logging and monitoring the variables of the model to log or monitor must be selected.
- Information about the target (<target>.tcf). The Target Connector must know which pins the target provides to connect with. The compiler must know things about the target in order to perform compilation. For data logging and monitoring it must be known which target is used in order to perform this functionality.
- Information about previous usage (<model>.txp). Settings which are done in a previous use, must be stored and available if the toolchain is used a second time in the same setting.
- Information about the ‘real’ model. This information is available in the generated code framework by the modeling tool.
Figure 33 shows an overview of the different information in the ForSee toolchain. The modelinfo.mcf is a generic format to describe the ports and variables of a model. This information comes from the modeling tool. In order to put this information into this file a parser is necessary.
modelinfo.mcf
<target>.tcf <model>.txp ForSee
toolchain
20-sim modeling tool X
parser
modelinfo.xxsim xx.xx
parser
generated code framework generated
code framework
tool specific
Appendix F – target experiment (TXP) file
This appendix describes the target experiment file (txp) in more detail.
model
Figure 34 Structure of target experiment file
As can be seen from Figure 34, the txp can contain information about multiple models. Each model consists of 4 parts; connections, logplugins, tcfs and command settings. The explanation of the connections and targetconfigfile parts can be found (Posthumus, 2006).
‘logplugins’ section
Each added log plug-in has an id assigned. The settings are stored for each plug-in. The structure for the settings is shown below:
<SETTING>
Appendix F – target experiment (TXP) file 53
The input log plug-in has a targetindex field. This index is used to retrieve the name of the plug-in from the correct target configuration file(tcf). A name field is added for the output log plug-in, this name is used to load the output log plug-in. The remainder of the structure is identical for input and output.
‘command settings’ section
The command settings section stores the information which is necessary for the connection to the target. The structure is shown below:
When a target is used on which an operating system is running, each application has an own id. This id is called a process id (PID). In order to communicate with the application, this PID is necessary. To communicate with the target itself, communication settings must be known like IP-address or COM-port. These settings are stored in the communication field.
Appendix G – Additional recommendations
This appendix describes some additional recommendations. These recommendations are strongly related to the implementation and therefore not included in the chapter 6.
Files which are used within the ForSee toolchain are in XML-format. TinyXML (TinyXML, 2007) is used as a library to parse these files. The custom-made XMLparser contains functions based on tinyXML to retrieve data from the XML-file according to the defined file structure. Each time this structure slightly changes, the XMLparser has to be updated manually. Document type definition (DTD)(W3C, 2007) can be used to define the structure of an XML-file. With a DTD a XML-file can be checked against the DTD. Nowadays there are libraries available (DTD2CPP, 2007) which can generate functions according to the DTD.
It is conceivable that the panel which contains the GUI has dimensions which are bigger than the space reserved within the notebook. If no action is taken by the programmer, the parts of the panel which cannot be placed just disappear. In order to prevent this behaviour, a control called
Literature 55
Literature
ten Berge, M.H. (2005), Design Space Exploration for Fieldbus-based Distributed Control Systems, MSc Report, no 029CE2005, Control Engineering, University of Twente, Enschede.
Broenink, J.F. and G.H. Hilderink (2001), A structured approach to embedded control systems implementation, in: 2001 IEEE International Conference on Control Applications, M. W. Spong, D. Repperger and J. M. I. Zannatha (Eds.), IEEE, México City, México, pp. 761-766, ISBN: 0-7803-6735-9.
Buit, E. (2005), PC104 stack mechatronic control platform, MSc.-Report, no 009CE2005, Control Laboratory, University of Twente, Enschede.
CLP (2005), Controllab Products B.V., http://www.20sim.com.
Cosateq (2006), Cosateq website, http://www.cosateq.com.
Dirne, H. (2005), Demonstrator of advanced controllers, MSc Thesis, no 013CE2005, Control Engineering, University of Twente, Enschede.
DTD2CPP (2007), DTD2CPP website, http://dtd2cpp.sourceforge.net.
Microsoft (2007), MSDN website, http://msdn.microsoft.com.
OPC (2007), OPC foundation, www.opcfoundation.org.
Otto, M. (2005), Mechatronic setup for Boderc Project, MSc Report, no 038CE2005, Control Engineering, University of Twente.
Posthumus, R. (2006), Target Connector, A redesign of the hardware connector, Pre-Doc report, no 028CE2006, Control Engineering, University of Twente, Enschede.
Serughetti, M. (2007), OPC from Factory Floor Embedded Controllers to Enterprise System-Level Applications, http://www.windriver.com.
TinyXML (2007), TinyXML website, http://www.grinlinglizard.com/tinyxml.
Visser, P.M., M.A. Groothuis and J.F. Broenink (2007), Multi-purpose toolchain for embedded control system code on a variety of targets, Proc.