Weather Forecasting using R
Pritam Sah, Prof. Jayant Adhikari, Prof. Rajesh BabuTulsiramji Gaikwad Patil College of Engineering and Technology, Wardha Road, Nagpur, Maharashtra, India
ABSTRACT
In this project, we are using the public data and mining the useful pattern so as to get the appropriate results at the end. R programming is a language for statistical computing and can be used to graphically display the output. Using R programming following statistical works can be done such as linear and nonlinear modelling, clustering, graphical representation of data techniques, classification.. One of the advantage of R's is the way in which well graphically designed graphs on-quality plots can be produced, mathematical symbols and formulae. In this project, we are using 3 algorithms i.e Logistic Regression, Decision Tree, Random Forest to forecast whether Rainfall may occur or not. By using 3 algorithms we are trying to increase the accuracy of weather forecasting.
Keywords : R programming, Logistic Regression, Decision Tree, Random Forest, weather forecasting.
I.
INTRODUCTIONData analysis is the first process which is to be done. Data analysis means cleaning the data, transforming it into the useful data, modeling and extracting the useful data from the dataset.
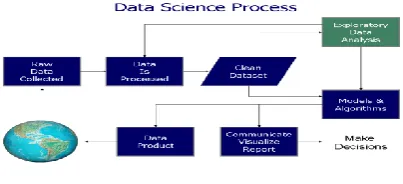
Fig 1. Phases of Data Science Process
In the first phase of data science process raw data is collected that can be public data which can be used to collect relevant data that has to be analyzed. In second phase i.e. Data Processing and Cleaning, the blank values present in the dataset or missing values is to be removed and data is further cleaned. In next stage i.e. Exploratory data analysis, the refined code
Dindrud police, Thavre in which it was written that the farmers which owns an farm land at Anandgaon, Beed district has completed sowing the seeds on farm land in June by believing on IMD forecast . The IMD is the weather forecasting agency that had predicted heavy rainfall will occur during June and July, but unfortunately no heavy rainfall occured in the month of June and July. This false prediction result in the loss of crop, money etc.. A Packages which we are using in our project are : knitr, caret, gmodels, lattice, ggplot2, ROCR, corplot. Knitr package provides a general purpose tool for dynamic report generation in R using Literate Programming technique. Caret (Classification and regression training) package contains functions that streamlines the process for creating models used for prediction. It contains the features for splitting the dataset, processing the dataset, pattern matching feature, re-sampling, variable importance detection. Gmodels package contains various R programming tools for model fitting. Lattice package is a powerful and elegant high level data visualization system. Ggplot2 package is a system for declaratively creating graphics. ROCR contains graphs, sensitivity, specificity curves, lift charts, and precision/recall plots. Corrplot package contains graphical display of a correlation matrix, confidence interval and some algorithm to do matrix reordering. In this project we will use the public data to analyze weather forecasting. So, basically we are which response variable i.e. dependent variable has a categorical values such as True/False or 0/1. Logistic Regression calculates the probability of binary responses which can be used as response variable
based on the mathematical equation relating with the predictor variables. Mathematical equation for logistic regression is “y=1/(1+e^-(a+b1*1+ b2 *2+b3*3+b4*
Fig 3. Implementation of Decision Tree
Random Forest
In random forest, large number of decision trees are generated and every observation is fed into each decision tree. The common outcome of each observation will be used as the final output. In each iteration, a new observation is fed into all the trees and then taking a majority vote for every classification model. Error estimate is created for every case which were not used while building the tree. This is known as OOB (Out-of-bag) error estimate which is illustrated in the form of percentage. The function used to implement Random Forest is randomForest(). Syntax for randomForest() is : randomForest(formula,data) as shown in fig 4, where formula is a formula describing the predictor and responsive varibales and data is the name of the data set which is being used.
Fig 4. Implementation of Random Forest
II.
MethodologyIn public data our dependent variable is “RainTomorrow” which tells whether rain will come
in coming day or not. Firstly, we will install all the packages required to implement code like knitr, caret, gmodels, etc. To use the installed library we need to write “library(library name)”. Then we will take our public data which is in csv format into one variable. Syntax for reading csv file is “weather_data <- read.csv("weather.csv", header = TRUE, sep = ",", stringsAsFactors = TRUE)”. We can get the summary of the dataset as shown in Fig 5 below:
Fig 5. Summary of the dataset
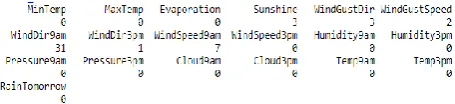
We need to clean our dataset i.e. removing NULL values, removing unwanted field. To remove unwanted fields we can use “-c” for eg. “weather_data2<-subset(weather_data,select = -c(Date, Location, RISK_MM, Rainfall, RainToday))”. To check the NULL values there is a function as “is.na()” which will return the NULL values in every field present in the dataset as shown in Fig 6.
Fig 6. Finding NA‟s values
differences ofn parent node and sub nodes. Formula for chi-sqaure is (Actual-Expected)^2/Expected)^1/2. Chi-sqaure develops CHAID (Chi-Sqaure Automatic Interaction Detector).
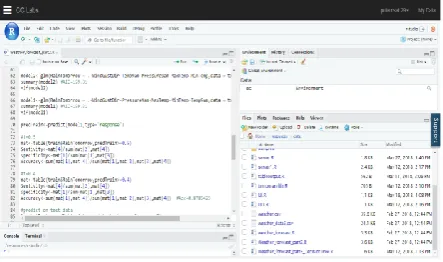
After applying Chi-Square test, we will split the data into 70% train data and 30% test data. Now we will create a Logistic Regression model using glm() function as “model1<-glm(RainTomorrow ~ .- WindGustDir-Pressure9am-MaxTemp-MinTemp-Temp9am,data = train,family = "binomial")” which will give AIC i.e. Akaike information criterion value which should be more so as to have more accuracy. To find out the accuracy i.e. True to True value and False to False value we create a matrix as “mat<- table(train$RainTomorrow,predTrain>=0.5)” from which we can get a accuracy value as “Accuracy<-sum(mat[1],mat[4])/sum(mat[1],mat[2],mat[3],mat[4] )” as shown in figure 7 below:
Fig 7. Output of Accuracy variable after applying table()
We will find for the highest accuracy as possible. Now we will apply Decision Tree algorithm to our train data. In this we will also split the data into 70% train data and 30% test data using split() as shown in Fig 8.
Fig 8. Splitting of data in train and test data
For implementation of Decision Tree algorithm we can use rpart() as “model1<-rpart(RainTomorrow ~ .,data=train,method="class",minbucket=5,cp=0.12)”.
As done in Logistic Regression we can also get a accuracy of the model as shown in Fig. 7. The last algorithm which we are going to implement is Random Forest which is more efficient algorithm than Logistic Regression and Decision Tree. For implementing Random Forest algorithm we need to
use “randomForest()” as
“model1<-randomForest(RainTomorrow~.,data=train,ntree=500 )” and the same procedure will be followed to check the accuracy of the algorithm as shown in Fig 7.
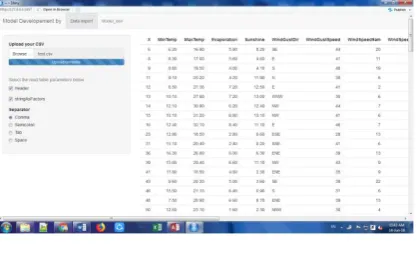
In final implementation as shown in Fig 9 and Fig 10, we need to upload the csv file and then that file is used as input to model in the next screen and we need to select the dependent and independent variable to get the accuracy and the matrix value. In matrix value we get the False to False value and True to True value to check how accurate True to True or False to False is given by the model.
Fig 9. Final Implementation
III.
CONCLUSIONThus, we have cleaned, find useful pattern and data fields from the public dataset. 3 algorithms have been applied on the public dataset and also the accuracy is being increased by using more efficient algorithm such as Random Forest. Accuracy of each and every algorithm is calculated. The output is efficient as we have applied 3 algorithms and compared there results. In future, more efficient algorithm can be used to predict the accurate weather forecasting. This project can be useful for the farmer so that they should not face any type of losses due to incorrect weather prediction in future.
IV.
REFERENCES[1].Sanjay Chakraborty, N.K.Nagwani, Lopamudra Dey “Weather Forecasting using Incremental K-Means clustering”, in CiiT International Journal of Data Mining & Knowledge Engineering, May 2012
[2].S.Chakraborty and N.K.Nagwani ,“Performance evaluation of incremental K-means clustering algorithm ”, in IFRSA International Journal of Data Warehousing & Mining (IIJDWM), vol.1, 2011,pp-54-59