Dynamic System Model Development for Strategic Planning
Information Technology in the Framework of Developing Smart
People and Smart Economy (Case Study in Surabaya)
Didiet Anindita Arnandy, Erma Suryani, S.T., M.T., Ph.D.
Information System, Insitute of Technology Sepuluh Nopember, Surabaya, Indonesia
ABSTRACT
Use and application of technology in a smart city requires careful planning so that the investment costs incurred can be in line with the benefits expected. For that, we need a model to make it easier in analyzing technology strategic planning. In the model can also be used a variety of different scenarios, so it is expected to make it easier for policymakers to see the possibilities that may occur to determine the decision more precisely. In this research, we will create a dynamic system simulation model to see whether the current information system strategic planning is feasible to face the challenges and problems that will be facing in the future. The model is used to see the effect of Key Performance Indicators (KPI) on Surabaya Smart People and Smart Economy by the development goal of Surabaya city. The output of this research is a dynamic simulation model that is expected to help to provide recommendations to policymakers in determining the appropriate strategic planning for urban information technology development, so it is expected that the investment issued following the intended purpose.
Keywords : Smart Economy, Smart People, Dynamic Simulation
I.
INTRODUCTIONThe economic growth rate of Surabaya city that continues to increase and is above the economic growth of East Java and national become the attraction for other city residents to come and try their fate.
With the denser population will undoubtedly cause new problems that must be faced by Surabaya city government. Issues such as the increasing availability of residential areas and green areas for urban communities, increased use of private and public transport vehicles that will impact traffic congestion and a large number of pollution and accumulation of waste from personal or industrial disposal that also impacts on clean water supply.
It takes hard work and coordination between agencies to solve the above problems. Not only the government should bear the burden of responsibility but also a shared responsibility between the community, experts, and policymakers that are expected to improve the quality of life of Surabaya city residents.
For that city of Surabaya trying to develop an intelligent city concept or better known as Smart City, which is a city that has six characteristics, namely: Smart Economy, Smart People, Smart Governance, Smart Mobility, Smart Environment and Smart Living.
Smart City's basic concepts include Instrumented, Interconnected and Intelligent. Instrumented refers to near-real-time and real-world data sources from both physical and virtual sensors. Interconnected means integrating all data and communications across a range of city services. Intelligent can perform sophisticated analysis, modeling, optimization, and visualization of operational business processes to help make better decisions [2].
It has become a demand for the city of Surabaya to be able to compete with other cities by improving the quality of service and providing information for all citizens of Surabaya. Therefore, the government needs to plan, invest and hold technology that supports all these activities.
The Surabaya city government has determined several performance indicators for each target as a means of measuring whether the objectives have been determined to be well achieved. Performance measurement results are reported periodically every year in the form of a Surabaya City Government Performance Report.
In this research, we will create a dynamic system simulation model to see the match between Key Performance Indicators (KPI) representing the characteristics of Smart People and Smart Economy following the development goals of Surabaya city in the future. The model developed uses references from Causal Loop Diagrams developed by DK. Das (2013) integrating various information owned through the utilization of information and communication
technology. The goal to be achieved is to improve the quality of life by improving the quality of service to the needs of the community more effectively and efficiently.
The concept of Smart City is different for each city, depending on the resources it has, the willingness to change and develop and the sense of care and active involvement of the citizens themselves..
Smart City is a city that employs six characteristics (Smart Economy, Smart People, Smart Governance, Smart Environment, Smart Living, Smart Mobility) to achieve its objectives well, based on an intelligent combination of funding manageability, the ability to be independent and the concern of the citizens of the city [3].
B. Smart Economy
One of the concepts in smart city relating to how attractive and competitive a region relates to factors such as the stimulation to create innovation, entrepreneurship, productivity and international appeal..
C. Smart People
How a city provides adequate educational facilities so that it can create professional and creative human resources and support an environmentally friendly lifestyle.
D. Key Performance Indicators
III.
SIMULATION DESIGNA.
Causal Loop Diagram (CLD)From the reference modeling of existing smart city then created the concept of Causal Loop Diagram for information technology development planning in the framework of Smart Economy and Smart People development in Surabaya municipality government.
Figure 1. CLD of Surabaya Smart City
Figure 2. CLD of Surabaya Smart Economy
Figure 3. CLD of Surabaya Smart People
B.
Stock and Flow DiagramSurabaya Smart People model to find out how big the level of community participation and the readiness of Surabaya to the smart city by looking at the indicators that have been set previously. In Surabaya Smart People model several other submodels influence each other, the sub model consists of:
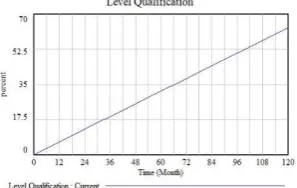
Level Qualification
Participation in Public Life
Cosmopolitan Open-Mindedness
Perception Model Getting New Job
Creativity
Surabaya Smart Economy model to measure how far the readiness of Surabaya city to the smart city by looking at some of the indicators that already exist. Surabaya Smart Economy model consists of several submodels as follows:
International Embeddedness
Entrepreneurship
Innovative Spirit
Figure 4. Level Qualification Submodel
Figure 6. Creativity Submodel
Figure 7. Mathematical Model of Creativity Submodel
Figure 8. International Embeddedness Submodel
IV.
SIMULATION SCENARIOSFurthermore from the model that has been built made a scenario model and analyzed to see how far the impact of the parameters that affect the model. Scenario results are only retrieved data in the last month or month to 120.
Table 1. Scenario for Flexibility Market Skenario Current Skenario Unit Life Skill 561 610 People/month Law Labor 91,25 91,25 % Industry
Programme 36 53 Programme School
Programme 142 142 Programme
New Job 898 1299 Jobs
Table 2. Scenario for Enterpreneurship Skenario Current Skenario Unit Transparansi
Public Services 82,67 87,05 % UMKM
Empowerment 8656 28656 people
Table 3. Scenario for Enterpreneur, Innovative and Econonomy
Model Current Skenario Unit Enterpreneurship 57 68,95 % Innovative Spirit 36,7 40,67 % Smart Economy 22,23 24,83 %
From several scenarios, Smart People and Smart Economy on the road obtained the following results :
Figure 9. Qualification Level Scenario Results
Figure 10. Smart People Scenario Results
Figure 12. Smar Economy Scenario Results
V.
CONCLUSIONFrom the model in this simulation, some variables can help to increase the level of Smart People and Smart Economy in Surabaya city, such as college certification, Life skill program, scholarship, public service transparency and Enterpreneur Empowerment in the city government of Surabaya.
VI.
REFERENCES
[1].Alshuwaikhat, H. M., & Abubakar, I.(2008). An Integrated Approach To Achieving Campus Sustainability : Assessment Of The Current Campus Environmental Management Practices. Journal of Cleaner Production.
[2].Sterman, J. D. (2001). System Dynamics Modeling : Tools For Learning In A Complex World. California Management Review Vol. 43 No. 4. [3].Energi, D. K. (n.d.). Konservasi Energi. Retrieved
from EBTKE Direktorat Jenderal Energi Baru Terbarukan dan Konservasi Energi:http://lintas.ebtke.esdm.go.id/konservasi-energi/id/masyarakat-umum/view/4/31-deskripsi [4].Chun, S., Okita, Y., & Tachibana, S. (2009).
Energy Conservation System For Distribution Outlets. OKI Technical Review.