The effects of a conditioning stimulus
provided as Cold Pressor Test on the
Conditioned Pain Modulation of healthy
persons based on the subjective experience of
pain
Technical Medicine MDO Group 5
Maartje Dekker - s1477129
Job de Haan - s1469037
Athra Malki - s1764586
Ilse Willemse - s1479415
Medisch begeleider: drs. I.P. Krabbenbos Technisch begeleider: dr. ir. J.R. Buitenweg
Tutor: L. Hagens
CONTENTS CONTENTS
Contents
1 Introduction 4
2 Relevant scientific knowledge 6
2.1 Anatomy . . . 6
2.2 Physiology . . . 6
2.3 Sensitization . . . 11
2.4 Technology . . . 12
2.5 Subjectivity of pain . . . 14
3 Previous research 15 3.1 Relevant studies with CPT . . . 15
3.2 Gender, age and ethnicity . . . 16
3.3 Different stimuli and its effects . . . 18
3.4 Psychological effects on the CPM . . . 19
3.5 Duration of CPM . . . 19
3.6 Possible effects of chronic pain on CPM . . . 19
4 Method 21 4.1 WMO study . . . 21
4.2 Participants . . . 21
4.3 Procedure . . . 21
4.4 Randomisation and blinding . . . 22
4.5 Datacollection and -processing . . . 22
4.6 Statistics . . . 23
5 Results 24 5.1 Conditions . . . 24
5.2 Time . . . 27
5.3 Reproducibility . . . 29
6 Discussion 30 7 Conclusion 33 A Appendix 38 A.1 Inclusion- and exclusion criteria . . . 38
A.2 Protocol . . . 39
A.3 Form ’meetdata Ice study’ . . . 40
A.4 Collected data . . . 42
A.5 Charts of collected data . . . 46
1 INTRODUCTION
function of pain. A long lasting inhibition of pain signals is not favourable since this interferes with the warning function this pain fulfils.
In order to find out whether the CPM effect is quantitatively reproducible a re-test will be done several days after the first test. Small physiological changes caused by the first test will not influence the second one, because of the several days in between. The psychological influence this may have is hard to estimate. Furthermore, one can perceive pain more severe when he knows exactly what to expect. This might, during re-test, result in a measured CPM effect that is lower than reality. Realising this possibility enables the researchers to prevent its influence during the study so measured differences will tell something about the integrity of the CPM effect regarding its reproducibility.
2.2 Physiology 2 RELEVANT SCIENTIFIC KNOWLEDGE
Pain sensation consists of a noxious stimulus (discriminative component), an emotional and an au-tonomous response on it and an increased attention (arousal-emotional component). The spinothalamic tract can be divided into the direct pathway and the indirect pathway. The direct pathway is also called the neospinothalamic tract en consists of the discriminative component. The arousal-emotional compo-nent proceeds via the indirect pathway, which consist of the paleospinothalamic, spinoreticular and the spinomesencephalic tract.[10]
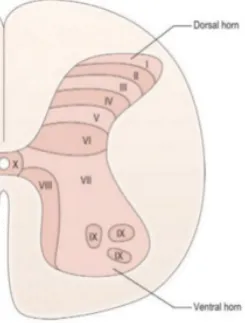
The different components of the spinothalamic tract have the same course till the spinal cord. As men-tioned before, the first-order sensory neuron gets into the spinal cord dorsally via the posterior nerve root. The first-order neurons reaches the gray matter of the vertebra through the Lissauers tract. The gray matter is divided into the ventral and the dorsal horn. From here there is a more specific divison of gray matter into different laminae. These laminae are classified based on their cytoarchitecture and function.[14] Figure 1 shows the vertebral laminae.
In the dorsal horn the switch from first-order neuron to second-order neuron takes place. In which lamina this happens, differs per component of the spinothalamic tract. Subsequently, the bulk of these second-order neurons cross via the ventral white commissure towards the contralateral side. In the dorsal horn different neurotransmitters transmit a signal. In case of a mild stimulus, glutamate is released, which engages with the postsynaptic AMPA1receptor, the metabotropic glutamate receptor (mGluR) and with the kainate ligand-gated ion channel. When the stimulus is stronger, tachykinins are released. This includes substance P, neurokinin A and neurokinin B. These tachykinins bind respectively with the NK-1, NK-2 and NK-3 receptor. This binding causes a more intense postsynaptic response. The response is extra amplified by the binding of glutamate with the NMDA (N-methyl-D-aspartate) receptor. There are also adrenoceptors which are located both in the PNS and the CNS. The adrenoceptors are divided into A1-and A2-receptors A1-and bind with adenosine, AMP, ADP A1-and ATP. Binding with the A1-receptor results in stimulation of the nociceptors. [15]
Figure 1: Vertebral Laminae.
Neospinothalamic tract
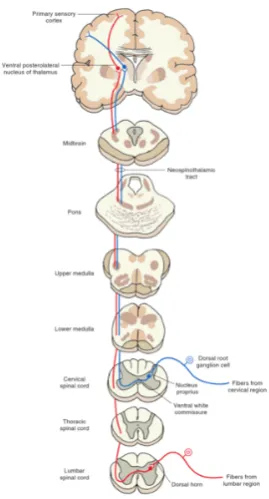
In this case, the transition to second-order neurons takes place in lamina III and IV. This transition is about two vertebrae higher than where the first-order neuron is reaching the spinal cord. The second-order neuron is travelling from the nucleus proprius to the white matter of the contralateral side. There is a somatotopic arrangement: second-order neurons from lumbar and sacral parts of the spinal cord ascend dorsolateral, while second-order neurons from cervical parts of the spinal cord ascend more ventromedial. The ascending neurons travel to the brain and in the brainstem it is called the spinal lemnicus[16]. The second-order neuron ends up in the ventral posterolateral nucleus of the thalamus and changes into third-order neurons. These are rising and end up in the primary sensory cortex in the postcentral gyrus. In
2.2 Physiology 2 RELEVANT SCIENTIFIC KNOWLEDGE
figure 2 the neospinothalamic tract is shown.[10]
Paleospinothalamic tract
For the paleospinothlamic tract, ther is in addition to the contralateral part of the ascending tract, also a part that stays at the ipsilateral side in the ventrolateral quadrant. The second-order neurons ascend to the intralaminar thalamic nuclei. On their way neurons synapse in the reticular formation. In the intralaminar thalamic nuclei second-order neurons merge into order neurons. After this, the third-order neurons are travelling to different cerebral corti, namely the limbic areas. In the left tract of figure 3 the paleospinothalamic tract is shown. However, the ipsilateral tract is not displayed.[10]
Spinoreticular tract
In this tract, the transition to order neurons takes place at the level of laminae V-VII. The second-order neurons ascend contralateral and ipsilateral of which a part terminates in the medullary reticular formation and the pontine reticular formation. The other part rises through to the intralaminar thalamic nuclei where the transition to third-order neurons is located. The third-order neurons project to the limbic areas and to the insula. The spinoreticular tract is shown in the middle part of figure 3. However, the ipsilateral tract is again not displayed.[10]
Spinomesencephalic tract
In this tract, second-order neurons travel from the anterior white commissure to the periaqueductal grey (PAG) and to the parabrachial nuclei. From the PAG neurons are stimulated that results in descending inhibition of pain, which will be discussed later on. Third-order neurons start in the the parabrachial nuclei and are ending in the amygdala. The spinomesencephalic tract is shown in the right part of figure 3.[10]
Figure 2: The neospinothalamic tract.
2.2 Physiology 2 RELEVANT SCIENTIFIC KNOWLEDGE
Descending pain inhibitory pathways
Inhibition of spinal nociceptive transmission takes place when the sensory cortex, ventrobasal thalamus, hypothalamus, mesencephalon, pons and medulla are activated by incoming pain signals. The PAG is a region in the mesencephalon which sends pain information to the rostral ventromedial medulla (RVM) and the dorsolateral pontine tegmentum (DLPT).[17] Depending on the class of neurons, inhibition or excitation will take place. Activation of glutamate or enkephalin neurons, which are derived from the PAG, result in activation of the descending pathways of the RVM. Activation of neurotensin-neurons derived from the PAG can both result in sending an inhibiting or facilitating signal to the descending RVM pathways. The nucleus raphe magnus (NRM) is a region of the RVM. Activated serotonergic-, cholecystokinergic, enkephalinergic and GABAergic pathways (which are activated by glutamate, enkephalin and neurotensin) from the NRM descend to the dorsal horn of the spinal cord in laminae I, II and V. Thus, descending pathways project on the same dorsal horn regions of the spinal cord as where periphery first-order afferent neurons synapse to second-order neurons. The following neurotransmitters are released by these pathways: serotonin, cholecystokinin, enkephalin and GABA. In exception of cholecystokinin, these neurotransmitters all have an inhibitory effect on the pain-information transport. Inhibition by enkephalin is induced through activation of opiate receptors such as mu (µ), delta (δ) and kappa (κ). µ-Receptors are mainly found at the supraspinal level and the δ- and κ-receptors at the spinal level. The release of substance P will be blocked when enkephalin binds toδ-receptors andκ-receptors, therefore second-order afferent neurons will not receive the pain information.[17] The RVM and DLPT are bound together by ascending enkephalin, substance P and GABA neurons. Unlike substance P and enkephalin neurons, which activate the DLPT, GABA neurons play a role in the inhibition of the DLPT.[18] Enkephalin activates the DLPT by inhibition of GABA neurons. Activated noradrenergic pathways descending from the locus coeruleus (LC), which is located in the DLPT, project to the dorsal horn of the spinal cord. The noradrenergic neurons release noradrenaline in the dorsal horn of the spinal cord. Noradrenaline blocks the transport of pain information to second-order afferent neurons by binding to presynapticα2-adrenoceptors.[18][17] Thus, activation of the DLPT and the RVM play a role in the inhibition of pain. The descending pathways and their corresponding neurotransmitters are shown in figure 4.
Figure 4: Descending pain pathways and the neurotransmitters that are involved[19].
Segmental pain inhibition
2.2 Physiology 2 RELEVANT SCIENTIFIC KNOWLEDGE
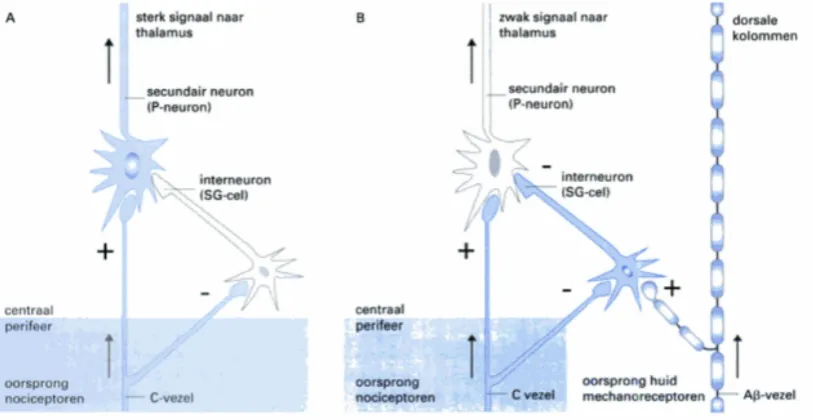
their collateral branches to interneurons. These interneurons are inhibited by collateral branches of the nociceptive neurons when pain is induced. This leads to activation of second-order afferent neurons. When mechanical neurons send, in comparison to nociceptive neurons, a stronger signal to interneurons, these neurons will be activated. The activated interneurons send an inhibitory signal to the second-order afferent neurons located in the spinal cord. The mechanism of the interneurons is referred to as a so called gate, since the transport of pain information depends on inhibition or facilitation of these interneurons. This is also the reason why the segmental pain inhibition mechanism is called the gate theory. According to the gate theory, excitation of interneurons leads to closing the gate, therefore pain will not be sensed. Inhibition of interneurons leads to opening the gate which means that pain will be induced.[20] The inhibition and excitation of pain on spinal cord level is shown in figure 5.
Figure 5: Control module for the ”gate control theory of pain”. A. Only the C-fibers are stimulated. B the Aβ-fibers are stimulated , and thereby also the SG-cells.[20]
Supraspinal pain inhibition
Multireceptive neurons in the dorsal horn and the trigeminal nuclei caudalis and oralis are found in both superficial and deeper layers of lamina V. They receive input from primary nociceptive neurons and non-nociceptive neurons. Multireceptive neurons are also called ”wide-dynamic range” (WDR), ”convergent”, ”lamina V type” or ”class 2” neurons. These interneurons are involved in sending information to ascending pathways and to polysynaptic reflexes. A conditioning noxious stimulation of various areas of the body (unrelated to the receptive fields of the multireceptive neurons) can inhibit the activity of multireceptive neurons. This causes activation of the descending inhibitory mechanisms, which decreases pain responses to a second stimulus. Inhibition of one stimulus by the perception of a second stimulus, is called pain-inhibits-pain counterirritation. The pain relieving effect of counterirritation is provided by the ”Diffuse Noxious Inhibitory Controls” (DNIC) mechanism. Only ”noxious” is used in the term ”DNIC” since it was originally thought that noxious stimuli could only inhibit second noxious stimuli. However, later studies suggested that non-noxious conditioning stimuli could also induce DNIC to some extent. Therefore the new term Conditioned Pain Modulation (CPM) was given. Thus according to those studies, multireceptive neurons are also activated by non-noxious stimuli.[21][22][23][24]
2.4 Technology 2 RELEVANT SCIENTIFIC KNOWLEDGE
The membrane excitability depends partly on an increase in intracellularCa2+. But more factors play a role than change in membrane potential and that is where central sensitization differs from wind up, a state of increased excitability that lasts only a couple of seconds. These factors are summarised in figure 6. There is no specific pathway or transmitter devoted, each of the related transmitters can separately or together initiate the activation of those multiple intracellular signaling pathways that lead to the initiation of hyperexcitability in dorsal horn neurons.[31]
Now rests to discuss how central sensitization relates to chronic pain. It knows three increasing stages, namely activation (activity dependent), modulation (reversible functional changes), and modification. When modification occurs the pain becomes chronic because chronic structural and architectural alterations occur.[35] Central sensitization is characterised by both phenomenons hyperalgesia and allodynia[33][32].
Figure 6: Cellular processes leading to central sensitization[31].
Hyperalgesia and Allodynia
The cause of chronic pain is not entirely known but it is commonly acknowledged that central sensitization and it characteristics play an important role[36][37]. Hyperalgesia is the increased sensitivity to pain. Therefore painful stimuli will be classified as more painful than they normally would. This should not be mistaken with allodynia, whereby things that should not hurt also become painful[31]. Hyperalgesia is often induced by the use of opiates. This is a process of habituation that causes patients to feel more and more pain or pain that spreads to other positions. This is a paradoxical effect that results in an ever increasing amount of medication.[38][39]
2.4
Technology
The NociTRACK
3.2 Gender, age and ethnicity 3 PREVIOUS RESEARCH
and that postoperative pain scores and hyperalgesia were increased by patients with chronic pain six months after surgery. CPT was used as validated conditioned stimulus. Six months after the surgery six out of the twenty people had developed chronic pain. Figure 10 shows that these people had a higher score on the VAS scale at rest and movement at one, three or six months after surgery compared to the group who did not have chronic pain six months after surgery. It also showed that an impaired CPM has a direct connection with the holding of postoperative pain.[7]
Figure 10: Postoperative time course of pain measured with VAS at rest and movement. D1 is day 5 after surgery. M1, M3 and M6 are respectively 1, 3 en 6 months after surgery[7].
The outcomes suggest that the progression to chronic pain involves the persistence of hyperalgesia as well as its spread to sites distant from the site of surgery. This seems particularly the case for skin hyperalgesia as tested by electric stimulation. But it may also apply to spreading deep tissue hyperalgesia as tested by pressure algometry during this study. This pilot study provides first evidence supporting links between the development of chronic pain after surgery, postoperative persistence and spread of hyperalgesia and poor preoperative inhibitory modulation of pain processing (CPM).The outcomes of this study suggest that preoperative testing of pain processing can be a useful clinical tool for the management and prevention of chronic pain after surgery.[7]
3.2
Gender, age and ethnicity
From a study of Tsao et al.(2013)[40] is shown that the gender of children does not affect the subjective experience of pain after a test stimuli but age does. Younger children (age 8 till 11) give by the same stimulus a higher pain rate compared to older children (age 12 till 17). From this it can be concluded that younger children have an lower CPM than older children. In these ages there are no differences regarding CPM when we look at the gender of the children.[40].
3.6 Possible effects of chronic pain on CPM 3 PREVIOUS RESEARCH
compared to healthy persons without ongoing pain. Peters et al.(1992)[58] did not find a relation between clinical pain and the activation of CPM. It was found that patients with chronic low back pain and acute postoperative pain have a slightly higher (but not significantly) subjective pain threshold compared to healthy persons.
Also the RIII reflex threshold is observed in Clinical Pain Syndromes patients and control subjects. There was not a significantly difference in threshold and also the rating of clinical pain did not differ from each other. Similar results were found in the study of Boureau et al.(1991)[59] where no difference in RIII reflex thresholds were observed as well.[53]
A declaration could be that the intensity of the ongoing pain of the patients is not enough to induce inhibition by CPM. However, this declaration is not very plausible, because it is demonstrated that also non-painful stimuli be able to induce the CPM effect. Furthermore, a study of Bouhassira et al.(2003)[22] has shown that severe ongoing neuropathic pain did not result in a reduction of the nociceptive RIII reflex of the sural nerve or in a reduction of the subjective noted pain that the patients experienced after the test stimulus. A possible explanation is that clinical pain together with an applied conditioning stimulus could act like two contemporary applied conditioning stimuli, which potentially lead to a reduction of the CPM effects. This is suspected because recently it is found out that two contemporary conditioning stimuli result in a reduced CPM effect when compared with only one conditioning stimulus[53]. In addition, it could be that CPM is not able to be activated for a long time. Then CPM will only be activated at the beginning of the pain, but when it continues for a longer period of time, CPM will slowly exhaust. To clarify the effects of ongoing pain on CPM effects, more research is necessary.[22]
4.6 Statistics 4 METHOD
To reach an answer to the subquestions, figures of the CPM for the NRS values and for the CPM in time were created in SPSS (IBM SPSS Statistics 20) with the function; graph, error bar. Before creating these figures, the values for all the participants are compared in graphs to provide insight in how the within subject variability relates to between subjects variability. There were also additional figures created to validate the research itself. These figures include the EPDT values for the NRS values (created in Matlab 2011), test and retest differences for CPM (created in Excel) and the pre and post EPDT values categorised for order of administration (created in SPSS).
4.6
Statistics
5.1 Conditions 5 RESULTS
Table 3: Paired sample t-test for pre and post values
Pre-Post Significance NRS 10 0.041 NRS 6 0.036 NRS 4 0.044 NRS 0 0.591
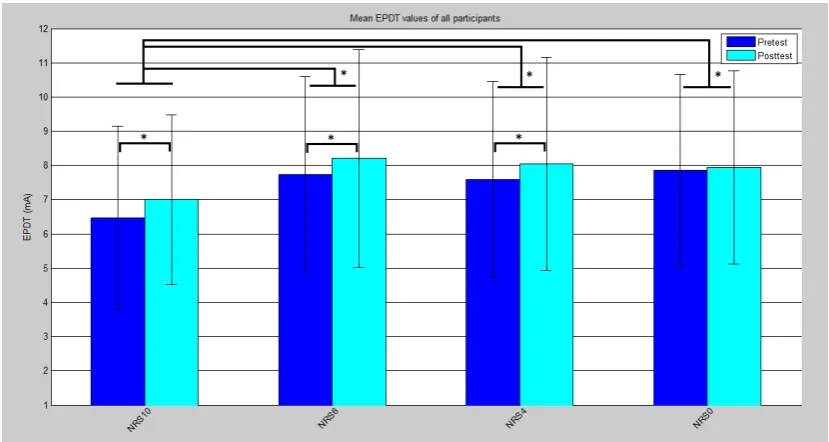
In figure 11 the average pre and post EPDTs values for all participants are plotted per NRS value. The asterixes indicate wich differences are significant according to tables 2 and 3.
Figure 11: The average EPDT value of all participants divided in pre and post values per condition. *Differs with a significance of P<0.05
In figure 11 all EPDT values are provided with an 95% confidence interval. From the mean values within these intervals can be seen that for all conditions the EPDT values after conditioning stimulus are elevated. The difference between pre and post EPDT shows to be significant for all conditions but NRS 0. Both pre and post values are the lowest for NRS 10 in comparison to the rest. In statistical analyses came forward that all EPDT values of NRS 10 differ significantly from NRS 6, 4 and 0.
Order of conditions
5.1 Conditions 5 RESULTS
Figure 12: Pre and post EPDT values for all participants and all conditions in chronological order.
For figure 12 the measured EPDT values of all participants were categorised for chronological order in stead of condition. Since the CPT to reach NRS 10 was always performed first, the point above ’1st order’ only consists of these measurements. The other CPTs consist of NRS scores 6, 4 and 0 and were randomised so the other orders are mixed values for these NRS scores. The figure shows that the EPDT values are lowest at first order and the other EPDT values are at the same level. The difference between the orders is statistically underlined with a p value of 0.037.
5.2 Time 5 RESULTS
Figure 13: EPDT before detected NRS compared to EPDT after detected NRS for all participants
As seen from figure 13 it seems that the difference in EPDT is the largest for NRS 10 and decreases slightly for lower NRS values. Thus, the difference in EPDT seems to be highest for NRS 10. A statistical analysis follows to turn out whether the observed relative difference is significant. A one way repeated measures ANOVA test is used. The within variable is the condition.
Table 4: One way repeated measures ANOVA
Effect F-value Significance Condtitions F(3,15)=1.088 0.384
Table 5: Pairways comparison of CPM for all conditions
Condition Significance NRS 0 NRS 10 0.444 NRS 0 NRS 6 1.000 NRS 0 NRS 4 1.000 NRS 10 NRS 6 0.912 NRS 10 NRS 4 1.000 NRS 6 NRS 4 1.000
A significance level of 95% is chosen, this means there will be a significant difference for the within subject variable, when the significance value is lower than 0.05. The value of the significance in table 4 is thus compared to 0.05. This shows there is a non significant difference between the conditions. The value of the significance in table 5 is also compared to 0,05. This table shows there is no significant difference between any of the conditions.
5.2
Time
5.2 Time 5 RESULTS
Figure 14: The average EPDT values of all participants for time
To answer how the inhibiting effect of the CPM behaves in time after removal of the conditioning stimulus, every 5 minutes the EPDT is registered after immersing till NRS 10. The values of the EPDTs are compared to the EPDT before immersing and the relative difference is calculated. This relative difference is plotted against the time in figure 15.
Figure 15: EPDT before detected NRS compared to EPDT after detected NRS
5.3 Reproducibility 5 RESULTS
to the 95% confidence interval for the relative difference in EPDTs, which is visible in figure 15. All these data is analysed with an one way repeated measures ANOVA, with all moments of measurement as within factors. The test showed these moments do not differ with a significance of 0.358. This is considerably larger than te 0.05 stated as limit for a statistical significant change of EPDT.
5.3
Reproducibility
The outcomes of the comparison between the test and re-test of the five participants are shown in appendix A.6. Appendix A.6 is showing the comparison between the test and re-test for NRS 10, 6, 4 and 0. In figure 16 is shown that three of the five participants had a larger CPM effect at the re-test and two of the five participants had a smaller CPM effect at the re-test. Figure 17 showed a different effect for NRS 6. Two participants had a larger CPM effect and two participants showed a smaller CPM effect. It is striking that one participant shows the same CPM effect at both test and re-test. For NRS 4 is shown in figure 18 the CMP effect of two participants decreases and that for the other three it increases. This seems to be the same effect as NRS 10. However each participant shows a different alteration when we compare NRS 4 and NRS 10. Figure 19 shows the comparison between test and re-test for NRS 0 where one participant is showing the same CPM effect at both tests. Furthermore two participants show an increase and two participants show a decrease in the CPM effect. Overall it can be seen that only participant 5 shows reproducibility for the re-test at the four conditions with a deviation at NRS 10.
6 DISCUSSION
There is a chance that the space between the two stimuli is not the same for every session. This could give the participants different strengths of electrical stimuli during re-test compared to the first test.
To minimize the influence of multiple researchers, the test was practised together and instructions to be given were standardised as much as possible. Still, every researcher will respond differently to participants to explain the study. Furthermore, they will have a different way to clarify their instructions. This could affect the behaviour of the participants which could eventually affect the results of the measurements. The situation where it is most important to avoid this effect, test and re-test of one person were performed by the same researcher. In this way differences between researchers are not an obstacle for the comparison between the test and the re-test.
7 CONCLUSION
7
Conclusion
The study showed that there was no significant difference in CPM between the NRS values 10, 6, 4 and 0. So it can not be proven that subjective experience of pain is needed to induce the CPM effect. However this does not mean that a non or less painful stimulus will induce the CPM effect.
The inhibiting effect of CPM is not significant different within the 20 minutes after the first conditioning stimulus. The post values of all times after the first conditioning stimulus between 20 minutes are higher then the pre values before the conditioning stimulus. This means that the CPM effect stays the same over 20 minutes.
REFERENCES REFERENCES
[57] G. N. L. andHeales Luke, D. A. Rice, K. Rome, and P. J. McNair, “Reliability of the conditioned pain modulation paradigm to assess endogenous inhibitory pain pathways,”Pain Research & Management, vol. 17, no. 2, pp. 98–102, 2012.
[58] M. Peters, A. Schmidt, M. Van den Houdt, R. Koopmans, and M. Sluijter, “Chronic back pain, acute postoperative pain and activation of diffuse noxious inhibitory controls (dnic),”Pain, vol. 50, pp. 177–187, 1992.
[59] F. Boureau, M. Luu, and J. Doubrre, “Study of experimental pain measures and nociceptive reflex in chronic pain patients and normal subjects,”Pain, vol. 44, no. 2, pp. 131–138, 1991. cited By 58.
[60] C. Campbell, C. France, M. Robinson, H. Logan, G. Geffken, and R. Fillingim, “Ethnic differences in diffuse noxious inhibitory controls,”J Pain, vol. 9, no. 8, pp. 759 – 766, 2008.
A APPENDIX
A
Appendix
A.1
Inclusion- and exclusion criteria
Inclusion criteria
• Healthy subjects
• Ability to obtain informed consent
• Subject speaks Dutch
Exclusion criteria
• Use of analgetics
• History of psychiatric or neurological disease
• Chronic pain disorders
• Diabetes Mellitus
• Systemic illness
• (History of) substance abuse (drugs, alcohol)
• Kidney disease
• Disorders revealed during brief neurological examination
• Dermal lesions at the site of stimulation (i.e. psoriasis, ulcera, infection)
• Subject currently has an active implantable device including ICD/pacemaker
A.2 Protocol A APPENDIX
A.3 Form ’meetdata Ice study’ A APPENDIX
A.4 Collected data A APPENDIX
A.4
Collected data
A.4 Collected data A APPENDIX
A.4 Collected data A APPENDIX
A.5 Charts of collected data A APPENDIX
A.5
Charts of collected data
Different CPTs
A.6 Test and re-test A APPENDIX
A.6
Test and re-test
Different CPTs
Figure 16: Combined test and re-test results of NRS 10 for the five participants.
Figure 17: Combined test and re-test results of NRS 6 for the five participants.
Figure 18: Combined test and re-test results of NRS 4 for the five participants
A.6 Test and re-test A APPENDIX
CPM in time
Figure 20: Combined test and re-test results after 0 minutes for the five participants. CPM
Figure 21: Combined test and re-test results after 5 minutes for the five participants.
Figure 22: Combined test and re-test results after 10 minutes for the five participants.
Figure 23: Combined test and re-test results after 15 minutes for the five participants.
![Figure 4: Descending pain pathways and the neurotransmitters that are involved[19].](https://thumb-us.123doks.com/thumbv2/123dok_us/1050734.1131430/9.595.115.329.448.668/figure-descending-pain-pathways-neurotransmitters-involved.webp)
![Figure 6: Cellular processes leading to central sensitization[31].](https://thumb-us.123doks.com/thumbv2/123dok_us/1050734.1131430/12.595.117.479.237.500/figure-cellular-processes-leading-to-central-sensitization.webp)
![Figure 7: Overall tolerance time at resp. 1, 3, 5and 7 ◦C[41].](https://thumb-us.123doks.com/thumbv2/123dok_us/1050734.1131430/14.595.318.529.106.248/figure-overall-tolerance-time-resp-and-c.webp)
![Figure 9: Results of measurements of the NWR threshold, the electrical pain detection threshold and the painintensity ratings using CPT[47].](https://thumb-us.123doks.com/thumbv2/123dok_us/1050734.1131430/15.595.72.527.338.461/figure-results-measurements-threshold-electrical-detection-threshold-painintensity.webp)
![Figure 10: Postoperative time course of pain measured with VAS at rest and movement. D1 is day 5 after surgery.M1, M3 and M6 are respectively 1, 3 en 6 months after surgery[7].](https://thumb-us.123doks.com/thumbv2/123dok_us/1050734.1131430/16.595.141.452.198.424/figure-postoperative-course-measured-movement-surgery-respectively-surgery.webp)