© 2018 IJSRCSEIT | Volume 3 | Issue 4 | ISSN : 2456-3307
A Novel Approach of Quantitative Data Analysis using
Microsoft Excel
Boggu Anil Kumar1, V Rahamathulla2
1Department of MCA Sree Vidyanikethan Institute of Management, Sri Venkateswara University, Tirupati,
Andhra Pradesh, India
2Assistant Professor, Department of MCA, Sree Vidyanikethan Institute of Management,
A.Rangampeta, Tirupati, Andhra Pradesh, India
ABSTRACT
The point of this short guide is to give a prologue to utilizing Microsoft Excel (in the future: Excel) for quantitative data analysis inside the setting of a business and administration inquire about project. It covers a portion of the key highlights of Excel that are especially helpful while completing an examination project. The guide isn't composed for a particular variant of Excel in spite of the fact that it incorporates screen captures for Excel 2010. The greater part of the usefulness alluded to in the guide is additionally accessible in prior and later forms, in spite of the fact that the UI has changed to some degree. The guide accept that you are as of now acquainted with the nuts and bolts of utilizing Excel (e.g. step by step instructions to make worksheets, enter information, utilize formulae and functions, make outlines (charts), print and work, and so on.). On the off chance that you have never utilized Excel, there are some sensibly evaluated course readings to kick you off. Then again, you may find that Excel preparing or bolster material is accessible in your establishment.
Keyword: Excel, Data Analysis, Pivot tables, spreadsheet.
I.
INTRODUCTION
With such a significant number of expert programming packets accessible, why utilize Excel for statistical examination? Accommodation and cost are two critical reasons: a considerable lot of us approach Excel individually PCs and don't have to source and put resources into other programming. Another advantage, especially for those new to information investigation, is to expel the need to take in a product program and in addition getting to holds with the examination strategies. Exceed expectations additionally coordinates effortlessly into other Microsoft Office programming items which can be useful while planning reports or introductions.
Excel: As a spreadsheet, Excel can be utilized for information column, control and introduction
however it additionally offers a suite of statistical examination functions and different instruments that can be utilized to run enlightening measurements and to play out a few unique and valuable inferential factual tests that are broadly utilized as a part of business and administration investigate. Moreover, it gives the majority of the standard spreadsheet usefulness, which makes it helpful for different examination and information control undertakings, including creating graphical and other introduction positions. At long last, regardless of whether utilizing bespoke factual programming, Excel can be useful while getting ready information for examination in those packets.
significant number of the further developed statistical methods that are utilized as a part of research. All the more shockingly, it does not have some basic apparatuses, (for example, boxplots) that
are generally instructed in fundamental
measurements. There is additionally worry among a few analysts over the organization of particular yield in a few functions. The broad scope of chart (graph) formats is likewise scrutinized for empowering terrible practice in information introduction through wrong utilization of shading, 3-D show, and so forth. Notwithstanding these restrictions Excel remains an exceptionally important apparatus for quantitative data analysis as you will see.
Numerous essential investigation projects including basically information investigation, spellbinding insights and basic inferential measurements can be effectively finished utilizing standard Excel. Further developed projects, particularly those including multivariate investigation are all the more difficult in Excel and in such cases it merits considering utilizing expert examination programming, for example, IBM SPSS.
II.
QUANTITATIVE DATA ANALYSIS
INSTRUMENTS IN EXCEL
Exceed expectations incorporates an extensive number of instruments that can be utilized for general information investigation. Here are essential concern is those that are pertinent to the statistical and related investigation strategies. Four arrangements of instruments are especially helpful.
Statistical functions: Excel offers an expansive scope of implicit factual functions. These are utilized to complete particular information control assignments, including statistical tests. A case is the AVERAGE1 work that figures the number juggling mean of the cells in a predetermined range.
Data Analysis ToolPak: The Data Analysis ToolPak is an Excel include. It contains more broad functions, including some helpful inferential statistical tests. An
illustration is the Descriptive Statistics schedule that will create an entire scope of helpful measurements in one go.
The ToolPak isn't accessible in Excel for Mac.
Outlines: Excel's in-manufactured (charts) cover a large portion of the graph composes presented and is priceless in information investigation and introduction.
Pivot tables: Pivot tables give a method for producing synopses of your information and arranging information in ways that are more valuable for specific errands. They are amazingly valuable for making possibility tables, cross-arrangements and tables of means or other rundown insights
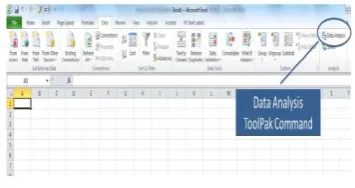
Preparing Excel for analysis: Before beginning, watch that your Data Analysis ToolPak has been stacked. Do this by choosing the Data tab; the Data Analysis charge ought to show up in Analysis on the right-hand side of the strip Figure 1.
Figure 1. Data Analysis ToolPak command
Setting up your data for analysis: Normally there are two alternatives for getting your information into Excel:
1. Import the information in a reasonable arrangement from, for instance, an online study device.
2. Enter the information physically.
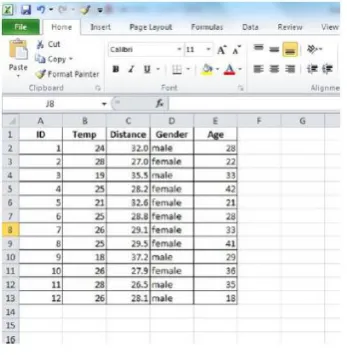
Figure 2. Sample dataset
An individual cell, consequently, contains a respondent's response to a particular inquiry. Figure 2 demonstrates a little dataset went into Excel
Allocate column headers: In the first row, give every column a basic, useful header that will be straightforward when entering information or evaluating output2. Stay away from simply utilizing inquiry numbers (e.g. Q1, Q2, and so on.) as these can be confounding on the off chance that you have countless. Rather, utilize a basic naming framework. A variable estimating consumer loyalty, for instance, could be going CSat: simple to recollect and not liable to be befuddled amid investigation. Guarantee every header is extraordinary (this will encourage ensuing investigation and maintain a strategic distance from perplexity when deciphering yield).
Allocate each case a unique ID: If they don't have one as of now, allot each case in the dataset a remarkable numerical identifier (ID). The most effortless approach to do this is basically to number them successively from 1 through to n (where n is the quantity of cases). For clearness, it is best to put the ID as the first column in the worksheet. Giving every respondent a one of a kind ID helps in arranging and following individual reactions when (for instance) cleaning the information or checking exceptions. A straightforward, back to back number ID framework additionally makes it simple to reorder
are exchanging information from paper duplicates of a survey, it is valuable to compose the ID number onto the paper duplicate to make it less demanding to check any errors.
III. ENTERING YOUR DATA
Once the spreadsheet is set up, basically enter the information into the proper cell as required. Numerical information can be entered maybe as numbers, other information, for example, Likert scale information, ought to be coded (see Chapter 13). With ostensible information you have two alternatives:
Enter the qualities as words (e.g. male/female), suitably truncated if required (e.g. m/f). Guarantee you are predictable in spelling and arrangement as Excel will regard every variety as an alternate esteem.
Figure 3. Using a worksheet to record details of dataset variables
Importing data: On the off chance that you are bringing in the information from another electronic record, watch that the design is reasonable (i.e. respondents as lines, factors as columns), include or change variable names if required, include respondent ID if necessary and watch that the information has imported effectively.
Dealing with your information: Once you have made your dataset, guarantee that you back it up in a protected place, not on your PC or workstation. On the off chance that you roll out any improvements to your lord dataset, record those progressions and make a copy move down. Give records an important name. It is additionally useful to date them as this makes it simpler to track back in the event that you have to do as such. Worksheet tabs can likewise be named to enable you to deal with your information.
IV. SETTING UP YOUR DATA
Once your information is entered you can take after the means in Chapter 13 to set up your information for investigation. In the event that you have to complete information change, for example, recoding factors or figuring summated scores, do as such at this point. (Insight: you can utilize functions, for example, SUM and AVERAGE to help you with making summated scales.) If you are making new
factors amid information change guarantee they are given one of kind column headers.
V.
UTILIZING EXCEL STATISTICAL
FUNCTIONS
You have in all likelihood utilized the Autosum (Σ) SUM work which restores the entirety of a scope of cells, regardless of whether you didn't know that it is just a single of a suite of such apparatuses. Actually Excel incorporates an expansive number of functions covering a wide scope of utilizations, including measurements.
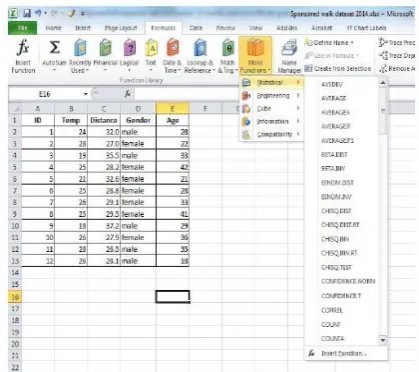
Getting to functions You can get to the insights functions in Excel by means of Formulas > More Functions > Statistical which opens up a menu of accessible functions (see Figure 4). You would then be able to choose the capacity you want. It will be embedded in the dynamic cell so guarantee you pick a goal cell far from your dataset or your information will be overwritten by the capacity yield.
Figure 4. Excel’s statistical functions menu
You can also access functions via Formulas > Insert Functions which opens up the Insert Functions menu into which you can type the name of the function you want, select a Category from which to choose, or use one of the functions listed in the Select a Function window.
The Data Analysis ToolPak is an add-in. It is installed when you install Excel but needs to be loaded prior to use. To do so:
Select File > Options > Ins to open up the Add-ins dialogue box Figure 8.
Figure 8. Excel Add-Ins dialogue box
In the box marked Manage, select Excel Add-ins and click OK.
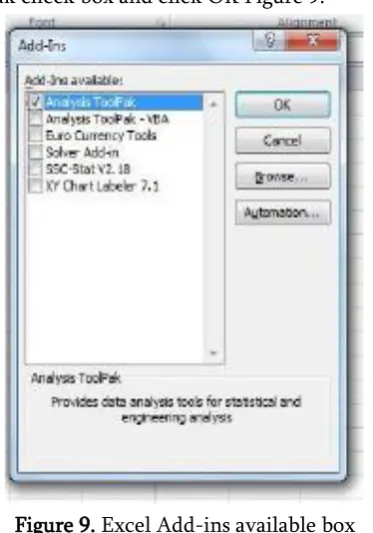
In the Add-ins available box, select the Analysis ToolPak check box and click OK Figure 9.
Figure 9. Excel Add-ins available box
Using functions in the Data Analysis ToolPak: We will present particular ToolPak works in alternate aides yet the accompanying case of applying the
Descriptive Statistics capacity to produce a scope of graphic measurements for the variable age in the example dataset in Figure 2 delineates their utilization:
Figure 10. Data Analysis menu dialogue box
Select Data > Data Analysis to open the Data Analysis menu dialogue box Figure 10.
VII.
CONCLUSION
VIII.
REFERENCES
[1]. Benjamin Jr, William E (2011) The Little Engine That Could: Using LIBNAME Engine Options to Enhance Data Transfers Between SAS and Microsoft Excel Files. Proceedings of SAS Global Forum 2011. 076- 2011.
[2]. Vyverman, Koen (2002) Creating Custom Excel Workbooks from Base SAS with Dynamic Data
Exchange: A Complete Walkthrough.
Proceedings of the Twenty-Seventh Annual SAS Users Group International Conference. 190-27
[3]. Choate, P. and Martell, C. (2006), De-mystifying the SAS LIBNAME engine in Microsoft Excel: A practical guide, Proceedings of the Thirty-First SAS Users Group International Conference, paper 024-31.
[4]. Haworth, L., Zender, C. and Burlew, M. (2009), Output Delivery System (ODS): The Basics and Beyond, SAS Institute, Inc., Cary, NC.
[5]. Roper, C. A. (2000), Intelligently launching Microsoft Excel from SAS, using SCL functions ported to Base SAS, Proceedings of the Twenty-Fifth SAS Users Group International Conference, paper 97-25.
[6]. Vyverman, K. (2000), Using Dynamic Data Exchange to pour SAS data into Microsoft Excel, Proceedings of the Eighteenth SAS European Users Group International Conference.
[7]. Gebhart, E. (2006), The beginner’s guide to ODS MARKUP: Don’t panic!, Proceedings of the Thirty-First SAS Users Group International Conference, paper 263-31.
[8]. Gebhart, E. (2007a), ODS and Office integration, Proceedings of the 2007 SAS Global Forum, paper 227-2007.
[9]. DelGobbo, V. (2007), Creating multi-sheet Excel workbooks the easy way with SAS, Proceedings of the 2007 SAS Global Forum, paper 229-2007
[10]. Gebhart, E. (2008), The devil is in the details: Styles, tips, and tricks that make your Microsoft Excel output look great!, Proceedings of the 2008 SAS Global Forum, paper 036-2008.
[11]. DelGobbo, V. (2006), Creating and importing multi-sheet Excel workbooks the easy way with
SAS, Proceedings of the Thirty-First SAS Users Group International Conference, paper 115-31.
[12]. Gebhart, E. (2007b), ODS Markup, tagsets, and styles! Taming ODS styles and tagsets, Proceedings of the 2007 SAS Global Forum, paper 225-2007
[13]. DelGobbo, V. (2008), Tips and tricks for creating multi-sheet Microsoft Excel workbooks the easy way with SAS, Proceedings of the 2008 SAS Global Forum, paper 192-2008.
[14]. Watts, P. (2004), Highlighting inconsistent record entries in Excel: Possible with SAS ODS, optimized in Microsoft DDE, Proceedings of the Seventeenth Northeast SAS Users Group Conference.
[15]. DelGobbo, V. (2009), More tips and tricks for creating multi-sheet Microsoft Excel workbooks the easy way with SAS, Proceedings of the 2009 SAS Global Forum, paper 152-2009
About Authors:
Mr .B Anil Kumar is currently pursuing his Master Of Computer Applications, Sree Vidyanikethan
Institute of Management,
Tirupati, A.P. He received her Mater of Computer Applications from Sri Venkateswara University, Tirupati.
Mr. V Rahamathulla is currently working as an Assistant Professor
in Master of Computer