Scholarship@Western
Scholarship@Western
Electronic Thesis and Dissertation Repository
8-24-2018 1:20 PM
Performance Impact of Different Lower-Limb Setup Positions in
Performance Impact of Different Lower-Limb Setup Positions in
the Backstroke Swimming Start
the Backstroke Swimming Start
Gordon E. Barkwell
The University of Western Ontario
Supervisor Dickey, James P.
The University of Western Ontario Graduate Program in Kinesiology
A thesis submitted in partial fulfillment of the requirements for the degree in Master of Science © Gordon E. Barkwell 2018
Follow this and additional works at: https://ir.lib.uwo.ca/etd
Part of the Biomechanics Commons, Exercise Science Commons, Other Kinesiology Commons, Other Physics Commons, and the Sports Sciences Commons
Recommended Citation Recommended Citation
Barkwell, Gordon E., "Performance Impact of Different Lower-Limb Setup Positions in the Backstroke Swimming Start" (2018). Electronic Thesis and Dissertation Repository. 5609.
https://ir.lib.uwo.ca/etd/5609
This Dissertation/Thesis is brought to you for free and open access by Scholarship@Western. It has been accepted for inclusion in Electronic Thesis and Dissertation Repository by an authorized administrator of
i
The performance impact of different knee extension angles in the setup position for a backstroke start was evaluated using an instrumented starting surface. Ten backstroke swimmers completed maximum-effort starts in each of two setup positions: one with the knees flexed, and one with the knees extended. The start handles and touchpad were instrumented with tri-axial force plates. Activity of major hip and knee extensors was measured using surface electromyography. Body position was recorded throughout the start using two high-speed cameras. There was no
difference in time to 10 m between the two conditions, indicating there is likely no advantage in universally recommending one setup position over the other. However, starts performed from a setup position with greater knee extension had a greater head entry distance, while starts from a setup position with less knee extension had a greater takeoff velocity; both of these variables are related to better start performance. Coaches should assess athletes to determine which position will result in better performance on an individual basis.
Keywords
ii
This work is dedicated to my late father, Peter Alan Barkwell.
iii
I would like to thank the following individuals for their contributions to this thesis.
First and foremost, my advisor Dr. Jim Dickey, who has taught me so much, and who allowed me to build an appreciation for research. Thank you for investing your valuable time to provide assistance and guidance throughout this program.
My fellow swimmers, coaches and friends of the Western Mustangs swim team, who have been such a central part of my time at Western. Thank you for your enthusiasm to participate in my various projects and for giving me an amazing experience as an athlete, coach and researcher.
Jenna Smith, Morgan Jennings and Western Campus Recreation, who made it possible to use the University pool for testing. Thank you for your flexibility and assistance over the past two years.
iv
Abstract ... i
Keywords ... i
Dedication ... ii
Acknowledgements ... iii
List of Tables ... vii
List of Figures ... viii
List of Appendices ... ix
1 Introduction ... 1
1.1 The Backstroke Start ... 1
1.1.1 Backstroke Start Rule Changes ... 1
1.1.2 Backstroke Start Phases ... 2
1.1.3 The Role of Start Time ... 3
1.2 The Squat Jump... 4
1.3 Selection of Initial Joint Angles ... 4
1.4 Proximal-to-distal Joint Sequencing ... 6
1.5 Swim Start Performance Measures ... 7
1.5.1 Kinetics ... 7
1.5.2 Kinematics ... 8
1.5.3 Electromyography ... 9
1.6 Statement of the Problem ... 9
1.7 Purpose Statement and Hypothesis ... 10
2 Methods ... 10
2.1 Participants ... 10
v
2.3.1 Kinetic Data Collection... 12
2.3.2 Surface Electromyography Data Collection ... 12
2.3.3 Kinematic Data Collection ... 13
2.3.4 Signal Acquisition ... 14
2.4 Maximum Voluntary Contractions ... 15
2.5 Analysis... 15
2.5.1 Kinetic Data Analysis ... 15
2.5.2 EMG Analysis ... 16
2.5.3 Kinematic Data Analysis ... 16
2.5.4 Statistical Analysis ... 17
3 Results ... 18
3.1 Impulse, Takeoff Velocity and Rate of Force Development ... 18
3.2 EMG Results ... 20
3.3 Kinematic Results ... 21
4 Discussion ... 23
4.1 Block phase ... 24
4.1.1 Block Phase Kinetics ... 24
4.1.2 Block Phase Kinematics ... 25
4.1.3 Block Phase EMG ... 26
4.2 Flight Phase Kinematics ... 27
4.3 Time to 10 m ... 28
4.4 Female Participants vs. Entire Group ... 28
4.5 Limitations ... 29
vi
Appendices ... 37
vii
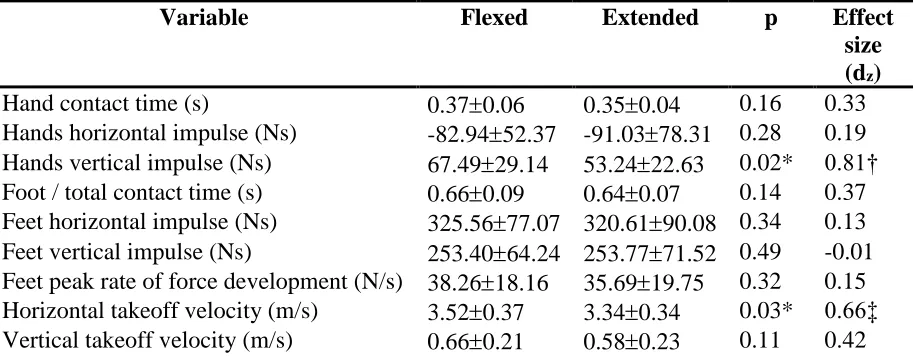
Table 1: Means and respective standard deviations for kinetic data (variables calculated from force data from the load cell and force plate) in the flexed and extended test conditions for all participants. ... 18
Table 2: Means and respective standard deviations for kinetic data (variables calculated from force data from the load cell and force plate) in the flexed and extended test conditions for only female participants. ... 19
Table 3: Means and respective standard deviations for EMG data (variables calculated from voltage data from sEMG sensors) in the flexed and extended test conditions for all participants. ... 20
Table 4: Means and respective standard deviations for EMG data (variables calculated from voltage data from sEMG sensors) in the flexed and extended test conditions for female
participants. ... 21
Table 5: Means and respective standard deviations for kinematic data (variables calculated from digitized landmark positions during the start) in the flexed and extended test conditions for all participants. ... 22
viii
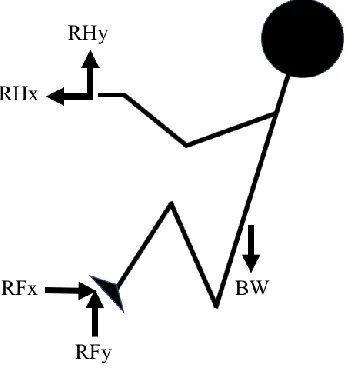
Figure 1: Free-body diagram of the static backstroke start position prior to the start signal describing the reaction force vectors at the hands (RHx, RHy) and feet (RFx, RFy) as well as body weight (BW) vector. ... 8
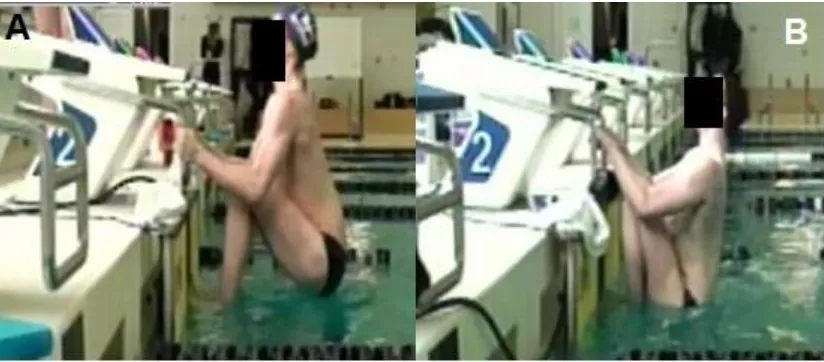
Figure 2: Graphic participants were shown prior to testing to describe the two setup positions. (A) is the extended setup position, and (B) is the flexed setup position. Adapted figure from Barkwell & Dickey, 2017. ... 11
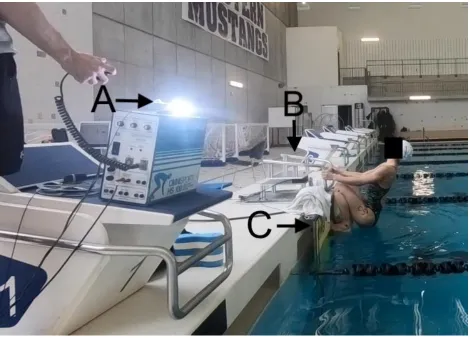
Figure 3: Experimental setup for this study at the instant of the start signal with the swimmer in the flexed start position. (A): Starter strobe and fiber optic cable carrying the light to the
underwater camera. (B): Omega OSB11 start handles mounted to load cell. (C) Omega OBL2 and OCP5 mounted to waterproof force plate. ... 14
Figure 4: The instant of head-entry for a backstroke start with the measurement for head entry distance indicated by the double-sided arrow. ... 17
Figure 5: Difference in knee angle between the extended (left) and flexed (right) setup positions as illustrated in this representative participant. Polarity of hand and foot action forces during setup is indicated by the arrows in the left frame. Lines used to calculate hip and knee extension angles are overlaid on the right frame. ... 26
ix
1
Introduction
1.1
The Backstroke Start
Butterfly, Breaststroke and Freestyle races are started from a platform outside the water, and swimmers dive in to the pool on their front (also described as a ‘ventral start’). In contrast, backstroke races are started in the water. During a backstroke start, swimmers place their feet on the pool wall and hold themselves up using a set of handles mounted to the start block. At the start signal, swimmers execute maximum-effort extension of the back and lower limb joints to propel themselves backward from the wall. An effective backstroke start depends on the swimmer’s ability to apply forces to the wall which generate a high horizontal velocity, minimal drag during flight, an appropriate entry angle and optimal underwater depth.
1.1.1
Backstroke Start Rule Changes
Prior to 2005, swimmers were required to have their feet immerged prior to the start signal. Subsequently, a rule change allowed swimmers to place their feet entirely above the surface of the water. Since this rule change, conflicting results make it unclear whether one setup position produces superior performance over the other. Some results suggest that a start with the feet emerged results in a longer (de Jesus et al., 2011) or unchanged (de Jesus et al., 2013) start time. Others, however, found that starting with the feet above the water resulted in a shorter start time (Nguyen, Bradshaw, Pease, & Wilson, 2014). These authors suggest that the changes are due to the higher centre-of-mass
(COM) position during setup resulting in a water entry with less drag. Further
complicating these findings, starting with the feet emerged has been found to increase horizontal impulse and takeoff velocity, while not affecting time to 15 m (de Jesus, de Jesus, Abraldes, Mourao, et al., 2016).
The Omega OBL2 is compatible with the Omega OSB11 start block, which is also used at national and international competitions. The backstroke ledge is a horizontal strip of plastic pitched at a 10 angle to the wall and coated with an anti-slip texture. The backstroke ledge is adjustable to 5 positions in 2 cm increments above or below the surface of the water. Thus, the backstroke ledge alters the angle, as well as the coefficient of friction between the feet and the starting surface (Swiss Timing, 2015), fundamentally changing backstroke start performances. Accordingly, findings from previous studies which did not use the backstroke ledge may no longer be comparable. Limited research has investigated the backstroke ledge; however, results unanimously indicate that it results in shorter start timescompared to starts performed without the ledge (Barkwell & Dickey, 2017; de Jesus, de Jesus, Abraldes, Medeiros, et al., 2016; Ikeda, Ichikawa, Nara, Baba, & Shimoyama, 2017). Accordingly, since use of the backstroke ledge appears to offer a performance advantage, it has been almost universally adopted as the preferred starting surface. One study has analyzed the impact of different handgrip positions while using the backstroke ledge and determined that it does not affect start time (de Jesus, de Jesus, Abraldes, Medeiros, et al., 2016). No other analysis of setup technique has been performed on starts where the OBL2 is used.
1.1.2
Backstroke Start Phases
The backstroke start can be described in four phases: the block phase, flight phase, entry phase, and underwater phase. The block phase begins when the starter is triggered. In competitions, swimmers react to the audible horn, while timing is started at the simultaneous flash of the strobe built in to the starter (Federation Internationale de Natation (FINA), 2015a). The block phase ends when the swimmer is no longer in
contact with the wall. The flight phase is when the swimmer is airborne, but not yet in the water. During the entry phase, the swimmer enters the water. Finally, the underwater phase begins when the swimmer is fully submerged, and ends when they begin
swimming on the surface. In both dives and backstroke starts, the end of the underwater phase is not consistently defined. Researchers have defined start time as the time between the start signal and when the swimmer reaches 5 m (Takeda, Itoi, Takagi, &
& Dickey, 2017), and 15 m (Nguyen et al., 2014). As presented in a recent review paper, the majority of backstroke start research focuses on the block phase, since actions here define many aspects of the flight, entry and underwater phases (de Jesus, de Jesus, Fernandes, Vilas-Boas, & Sanders, 2014).
Researchers note that more emphasis should be placed on analysis of entry and underwater phases during swim starts (Fischer & Kibele, 2016). Analysis of the underwater phase in backstroke starts is typically limited to start time (de Jesus et al., 2014). While this gives a clear picture of overall start performance, it does not account for many factors which may contribute to the start time. For example, when swimmers travel more than 0.5 m below the surface of the water, wave drag is minimized (Tor, Pease, & Ball, 2015), suggesting that depth affects swim start performance. Furthermore, steeper entry angles are correlated with shorter start times (Seifert et al., 2010); however, this must be interpreted cautiously as preserving forward momentum and achieving an appropriate underwater depth also depend on entry angle.
1.1.3
The Role of Start Time
1.2
The Squat Jump
In many ways, the squat jump is comparable to the backstroke start. While it should be noted that the backstroke start is a unique movement because forces are applied in two directions, the squat jump appears to be an appropriate land model for swim starts (Garcia-Ramos et al., 2016). Like the backstroke start, the squat jump involves starting from a static position with the hips and knees flexed and executing maximum-effort extension of the lower-limbs without an initial countermovement. Strong correlations between squat jump height and start time have been noted in ventral starts (Garcia-Ramos et al., 2016), which further supports that the squat jump is an appropriate model for backstroke starts. Furthermore, the squat jump is a more thoroughly researched movement. Accordingly, the hypotheses of this thesis were based, in part, on findings from squat jump literature.
1.3
Selection of Initial Joint Angles
Performance implications of initial joint angle selection have not previously been analyzed in backstroke starts, but differences in lower-limb setup position have been noted between backstroke swimmers (Barkwell & Dickey, 2017). Computer modeling of squat jumps reveals peak jump height is achieved when a deeper initial squat position is selected (Domire & Challis, 2015; Van Soest, Bobbert, & Van Ingen Schenau, 1994). However, there is a trade-off between jump height and time to peak jump height; when time to peak height is prioritized, optimal performance uses a more extended initial squat (Domire & Challis, 2015). These modeling findings do not seem to directly translate into human performances. Human participants do not show a difference in maximum jump height, but a longer contact time from a deeper squat; this was perhaps because
participants were less accustomed to the deep squat position (Domire & Challis, 2007) and thus were unable to achieve the optimal muscle activation sequence for that starting position (Van Soest et al., 1994).
Muscle slack is also affected by initial muscle force, and should be considered in the backstroke start. Muscle slack is represented by the delay between the onset of muscle contraction and recoil of the series elastic elements, which increases response time (Van Hooren & Bosch, 2016). There are two stages of muscle slack. First is the mechanical delay where the muscle is initially relaxed, and the muscle-tendon unit aligns as the muscle contracts. Second is the compliance effect, where the series elastic elements are stretched and force is transmitted to the skeleton (Van Hooren & Bosch, 2016). By taking up muscle slack prior to movement onset, the delay between the onset of muscle
contraction and joint movement is reduced since the muscle-tendon unit is already aligned and the series elastic elements are already stretched. Pretension through co-contraction of agonist-antagonist pairs is suggested as a method for reducing muscle slack (Van Hooren & Bosch, 2016). In the backstroke start, this type of pretension may be achieved by starting with the lower-limbs in a more extended position. In this start position swimmers hold themselves further above the water, and further out from the pool wall by contracting their lower-limb extensors. Gravity pulls the swimmer down while contraction of the extensors pulls them up, effectively removing extensor muscle slack in the same fashion as co-contraction.
extension. The angles selected in the setup position may dictate the amount of contractile force that can be generated at the start of the block phase. The passive component of the force-length relationship may also have a role. This component is explained by tension in the parallel elastic components at different muscle lengths (Rode, Siebert, Herzog, & Blickhan, 2009). When the muscle is stretched beyond its resting length, tension in the elastic component contributes more force, and as the muscle shortens it contributes less (Rode et al., 2009). This is in contrast to the contractile component of the relationship and is also applicable to the backstroke start; changing initial joint angles will affect muscle length, and thus the amount of elastic force that contributes to the overall impulse. Accordingly, the initial joint angles may affect the magnitude of the impulse and rate of force development in the block phase of the backstroke start due to the implications of the force-length relationship.
1.4
Proximal-to-distal Joint Sequencing
A proximal to distal pattern of joint extension is generally assumed to aid in achieving a high takeoff velocity. For example, in simulations of vertical jumps, a proximal to distal order of joint extension results in maximum jump height (Challis & Domire, 2015; Domire & Challis, 2015; Van Soest et al., 1994).A similar joint extension pattern is observed in jumps performed by live participants (Domire & Challis, 2007; Van Soest et al., 1994). Proximal-to-distal joint sequencing is also beneficial in backstroke starts. For example, swimmers who specialize in backstroke (and thus have more experience with backstroke starts) display a more proximal to distal order of joint extension, and a shorter start time compared to swimmers who did not specialize in backstroke (Takeda et al., 2014). Additionally, when the backstroke ledge is used, swimmers have greater hip extension at the same time points compared to without the backstroke ledge (Ikeda et al., 2017), which is consistent with proximal-to-distal joint sequencing. Importantly, these swimmers also had a lower start time. However, it appears that this order of joint extension is not always achieved in the backstroke start, since some studies have observed no differences in joint sequencing between starts with and without the
Plyometric training programs have resulted in greater peak torque and rate of torque development about the hip and knee joints during the block phase, as well as a higher horizontal velocity in the flight phase of ventral swim starts (Rebutini, Pereira, Bohrer, Ugrinowitsch, & Rodacki, 2016). These improved block and flight phase parameters following a plyometric training protocol also translate to a lower start time (Rejman et al., 2017). Considering the effects of post-activation potentiation (PAP), which is an increase in contractile force after a conditioning contraction (Sale, 2002), a plyometric warm-up protocol which targets the hip extensors may seem appropriate to facilitate proximal-to-distal sequencing. However, the addition of a plyometric warm-up immediately before a backstroke start is related to a longer start time and does not result in a more proximal to distal order of joint extension when compared to a swim-only warm-up (Barkwell & Dickey, 2018). Accordingly, it is important to evaluate whether other approaches result in proximal-to-distal joint sequencing and improved start performances.
1.5
Swim Start Performance Measures
A recent review paper determined that most backstroke start research analyzes kinematics and kinetics throughout the block, flight and entry phases of the start (de Jesus et al., 2014). In some cases, EMG has also been implemented (Barkwell & Dickey, 2018; de Jesus et al., 2015; Hohmann et al., 2008). While these measures are relevant to start performance, the main outcome measure should always be start time. This is because, regardless of differences in kinetics, kinematics, or muscle activation in earlier phases of the start, a shorter start time is ultimately the most relevant for performance.
1.5.1
Kinetics
Impulse is the time-integral of force and is directly proportional to takeoff velocity via the impulse-momentum relationship. A greater impulse results in a higher takeoff
Horizontal velocity is important because this is the swimmers’ progression direction; a greater horizontal velocity during the start will result in a greater velocity during the early underwater phase, and thus a shorter start time. The swimmers also have a positive vertical velocity (toward the ceiling) at the end of the block phase. Vertical velocity is also important because this dictates the duration of the flight phase. A greater vertical velocity at the end of the block phase means that the swimmer will have a longer flight phase, and thus a greater head entry distance. This prolonged period without drag is related to better start performance (Barkwell & Dickey, 2017, 2018; García-Hermoso et al., 2017; Nguyen et al., 2014).
Figure 1: Free-body diagram of the static backstroke start position prior to the start
signal describing the reaction force vectors at the hands (RHx, RHy) and feet (RFx,
RFy) as well as body weight (BW) vector.
1.5.2
Kinematics
common. Rate and onset of hip and knee extension have typically been reported (Barkwell & Dickey, 2017, 2018; de Jesus, de Jesus, Abraldes, Medeiros, et al., 2016; Ikeda et al., 2017; Takeda et al., 2014). These data are important for determining what order of joint extension is associated with better performance. Other relevant parameters such as flight distance (de Jesus, de Jesus, Abraldes, Mourao, et al., 2016), entry angle, and underwater glide speed (de Jesus et al., 2011) are also reported. Of course, start time (time to 5, 10 or 15 m) is also commonly captured and is perhaps the most important performance measure, as previously discussed.
1.5.3
Electromyography
EMG is a useful supplement to kinematic data because it provides a detailed picture of the muscle forces which are resulting in the joint movement. It is not often implemented in swimming due to the challenges associated with waterproofing the instrumentation (Benfield, Newton, & Hortobagyi, 2007; de Jesus et al., 2014; de Jesus, de Jesus, Figueiredo, et al., 2016). Nevertheless, EMG has been used to determine muscle activation patterns in backstroke starts (Hohmann et al., 2008), as well as to compare differences between different start conditions (Barkwell & Dickey, 2018; de Jesus et al., 2015). While it is important to understand the timing and intensity of muscle activity, a recent review indicates that some studies report activation amplitudes but that few studies report timing (de Jesus et al., 2014).
1.6
Statement of the Problem
While the free-swimming portion of the race is important to overall performance, the start is also a determinant of race time (Mason & Cossor, 2000). This is especially relevant in sprint events where differences as low as 0.01 s distinguish first and second place
studies which discuss different start configurations (de Jesus, de Jesus, Abraldes, Mourao, et al., 2016; de Jesus et al., 2013; de Jesus et al., 2015; Nguyen et al., 2014) were performed prior to recent equipment changes, and accordingly findings may no longer be applicable. Since a proximal-to-distal order of joint extension is associated with improved backstroke start (Ikeda et al., 2017; Takeda et al., 2014), simulated squat jump (Challis & Domire, 2015; Domire & Challis, 2015) as well as live squat jump (Domire & Challis, 2007) performance, we must continue to explore methods which allow athletes to perform starts in this fashion.
1.7
Purpose Statement and Hypothesis
The purpose of this thesis was to compare two different backstroke start setup positions and determine if one results in better performance than the other. It was hypothesized that a start performed with the lower-limbs in a more extended position would result in
improved performance due to increased muscle activation prior to the start and lower wall contact time.
2
Methods
2.1
Participants
This study was approved by the Western University Health Sciences Research Ethics Board and all participants provided written informed consent (Appendix A). Ten Backstroke swimmers (7 females and 3 males, 19.2 1.4 years old) that scored 600 or more FINA points in a backstroke event participated in this study. All swimmers were regularly training at the time of data collection. Data collection coincided with the start of the training taper prior to major competitions. Participants were free of injury at the time of data collection.
2.2
Procedure
then performed two more maximum-effort starts from which data were collected for this study. Participants were instructed to complete race-pace starts to 15 m, including
maximum effort underwater kicking. In one start, participants had maximum knee flexion in the “take your mark” position: participants were told to bring their hips close to their ankles. In the other start, participants’ knees were more extended in the “take your mark” position: participants were told to push their hips out from the wall. If participants did not adopt the proper setup position they were told to relax, given the appropriate correction, and the trial was resumed. Participants were also shown a photo which depicted the two setup positions (Figure 2) and performed both setup positions prior to their practice starts; the swimmers pulled themselves into the “take your mark” position, then relaxed without doing the rest of the start. The order in which participants performed the two start types was determined based on their study-specific code (odd numbers performed the flexed start first and even numbers performed the extended start first) which was assigned based on the order in which they enrolled in the study. Two minutes of rest was given between starts, which has been found an adequate recovery period for backstroke starts (Barkwell & Dickey, 2017, 2018; de Jesus, de Jesus, Abraldes, Medeiros, et al., 2016; de Jesus et al., 2013; de Jesus et al., 2015; Nguyen et al., 2014).
Figure 2: Graphic participants were shown prior to testing to describe the two setup
positions. (A) is the extended setup position, and (B) is the flexed setup position.
2.3
Data Collection
2.3.1
Kinetic Data Collection
The pool bulkhead was instrumented with a tri-axial waterproof force plate (OR6-WP-2000, AMTI, Waterdown, MA, USA), which was faced with an ultra-high molecular weight polyethylene sheet (EZ-Glide 350, Eclipse Sports, Cambridge, Ontario, Canada). To simulate race conditions, a FINA standard touchpad (Omega OCP5, Swiss Timing, Corgemont, Switzerland) and backstroke ledge (Omega OBL2, Swiss Timing,
Corgemont, Switzerland) were attached directly to the polyethylene sheet so that all forces registered on the force plate. A set of backstroke handles from a FINA standard start block (Omega OSB11, Swiss Timing, Corgemont, Switzerland) were attached to a load cell (Omega 160, ATI, NC, USA) and mounted to the top of the pool bulkhead with the handles aligned with the surface of the touchpad, which is consistent with FINA guidelines (Federation Internationale de Natation (FINA), 2015a). Start handles were in the same position as if they were on a block. The equipment setup is pictured in Figure 3.
2.3.2
Surface Electromyography Data Collection
MN, USA) to prevent water intrusion. The end of a 15 m length of RG-174 coaxial cable (GoPro Underwater WiFi-View, Eye of Mine action cameras, Long Beach, CA, USA) was taped beside the gluteus maximus sensor to carry the wireless signal above water while the sensor was submerged. Swimmers were able to complete an entire start and simply pull the end of the wire into the pool since this wire was not attached directly to the data collection equipment. This encouraged maximal effort throughout the start since swimmers were not concerned with only progressing to a certain point.
2.3.3
Kinematic Data Collection
All starts were recorded from the side using two high-speed digital video cameras (Hero 6 Black, Go Pro, San Mateo, CA, USA) recording in 1080p at 120 frames per second with a 1/480 s shutter speed. Both cameras captured the left side of the participants. One camera was located above water, 1 m from the end wall and captured the entire above-water portion of the start. The second camera was located underabove-water, 10 m from the end wall and was used to calculate the swimmers’ time to 10 m. Cameras were started
Figure 3: Experimental setup for this study at the instant of the start signal with the
swimmer in the flexed start position. (A): Starter strobe and fiber optic cable
carrying the light to the underwater camera. (B): Omega OSB11 start handles
mounted to load cell. (C) Omega OBL2 and OCP5 mounted to waterproof force
plate.
2.3.4
Signal Acquisition
2.4
Maximum Voluntary Contractions
To normalize muscle activity, each participant performed maximum voluntary isometric contractions (MVICs). In line with recommendations from previous literature, three, four second duration MVICs were collected for each muscle (Halaki & Ginn, 2012). A two-minute break was provided between MVICs, and between the last MVIC and the first backstroke start. For vastus lateralis, participants were seated with 90 degrees of hip and knee flexion and attempted to extend their right knee while the ankle was restrained by a cuff and chain (Halaki & Ginn, 2012). For gluteus maximus, participants were prone with 90 degrees of hip and knee flexion and attempted to extend their right hip while the distal portion of the thigh was restrained by a cuff and chain (Halaki & Ginn, 2012).
Participants were given verbal encouragement during all MVICs to encourage maximum effort.
2.5
Analysis
2.5.1
Kinetic Data Analysis
Voltage signals from the force plate and load cell were converted to forces and moments using a custom LabVIEW program (Version 2010, National Instruments, Austin, TX, USA) based on the calibration matrices from the respective manufacturers. Prior to testing, calibration was verified using a digital force gauge (M5-500, Mark-10, Copiague, NY, USA). The time integrals of the forces were calculated to obtain horizontal and vertical impulses of the hands and feet. Forces were integrated between the reaction time (when forces first changed after the start signal) and last contact (when the forces reached zero). Together with participant body masses, the impulse-momentum theorem was then applied to calculate horizontal and vertical takeoff velocities. Peak rate of force
2.5.2
EMG Analysis
sEMG voltages were processed to linear envelope EMG using a custom LabVIEW program (Version 2013, National Instruments, Austin, TX, USA). Voltages were full-wave rectified, then filtered using a second order 0.1 Hz-3 Hz band pass Butterworth filter. The time delay created by the 2nd order Butterworth filter is comparable to the electromechanical delay of the muscle so the linear envelope EMG is similar to muscle force (Winter, 2005b). To express the voltages as %MVIC, the resulting waveforms were then divided by the peak activity recorded during the MVIC trial. From these data, the average muscle activation during setup (averaged over the 0.5 s immediately prior to the start signal), peak activation during the block phase, time to peak activation during the start, time muscle activity onset over baseline, and predicted rate of force development during the start were calculated for each muscle. Onset of muscle force was calculated automatically using a published algorithm (Santello & McDonagh, 1998), and each trial was visually confirmed to ensure accuracy. Rate of force development was calculated by dividing the increase in muscle activity (peak activity – average setup activity) by the time between the onset of muscle force and peak muscle force.
2.5.3
Kinematic Data Analysis
Joint locations in the video files were manually digitized using Kinovea software
published algorithm and visually inspected for accuracy (Santello & McDonagh, 1998). Head entry distance was calculated as the distance between the front surface of the touchpad and the center of the head as it entered the water (Figure 4). Time to 10 m was calculated as the time elapsed between the starter flash and when the center of the head reached 10 m. The position of the center of the head is appropriate for these
measurements as it is used in competition to determine start infractions (Federation Internationale de Natation (FINA), 2015b).
Figure 4: The instant of head-entry for a backstroke start with the measurement for
head entry distance indicated by the double-sided arrow.
2.5.4
Statistical Analysis
Data were analyzed using paired, one-tailed t-tests with an alpha value of 0.05. The effect size for repeated measures experiments (Cohen’s dz) was also calculated for each variable
large number of female participants (n=7), one analysis was completed with all
participants, and a second analysis was completed with only the female participants. To confirm the reliability of manually digitizing the anatomical landmarks, one trial was digitized three times. Based on these repeated digitizations, the coefficient of multiple determination (R2a) was calculated for each of the four landmark positions (Kadaba et al.,
1989). This parameter tendstends to a value of 1 if the waveforms are similar (Kadaba et al., 1989).
3
Results
The results are summarized in Tables 1, 2, and 3, and are detailed below in specific sections.
3.1
Impulse, Takeoff Velocity and Rate of Force
Development
For all participants, the vertical impulse applied through the hands was an average of 14.3 Ns higher (p=0.02, dz=0.81) during the flexed start. Horizontal takeoff velocity and
net takeoff velocity were also higher in the flexed starts by an average 0.18 (p=0.03, dz=0.66) and 0.20 m/s (p=0.02, dz=0.78), respectively. The remaining kinetic variables
were not significantly different between test conditions (Table 1; p>0.05, dz<0.5).
Table 1: Means and respective standard deviations for kinetic data (variables
calculated from force data from the load cell and force plate) in the flexed and
extended test conditions for all participants.
Variable Flexed Extended p Effect
size (dz)
Net takeoff velocity (m/s) 3.590.37 3.390.36 0.02* 0.78‡ COM takeoff angle () 10.803.43 9.994.27 0.26 0.21
* indicates a statistically significant difference (p<0.05). † indicates a large (dz>0.8)
effect size and ‡ indicates a medium (0.8>dz>0.5) effect size.
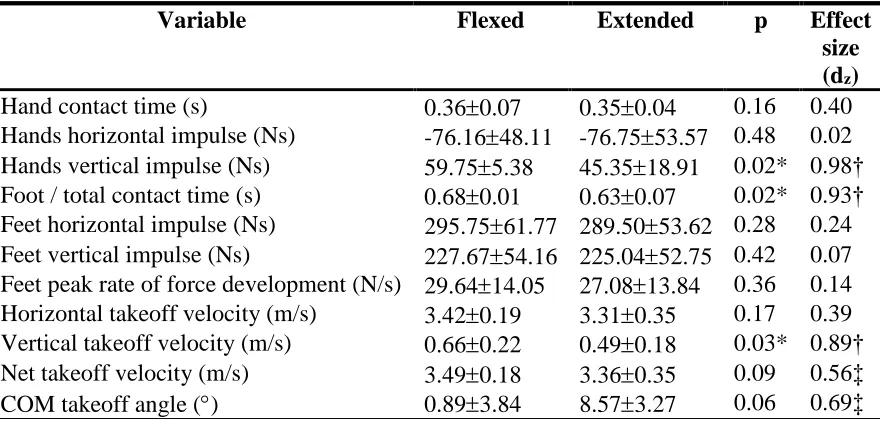
For the female participants, the vertical impulse applied through the hands was, on average, 14.4 Ns higher in the flexed start (p=0.02, dz=0.98). Foot contact time was, on
average, 0.04 s longer in the flexed start position (p=0.02, dz=0.93). Vertical takeoff
velocity was, on average, 0.16 m/s greater in the flexed start position (p=0.03, dz=0.89).
Net takeoff velocity and COM takeoff angle were greater in the flexed start position by 0.13 m/s and 2.32, respectively; these differences were not statistically significant, but did have moderate effect sizes (p=0.09, dz=0.57 and p=0.06, dz=0.70, respectively). The
remaining kinetic variables were not significantly different between test conditions (Table 2; p>0.05, dz<0.5).
Table 2: Means and respective standard deviations for kinetic data (variables
calculated from force data from the load cell and force plate) in the flexed and
extended test conditions for only female participants.
Variable Flexed Extended p Effect
size (dz)
Hand contact time (s) 0.360.07 0.350.04 0.16 0.40 Hands horizontal impulse (Ns) -76.1648.11 -76.7553.57 0.48 0.02 Hands vertical impulse (Ns) 59.755.38 45.3518.91 0.02* 0.98† Foot / total contact time (s) 0.680.01 0.630.07 0.02* 0.93† Feet horizontal impulse (Ns) 295.7561.77 289.5053.62 0.28 0.24 Feet vertical impulse (Ns) 227.6754.16 225.0452.75 0.42 0.07 Feet peak rate of force development (N/s) 29.6414.05 27.0813.84 0.36 0.14 Horizontal takeoff velocity (m/s) 3.420.19 3.310.35 0.17 0.39 Vertical takeoff velocity (m/s) 0.660.22 0.490.18 0.03* 0.89† Net takeoff velocity (m/s) 3.490.18 3.360.35 0.09 0.56‡ COM takeoff angle () 0.893.84 8.573.27 0.06 0.69‡
* indicates a statistically significant difference (p<0.05). † indicates a large (dz>0.8)
3.2
EMG Results
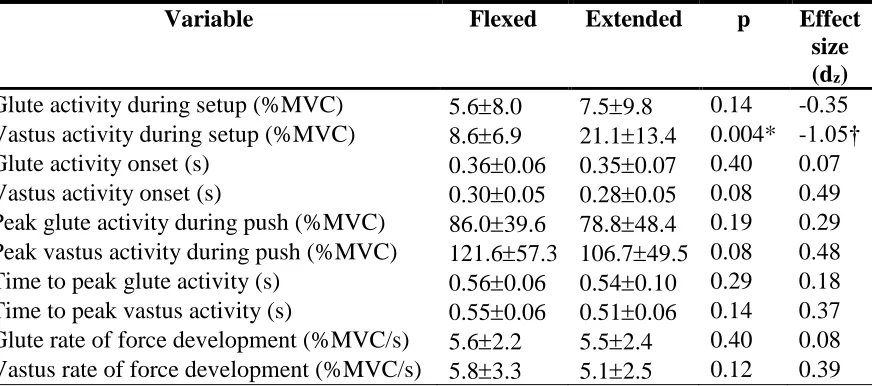
For all participants, vastus lateralis activity prior to the start signal was an average of 12.5%MVC higher in the extended start than the flexed start (p<0.01, dz=1.05). There
was a trend toward greater peak vastus lateralis activity during the block phase (average 14.9% higher) for the flexed start, but this was not statistically significant and the effect size was small (p=0.08, dz=0.48). There was a trend toward earlier onset of vastus
lateralis activity during the block phase for the extended start, but this was not
statistically significant and the effect size was small (p=0.08, dz=0.49). The remaining
EMG variables were not significantly different between test conditions (Table 3; p>0.05, dz<0.5).
Table 3: Means and respective standard deviations for EMG data (variables
calculated from voltage data from sEMG sensors) in the flexed and extended test
conditions for all participants.
Variable Flexed Extended p Effect
size (dz)
Glute activity during setup (%MVC) 5.68.0 7.59.8 0.14 -0.35 Vastus activity during setup (%MVC) 8.66.9 21.113.4 0.004* -1.05† Glute activity onset (s) 0.360.06 0.350.07 0.40 0.07 Vastus activity onset (s) 0.300.05 0.280.05 0.08 0.49 Peak glute activity during push (%MVC) 86.039.6 78.848.4 0.19 0.29 Peak vastus activity during push (%MVC) 121.657.3 106.749.5 0.08 0.48 Time to peak glute activity (s) 0.560.06 0.540.10 0.29 0.18 Time to peak vastus activity (s) 0.550.06 0.510.06 0.14 0.37 Glute rate of force development (%MVC/s) 5.62.2 5.52.4 0.40 0.08 Vastus rate of force development (%MVC/s) 5.83.3 5.12.5 0.12 0.39
* indicates a statistically significant difference (p<0.05). † indicates a large (dz>0.8)
effect size and ‡ indicates a medium (0.8>dz>0.5) effect size.
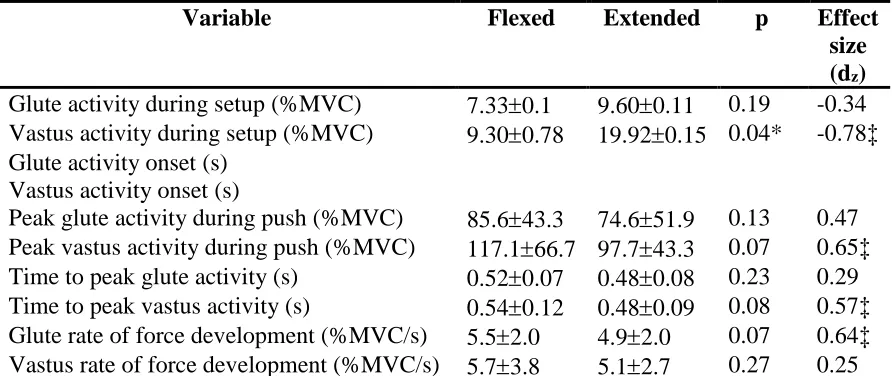
For female participants, vastus lateralis activity prior to the start signal was an average of 10.6% higher (p=0.04, dz=-0.78). There was a greater peak vastus lateralis activity during
the block phase for the flexed start (average 19.3% higher); this comparison was not statistically significant, but the effect size was moderate (p=0.07, dz=0.65). There was an
which was not statistically significant, although the effect size was moderate (p=0.10, dz=0.54). Finally, there was an average 0.6%MVC/s greater rate of force development in
gluteus maximus during the block phase of the flexed start which was not statistically significant, but had a moderate effect size (p=0.07, dz=0.64). The remaining EMG
variables were not significantly different between test conditions (Table 4; p>0.05, dz<0.5).
Table 4: Means and respective standard deviations for EMG data (variables
calculated from voltage data from sEMG sensors) in the flexed and extended test
conditions for female participants.
Variable Flexed Extended p Effect
size (dz)
Glute activity during setup (%MVC) 7.330.1 9.600.11 0.19 -0.34 Vastus activity during setup (%MVC) 9.300.78 19.920.15 0.04* -0.78‡ Glute activity onset (s)
Vastus activity onset (s)
Peak glute activity during push (%MVC) 85.643.3 74.651.9 0.13 0.47 Peak vastus activity during push (%MVC) 117.166.7 97.743.3 0.07 0.65‡ Time to peak glute activity (s) 0.520.07 0.480.08 0.23 0.29 Time to peak vastus activity (s) 0.540.12 0.480.09 0.08 0.57‡ Glute rate of force development (%MVC/s) 5.52.0 4.92.0 0.07 0.64‡ Vastus rate of force development (%MVC/s) 5.73.8 5.12.7 0.27 0.25
* indicates a statistically significant difference (p<0.05). † indicates a large (dz>0.8)
effect size and ‡ indicates a medium (0.8>dz>0.5) effect size.
3.3
Kinematic Results
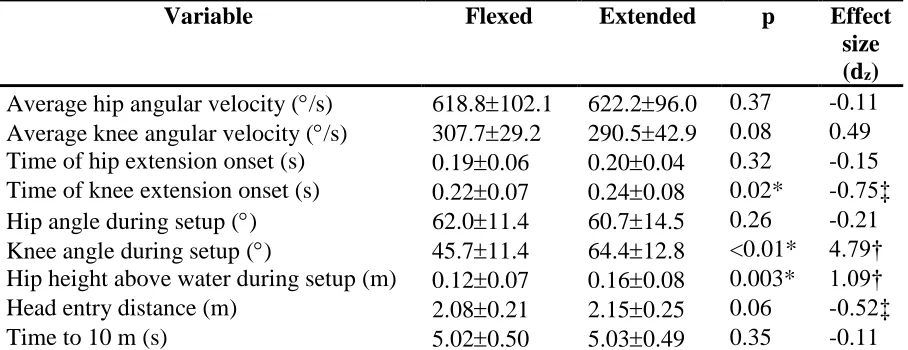
The coefficient of multiple determination confirmed there was little variability in the manual digitizing of the joint coordinates. The knee, hip and shoulder joints had an R2a
of 0.99. The ankle joint had an R2a of 0.86. For all participants, initial knee angle was
significantly greater (an average of 18.7 greater) in the extended start position (p<0.01, dz=4.79). The position of the hip relative to the surface of the water was an average of
0.04 m higher in the extended start position (p<0.01, dz=1.09). Onset of knee extension
occurred an average of 0.02 s later in the extended start (p=0.02, dz=-0.75). These
on average, 0.07 m greater in the extended start (p=0.06, dz=0.53). There was a trend
toward a lower average angular velocity of knee extension (average 17.2/s lower) in the extended start, however this difference was not statistically significant and had a small effect size (p=0.08, dz=0.49). Additionally, there was a fair negative correlation (r=-0.51)
between head entry distance and time to 10 m which was statistically significant
(p=0.02). There was also a fair negative correlation between time to 10 m and horizontal (r=-0.45) as well as net (r=-0.46) takeoff velocity. These correlations were also
statistically significant (p=0.04 for both correlations). The remaining kinematic variables, including time to 10 m, were not significantly different between test conditions and had small effect sizes (Table 5; p>0.05, dz<0.5).
Table 5: Means and respective standard deviations for kinematic data (variables
calculated from digitized landmark positions during the start) in the flexed and
extended test conditions for all participants.
Variable Flexed Extended p Effect
size (dz)
Average hip angular velocity (/s) 618.8102.1 622.296.0 0.37 -0.11 Average knee angular velocity (/s) 307.729.2 290.542.9 0.08 0.49 Time of hip extension onset (s) 0.190.06 0.200.04 0.32 -0.15 Time of knee extension onset (s) 0.220.07 0.240.08 0.02* -0.75‡ Hip angle during setup () 62.011.4 60.714.5 0.26 -0.21 Knee angle during setup () 45.711.4 64.412.8 <0.01* 4.79† Hip height above water during setup (m) 0.120.07 0.160.08 0.003* 1.09† Head entry distance (m) 2.080.21 2.150.25 0.06 -0.52‡ Time to 10 m (s) 5.020.50 5.030.49 0.35 -0.11
* indicates a statistically significant difference (p<0.05). † indicates a large (dz>0.8)
effect size and ‡ indicates a medium (0.8>dz>0.5) effect size.
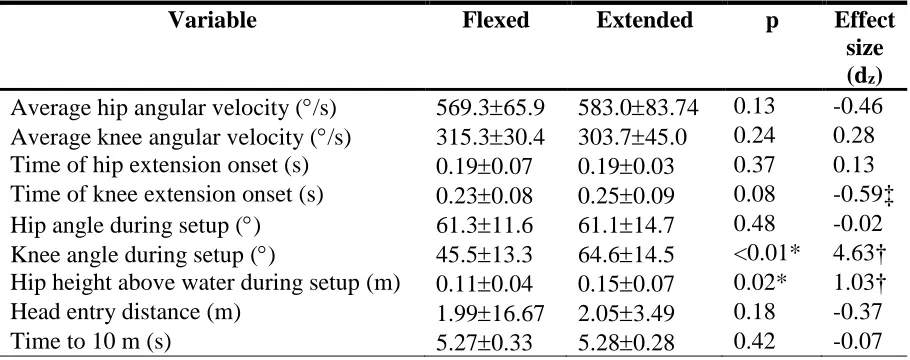
For female participants, initial knee angle was significantly greater (an average of 19.0 greater) in the extended start position (p<0.01, dz=4.63). The position of the hip relative
to the surface of the water was an average of 0.04 m higher in the extended start position (p=0.02, dz=1.03). Onset of knee extension occurred an average of 0.02 s later in the
not significantly different between test conditions and had small effect sizes (Table 3; p>0.05, dz<0.5). Additionally, there were fair correlations between time to 10 m and horizontal (r=-0.52) as well as net (r=-0.50) takeoff velocity. However, these correlations were identified as trends (p=0.05 and p=0.07, respectively) rather than statistically significant. The remaining kinematic variables were not significantly different between test conditions and had small effect sizes (Table 6; p>0.05, dz<0.5).
Table 6: Means and respective standard deviations for kinematic data (variables
calculated from digitized landmark positions during the start) in the flexed and
extended test conditions for female participants.
Variable Flexed Extended p Effect
size (dz)
Average hip angular velocity (/s) 569.365.9 583.083.74 0.13 -0.46 Average knee angular velocity (/s) 315.330.4 303.745.0 0.24 0.28 Time of hip extension onset (s) 0.190.07 0.190.03 0.37 0.13 Time of knee extension onset (s) 0.230.08 0.250.09 0.08 -0.59‡ Hip angle during setup () 61.311.6 61.114.7 0.48 -0.02 Knee angle during setup () 45.513.3 64.614.5 <0.01* 4.63† Hip height above water during setup (m) 0.110.04 0.150.07 0.02* 1.03† Head entry distance (m) 1.9916.67 2.053.49 0.18 -0.37 Time to 10 m (s) 5.270.33 5.280.28 0.42 -0.07
* indicates a statistically significant difference (p<0.05). † indicates a large (dz>0.8)
effect size and ‡ indicates a medium (0.8>dz>0.5) effect size.
4
Discussion
This project investigated the differences in start performance between backstroke starts performed from a setup with the lower-limbs in an extended or flexed position. The findings did not support the hypothesis that setup with the lower-limbs in a more
regarding backstroke start performance. The following sections (4.1-4.3) discuss the pooled results of all ten participants.
4.1
Block phase
As previously discussed, the block phase begins at the start signal, and ends at the
swimmer’s last contact with the wall. In this study, kinetic data provided us with detailed information regarding COM velocity at the end of the block phase, as well as how forces applied to the start handles and pool wall contributed. EMG and Kinematic data provided us with information on muscle activity, and the resulting changes in joint kinematics, respectively.
4.1.1
Block Phase Kinetics
In the pooled analysis, horizontal takeoff velocity, total takeoff velocity, and vertical impulse through the hands were significantly higher in the flexed start. These data
to previous research which compared above and below water foot positioning; starts with the feet placed above the water had a greater horizontal impulse and takeoff velocity, but no significant difference in time to 10 m (de Jesus, de Jesus, Abraldes, Mourao, et al., 2016). Contact time was not significantly different between conditions, which suggests this difference in impulse is due to a change in the magnitude of the applied forces.
4.1.2
Block Phase Kinematics
Figure 5: Difference in knee angle between the extended (left) and flexed (right)
setup positions as illustrated in this representative participant. Polarity of hand and
foot action forces during setup is indicated by the arrows in the left frame. Lines
used to calculate hip and knee extension angles are overlaid on the right frame.
4.1.3
Block Phase EMG
Vastus lateralis activity was an average 12.5% higher during setup in the extended start. This is because the knee extensors needed to produce a force to hold the hips above the water. The greater vastus lateralis activity observed in the extended setup position
of vastus lateralis force is earlier, larger counter-forces from the hands prevent it from resulting in earlier joint movement. In contrast, gluteus maximus activity during setup was not significantly different between test conditions, which is also consistent with the statistically insignificant change in hip angle between start conditions. With no change in EMG activity or hip angles between start conditions, we also expect there was no
difference in hip extensor slack.
4.2
Flight Phase Kinematics
Some studies analyzing dive starts have used kinetic block performance to predict time to 2 m (Dragunas, 2015; Murrell & Dragunas, 2012). However, this calculation is not appropriate in the backstroke start since, in most cases, there is drag from the feet and lower legs passing through the water during the flight phase (Figure 4). Head entry distance has been implemented in previous studies to describe block phase performance, and the magnitudes observed in this study are consistent with those observed by other researchers (Nguyen et al., 2014).
Participants had a greater head entry distance when starting from a more extended position. This suggests that the extended start position resulted in better performance during the flight phase. This may be explained by the aforementioned hip position during setup; the vertical position of the hips suggests that the COM is higher when swimmers select a more extended position, which may result in a flight phase with less drag (Nguyen et al., 2014). The more proximal-to-distal order of lower limb joint extension observed in the extended start may also have contributed to this difference. When the backstroke ledge is used, it appears that swimmers demonstrate a more proximal-to-distal pattern of joint extension in the block phase and display a higher COM position at the end of the block phase (Ikeda et al., 2017). While these authors found no difference in
4.3
Time to 10 m
As previously mentioned, studies on backstroke starts use different distances to quantify start time. Other researchers have found that time to 5 m, 10 m and 15 m all had
statistically significant differences of the same polarity between two start conditions (Nguyen et al., 2014). While the magnitude of our time to 10 m was greater than that observed in their study, this is likely because the majority of our participants were female, while their participants were exclusively male (Nguyen et al., 2014). Therefore, our findings are consistent with previously published literature, and we expect our findings related to time to 10 m are comparable to what would be observed at 5 m and 15 m as well. Despite the flexed start resulting in better block phase performance, and the extended start resulting in better flight phase performance, no significant change in time to 10 m was observed between conditions. This indicates that the advantage afforded by a change in the applied forces, as reflected by the higher horizontal takeoff velocity when starting from a flexed position, is essentially equal to the advantage afforded by a change in body configuration in the flight phase, as reflected by the greater head entry distance when starting from a more extended position. Time to 10 m is not easily captured by coaches; however, it may be the most important indication of start performance.
Correlations can indicate the variables, which may be more easily captured by coaches, are closely related to time to 10 m. Our past studies that examined backstroke start equipment changes (Barkwell & Dickey, 2017) and warm-up modifications (Barkwell & Dickey, 2018) both found strong correlations between head entry distance and time to 10 m. Although the correlation was only fair in this project, it still supports the
relationship between head entry distance and time to 10 m. Accordingly, it is clear that the relationship between head entry distance and start time holds across a wide range of situations.
4.4
Female Participants vs. Entire Group
significance of the change between start conditions was slightly different for some variables. Vertical impulse applied through the hands, net takeoff velocity and vastus lateralis activity prior to the start signal were similar between the two groups. Some variables where there appeared to be a trend in the pooled data reached statistical significance when the females were analyzed separately. For example, the peak vastus lateralis activity in the block phase was higher for the flexed start in the female only group based on a moderate effect size, where the effect size was just below this threshold in the pooled analysis. The same is true of the time to peak vastus lateralis activity and time to vastus lateralis activity onset, which were both shorter in the extended start based on a moderate effect size in the female-only analysis. Vertical takeoff velocity and COM takeoff angle were both significantly higher for starts in the flexed position in the female-only analysis. These comparisons had large and moderate effect sizes, respectively, while the same comparisons in the pooled analysis were not significantly different and had small effect sizes. Finally, certain variables showed statistically significant differences in the pooled analysis but did not in the female-only analysis. For example, the horizontal takeoff velocity and head entry distance were not significantly different between start conditions in the female-only analysis, and these comparisons had small effect sizes. This suggests that while start technique appears to be relatively consistent between the sexes, there may be differences between males and females that should be investigated. Past backstroke start literature has not investigated sex differences, and these findings indicate it is an appropriate direction for future research.
4.5
Limitations
ankle angle calculations. We estimated RFD in gluteus maximus and vastus lateralis muscles based on EMG data. While this approach accounts for the muscle activation, it is important to note that this approach does not account for force produced by passive properties of the muscles and tendons. However, linear envelope EMG closely resembles muscle force (De Luca, 1997; Winter, 2005b), so it is appropriate to implement EMG to predict muscle force in certain cases. Rate of force development is an important
consideration for explosive sport movements like the backstroke start. This is because the peak force is reached earlier and can contribute to a greater impulse and power (Taber, Bellon, Abbott, & Bingham, 2016). However, force plate data only describe the net forces, and not the contribution of individual muscles. Accordingly, despite the
limitations, we estimated muscle force from EMG to provide a lower-level picture of rate of force development during the block phase of a backstroke start.
Another limitation was that males and females were grouped in the analysis. We have minimized the impact of this limitation by implementing a repeated measures design. This was appropriate because were specifically interested in magnitude of change
between start conditions, not the absolute values. Accordingly, major differences between males and females, such as males producing a higher muscular power per unit
bodyweight (Gursoy, 2010), did not affect our analysis. Furthermore, separate analysis of the female participants indicated the direction of the mean change between conditions was the same as in the pooled analysis for nearly every variable. Thus, the difference in statistical significance for some variables, including correlations, may be explained by the small sample size (n=7). This further supports that combining males and females in the analysis did not undermine our comparisons.
time to 10 m and 3% for head entry distance. This represents variability of 0.05 s in time to 10 m, and 0.06 m for head entry distance. Many participants had differences much larger than these magnitudes between start conditions in this study. Furthermore, our statistically significant p-values are supported by medium or large effect sizes. Thus, it is reasonable to conclude the differences observed in this study are not due to inter-start variability. We did not account for buoyancy or drag when calculating predicted takeoff velocities. In starts where swimmers had their hips partially submerged prior to the start signal (Figure 6), buoyancy would have affected the vertical force used to calculate bodyweight, and thus the vertical impulse calculation. Because the submerged area is small, and in some participants or trials none of the body is submerged, we expect the impact of this limitation to be negligible. Similarly, we expect the influence of drag on the predicted horizontal takeoff velocity was not meaningful. In cases where the hips were submerged prior to the start signal they were quickly lifted out of the water during the start manoeuvre. Accordingly, the predicted change in horizontal momentum would not have been affected by drag after this point. We do acknowledge the significant impact of drag during the flight phase in certain participants, which is why we augmented our takeoff velocity measures with head entry distance to quantify performance during this phase.
Figure 6: Example of a participant with the hips partially submerged in the setup
4.6
Training implications
Findings from this study suggest that selecting a setup position with the lower-limbs more flexed or more extended does not affect overall performance. However, this finding is based on the pooled data of all participants. Individually, some participants had
differences in start time exceeding 0.1 s, with some achieving a shorter start time in the flexed start position and others achieving a shorter start time in the extended start position. Accordingly, it appears that the optimal setup positions may vary between swimmers, and that coaches and athletes should determine which setup position results in better performance on an individual basis. Individual characteristics may provide some indication as to which position may be more appropriate. For example, swimmers who can generate more muscular power may find the flexed start position more suitable, as they may take advantage of the greater horizontal takeoff velocity. In contrast, swimmers who have produce less power may find the extended setup position where they can take advantage of decreased drag during the flight phase is more appropriate. When
5
References
Barkwell, G. E., & Dickey, J. P. (2017). Backstroke start performance: the impact of using the Omega OBL2 backstroke ledge. Sports Biomechanics, 1-13.
doi:10.1080/14763141.2017.1353130
Barkwell, G. E., & Dickey, J. P. (2018). The Effects of Plyometric Warm-up on Lower Limb Muscle Activity and Time to 10 m in the Backstroke Swimming Start.
Journal of Human Movement and Sports Sciences, submitted.
Barlow, H., Halaki, M., Stuelcken, M., Greene, A., & Sinclair, P. J. (2014). The effect of different kick start positions on OMEGA OSB11 blocks on free swimming time to 15m in developmental level swimmers. Hum Mov Sci, 34, 178-186.
doi:10.1016/j.humov.2014.02.002
Benfield, R. D., Newton, E. R., & Hortobagyi, T. (2007). Waterproofing EMG
Instrumentation. Biol Res Nurs, 8(3), 195-201. doi:10.1177/1099800406293313 Challis, J. H., & Domire, Z. J. (2015). Insights to vertical jumping from computer
simulations. Movement & Sport Sciences - Science & Motricité(90), 69-78. doi:10.1051/sm/2012038
Chan, Y. H. (2003). Biostatistics 104: correlational analysis. Singapore Medicaal Journal, 44(12), 614-619.
de Jesus, K., de Jesus, K., Abraldes, J. A., Medeiros, A. I., Fernandes, R. J., & Vilas-Boas, J. P. (2016). Are the new starting block facilities beneficial for backstroke start performance? Journal of Sports Sciences, 34(9), 871-877.
doi:10.1080/02640414.2015.1076166
de Jesus, K., de Jesus, K., Abraldes, J. A., Mourao, L., Borgonovo-Santos, M., Medeiros, A. I., . . . Vilas-Boas, J. P. (2016). The effect of different foot and hand set-up positions on backstroke start performance. Sports Biomechanics, 15(4), 481-496. doi:10.1080/14763141.2016.1182580
de Jesus, K., de Jesus, K., Fernandes, R. J., Vilas-Boas, J. P., & Sanders, R. (2014). The backstroke swimming start: state of the art. Journal of Human Kinetics, 42, 27-40. doi:10.2478/hukin-2014-0058
de Jesus, K., de Jesus, K., Figueiredo, P., Gonçalves, P., Fernandes, R. J., & Vilas-Boas, J. P. (2016). Neuromuscular Activation in Swimming and Waterpolo. In D. Mitchell (Ed.), Surface Electromyography: Fundamentals, Computational Techniques and Clinical Applications: Nova Science Publishers.
de Jesus, K., de Jesus, K., Figueiredo, P., Goncalves, P., Pereira, S., Vilas-Boas, J. P., & Fernandes, R. J. (2011). Biomechanical analysis of backstroke swimming starts.
Int J Sports Med, 32(7), 546-551. doi:10.1055/s-0031-1273688
de Jesus, K., de Jesus, K., Figueiredo, P., Goncalves, P., Pereira, S. M., Vilas-Boas, J. P., & Fernandes, R. J. (2013). Backstroke start kinematic and kinetic changes due to different feet positioning. Journal of Sports Sciences, 31(15), 1665-1675.
doi:10.1080/02640414.2013.794298
de Jesus, K., de Jesus, K., Medeiros, A. I., Goncalves, P., Figueiredo, P., Fernandes, R. J., & Vilas-Boas, J. P. (2015). Neuromuscular Activity of Upper and Lower Limbs during two Backstroke Swimming Start Variants. Journal of Sports Science and Medicine, 14(3), 591-601.
Domire, Z. J., & Challis, J. H. (2007). The influence of squat depth on maximal vertical jump performance. Journal of Sports Sciences, 25(2), 193-200.
doi:10.1080/02640410600630647
Domire, Z. J., & Challis, J. H. (2015). Maximum height and minimum time vertical jumping. Journal of Biomechanics, 48(11), 2865-2870.
doi:10.1016/j.jbiomech.2015.04.021
Dragunas, A. (2015). Factors affecting block performance from the Omega OSB11 starting platform. (Unpublished doctoral dissertation), the University of Western Ontario, Retrieved from
http://ir.lib.uwo.ca/cgi/viewcontent.cgi?article=4707&context=etd
Federation Internationale de Natation (FINA). (2015a). FINA Facilities Rules. Retrieved from http://www.fina.org/sites/default/files/rules-print-pdf/8458.pdf
Federation Internationale de Natation (FINA). (2015b). Swimming Rules. Retrieved from
http://www.fina.org/sites/default/files/rules-print-pdf/7440.pdf
Fischer, S., & Kibele, A. (2016). The biomechanical structure of swim start performance.
Sports Biomechanics, 15(4), 397-408. doi:10.1080/14763141.2016.1171893 Garcia-Hermoso, A., Escalante, Y., Arellano, R., Navarro, F., Dominguez, A. M., &
Saavedra, J. M. (2013). Relationship between Final Performance and Block Times with the Traditional and the New Starting Platforms with A Back Plate in
International Swimming Championship 50-M and 100-M Freestyle Events.
Journal of Sports Science and Medicine, 12(4), 698-706.
García-Hermoso, A., Saavedra, J. M., Arellano, R., & Navarro, F. (2017). Relationship between swim start wall contact time and final performance in backstroke events in international swimming championships. International Journal of Performance Analysis in Sport, 17(3), 232-243. doi:10.1080/24748668.2017.1331573
Garcia-Ramos, A., Padial, P., de la Fuente, B., Arguelles-Cienfuegos, J., Bonitch-Gongora, J., & Feriche, B. (2016). Relationship Between Vertical Jump Height and Swimming Start Performance Before and After an Altitude Training Camp.
Journal of Strength & Conditioning Research, 30(6), 1638-1645. doi:10.1519/JSC.0000000000001242
Gordon, A. M., Huxley, A. F., & Julian, F. J. (1966). The variation in isometric tension with sarcomere length in vertebrate muscle fibres. The Journal of Physiology, 184(1), 170-192. doi:10.1113/jphysiol.1966.sp007909
Gursoy, R. (2010). Sex differences in relations of muscle power, lung function, and reaction time in athletes. Percept Mot Skills, 110(3 Pt 1), 714-720.
doi:10.2466/PMS.110.3.714-720
Hahn, D., Olvermann, M., Richtberg, J., Seiberl, W., & Schwirtz, A. (2011). Knee and ankle joint torque-angle relationships of multi-joint leg extension. Journal of Biomechanics, 44(11), 2059-2065. doi:10.1016/j.jbiomech.2011.05.011
Halaki, M., & Ginn, K. (2012). Normalization of EMG signals: To normalize or not to normalize and what to normalize to? In G. R. Naik (Ed.), Computational Intelligence in Electromyography Analysis - A Perspective on Current Applications and Future Challenges (pp. 175-194): InTech.
Ikeda, Y., Ichikawa, H., Nara, R., Baba, Y., & Shimoyama, Y. (2017). Does installation of the backstroke start device reduce 15-m start time in swimming? Journal of Sports Sciences, 35(2), 189-195. doi:10.1080/02640414.2016.1161204
Kadaba, M. P., Ramakrishnan, H. K., Wootten, M. E., Gainey, J., Gorton, G., & Cochran, G. V. (1989). Repeatability of kinematic, kinetic, and electromyographic data in normal adult gait. J Orthop Res, 7(6), 849-860. doi:10.1002/jor.1100070611 Lakens, D. (2013). Calculating and reporting effect sizes to facilitate cumulative science:
a practical primer for t-tests and ANOVAs. Frontiers in Psychology, 4, 863. doi:10.3389/fpsyg.2013.00863
Maganaris, C. N. (2003). Force-length characteristics of the in vivo human gastrocnemius muscle. Clin Anat, 16(3), 215-223. doi:10.1002/ca.10064
Mason, B., & Cossor, J. (2000). What can we learn from competition analysis at the 1999 pan pacific swimming championships? Paper presented at the 18 International Symposium on Biomechanics in Sport, Hong Kong.
Murrell, D., & Dragunas, A. (2012). A Comparison of Two Swimming Start Techniques from the Omega OSB11 Starting Block. Western Undergraduate Research Journal: Health and Natural Sciences, 1-6. doi:10.5206/wurjhns.2012-13.1 Nguyen, C., Bradshaw, E. J., Pease, D., & Wilson, C. (2014). Is starting with the feet out
of the water faster in backstroke swimming? Sports Biomechanics, 13(2), 154-165. doi:10.1080/14763141.2014.885072
Rebutini, V. Z., Pereira, G., Bohrer, R. C., Ugrinowitsch, C., & Rodacki, A. L. (2016). Plyometric Long Jump Training With Progressive Loading Improves Kinetic and Kinematic Swimming Start Parameters. Journal of Strength & Conditioning Research, 30(9), 2392-2398. doi:10.1519/JSC.0000000000000360
Rejman, M., Bilewski, M., Szczepan, S., Klarowic, A., Rudnik, D., & Maćkała, K. (2017). Assessing the impact of a targeted plyometric training on changes in selected kinematic parameters of the swimming start. Acta Bioengineering and Biomechanics, 10(2), 121-143. doi:10.5277/ABB-00627-2016-03
Rode, C., Siebert, T., Herzog, W., & Blickhan, R. (2009). The Effects of Parallel and Series Elastic Components on the Active Cat Soleus Force-Length Relationship.
Journal of Mechanics in Medicine and Biology, 09(01), 105-122. doi:10.1142/s0219519409002870
Sale, D. G. (2002). Postactivation potentiation: role in human performance. Exercise and Sport Sciences Reviews, 30(3), 138-143.
Santello, M., & McDonagh, M. J. (1998). The control of timing and amplitude of EMG activity in landing movements in humans. Experimental Physiology, 83(6), 857-874. doi:10.1113/expphysiol.1998.sp004165
Seifert, L., Vantorre, J., Lemaitre, F., Chollet, D., Toussaint, H. M., & Vilas-Boas, J. P. (2010). Different profiles of the aerial start phase in front crawl. Journal of Strength & Conditioning Research, 24(2), 507-516.
doi:10.1519/JSC.0b013e3181c06a0e
SENIAM. (2016). Recommendations for sensor locations on individual muscles. Retrieved from http://seniam.org/sensor_location.htm
Swiss Timing. (2015). OBL2 Pro: Backstroke Ledge. Retrieved from
Taber, C., Bellon, C., Abbott, H., & Bingham, G. E. (2016). Roles of Maximal Strength and Rate of Force Development in Maximizing Muscular Power. Strength and Conditioning Journal, 38(1), 71-78. doi:10.1519/ssc.0000000000000193 Takeda, T., Itoi, O., Takagi, H., & Tsubakimoto, S. (2014). Kinematic analysis of the
backstroke start: differences between backstroke specialists and non-specialists.
Journal of Sports Sciences, 32(7), 635-641. doi:10.1080/02640414.2013.845678 Thanopoulos, V., Rozi, G., Okicic, T., Dopsaj, M., Jorgic, B., Madic, D., . . . Batis, E.
(2012). Differences in the efficiency between the grab and track starts for both genders in greek young swimmers. J Hum Kinet, 32, 43-51. doi:10.2478/v10078-012-0022-8
Tor, E., Pease, D. L., & Ball, K. A. (2015). How does drag affect the underwater phase of a swimming start? J Appl Biomech, 31(1), 8-12. doi:10.1123/jab.2014-0081 Van Hooren, B., & Bosch, F. (2016). Influence of Muscle Slack on High-Intensity Sport
Performance. Strength and Conditioning Journal, 38(5), 75-87. doi:10.1519/ssc.0000000000000251
Van Soest, A. J., Bobbert, M. F., & Van Ingen Schenau, G. J. (1994). A control strategy for the execution of explosive movements from varying starting positions. J Neurophysiol, 71(4), 1390-1402. doi:10.1152/jn.1994.71.4.1390
Winter, D. A. (2005a). Chapter 2: Kinematics. In D. A. Winter (Ed.), Biomechanics and Motor Control of Human Movement (3 ed.). Hoboken: John Wiley & Sons, Inc. Winter, D. A. (2005b). Chapter 9: Kinesiological Electromyography. In D. A. Winter
Appendices
Curriculum Vitae
Name: Gordon Barkwell
Post-secondary Education and Degrees:
the University of Western Ontario London, Ontario, Canada
2012-2016 B.Sc.
the University of Western Ontario London, Ontario, Canada
2016-2018 M.Sc.
Honours and Awards:
Dean’s Honour List 2015-2016
CIS Academic All-Canadian 2015-2017
Western Graduate Research Scholarship 2016-2018
Ontario Graduate Scholarship 2017-2018
Related Work Experience:
Graduate Teaching Assistant the University of Western Ontario 2016-2017
Publications:
Barkwell, G. E., & Dickey, J. P. (2017). Backstroke start performance: the impact of
using the Omega OBL2 backstroke ledge. Sports Biomechanics, In Press: 1-13. doi:10.1080/14763141.2017.1353130