SHAPE OPTIMIZATION USING GENETIC
ALGORITHMS AND LASER BEAM PROPAGATION FOR THE DETERMINATION OF THE DIFFUSION COEFFICIENT IN A HOT TURBULENT JET OF AIR
E. Ngo Nyobe and E. Pemha
Applied Mechanics Laboratory Faculty of Science
University of Yaound´e I
P.O. Box 7389, Yaound´e, Cameroon
Abstract—The paper describes the propagation of a thin laser beam which passes through a hot turbulent jet, perpendicularly to the flow direction, using geometrical optics approximation. From the modelling of the random propagation direction of the laser beam along its whole path, the diffusion coefficient of the turbulent jet is determined by means of a shape optimization technique in which a genetic algorithm is used. The results obtained from the GA are then improved by the Golden Section method.
1. INTRODUCTION
The problem of laser beam propagation through turbulent jets is a very complex phenomenon which in general, includes refractions effects, diffractions effects, polarisation and backscattering effects, of the transmitted light wave. Because of a lot of modern applications of that problem in laser based-systems, many theoretical studies [1– 3] and experimental investigations [4–7] of wave propagation through random media have been done in recent years.
In this paper, we are concerned with a thin laser beam, having initial diameter a= 0.8 mm, incident wavelength λ0 = 6328 A, which propagates through a hot turbulent jet, created from a rectangular nozzle, according to the experimental conditions already described by Pemha, Gay and Tailland in [8], and by Ngo Nyobe and Pemha in [9]. The mean propagation direction is defined along the x
mean temperature, the mean speed of the flow, and the rms of the temperature fluctuations remain constant and are respectively equal to 50◦C, 8 m/s and 2.75◦C, except in a short area at both borders of the airstream. The thermic turbulence in the hot jet induces random fluctuations of the refractive index which causes random deflections of the laser beam propagation direction, generates random phase modulations of the laser beam wavefront and creates random fluctuations of the light wave amplitude.
The problem of laser beam propagation through turbulent jets is equivalent to the geometrical walk process of the laser beam if refraction effects are more important than diffraction effects, that is, if the geometrical optics approximation is valid. It is well-known that [1–3], in that case, the following four conditions are required:
- The incident wavelength λ0 of the optical radiation must be very small, compared to the inner scale l0 of the turbulent inhomogeneities in the hot jet.
- The whole path distance X traversed by the laser beam must be very great, compared to the outer scale L0 of the turbulent inhomogeneities.
- The size of the first Fresnel zone √λ0X must be smaller than the inner scalel0.
- The laser beam intensity fluctuations must be neglected.
It is proved [9] that the above conditions are rigorously satisfied in the jet considered. Then, the present work is done using the geometrical optics approximation, and this paper is devoted to the study of the laser beam propagation direction through the turbulent airstream.
Ifτ represents the unit vector tangent to the laser ray trajectory,
sis the arc length of the laser ray curve, the well-known ray equation leads to the following form [1–3, 8]:
d(nτ)
ds =gradµ (1)
whereµdenotes the fluctuations of the refractive index n.
By integrating equation (1) along the length σ of a small path traversed by the ray and supposed to be large compared to the correlation distance of the refractive index fluctuations, we obtain:
σ
0
and using the fact that the deflection of the ray along the path σ is small, it can be shown [1, 8] that the variance of ε is related to σ by the following equation:
ε2 = 4D
µσ/n2 (3)
where n2 is the mean value of the refractive index, Dµ is a quantity called the diffusion coefficient of the jet and defined as [1, 8, 9]:
Dµ=− µ2
2
∞
0
∆Rµ(r,0,0)dr (4) Rµ being the correlation coefficient of the refractive index fluctuations and ∆ the Laplacian operator.
In the previous works [8] done under the same experimental conditions, the experimental value of the diffusion coefficient for the turbulent jet considered has been deduced (Dµ= 2.20×10⁻⁹m−1) from
the measurements of Gagnaire and Tailland [10], which were obtained by means of the well-known cold wire anemometer technique [11]. Moreover, by using the propagation of a thin laser beam through the hot turbulent jet, Pemha, Gay, and Tailland [8] have obtained the value
Dµ = 2.98×10⁻⁹m−1. This value presents a great difference (35%)
with respect to the experimental value deduced from [10].
The purpose of the present work is to improve the technique of measurement of the diffusion coefficient used in [8], by means of genetic algorithms.
2. THE MARKOV PROCESS MODEL AND THE
MODELLING OF THE LASER BEAM PROPAGATION DIRECTION
At any position reached by the laser beam during its random propagation, its direction can be characterized by φ and θ which respectively represents the polar and azimuthal angles. We assume that the propagation of the laser beam in a turbulent jet can be regarded as a continuous Markov process in which the role of the time is played by the path length σ traversed by the laser beam. The beam angle deflection being small, we can approximate σ by the x
coordinate along the initial incident direction of the beam. Therefore, the probability P(φ, θ, σ) for the laser beam to have the direction defined by the polar and azimuthal anglesφandθafter going a distance
Kolmogorov (EFPK) equation [1, 8] : ∂P ∂x = Dµ sinθ ∂ ∂θ
sinθ∂P ∂θ
+ Dµ sin2θ
∂2P
∂φ2 (5)
with the initial condition:
P(φ, θ, x= 0) =δ(φ)δ(θ−π/2) (6) where δ denotes the Dirac distribution, φ = 0 and θ = π/2 are the angles of the beam direction before entering into the jet.
In the previous works done by Pemha, Gay and Tailland [8], the Equation (5) was solved by using a numerical method model in which the angular discretization steps are supposed to be constant. This assumption leads to the conclusion that the laser beam propagation direction remains constant and depends only on two points which are the entering point of the laser beam, and the beam impact position at the outlet observation plane x = X. Although this hypothesis gives good results about the order of magnitude of the jet diffusion coefficient and that of the outer scaleL0 of the turbulent inhomogeneities, it does not hold in reality and is in contradiction with the geometrical optics approximation. In order to take into account the fact that the laser beam propagation direction is a turbulent function of the propagation distance x, the polar and azimuthal angles of the beam direction are defined in terms of the Fourier series expansions which depend on the propagation distance. Then, using the initial incident direction (φ= 0, θ=π/2) of the laser beam and its final direction (φX(x1, x2),
θX(x1, x2)), that is, its direction when it reaches the outlet plane, we propose in this paper, the following relations which characterize the modelling of the laser beam direction of propagation:
φ(x1, x2, x) = φX(x1, x2)
1−α N
n=0
ansin
2nπx X
+bncos
2nπx
X (7a)
θ(x1, x2, x) =
π
2 +
θX(x1, x2)−
π
2
1−α N n=0 cnsin
2nπx X
+dncos
2nπx
X (7b)
the order of magnitude of the two Fourier series, such that the values of φ(x1, x2, x) and θ(x1, x2, x) remain reasonable for any distance of propagationx, we have introduced the parameter α in the modelling relations (7).
Those relations must verify the final boundary conditions on the outlet plane x=X, written as follows:
φ(x1, x2, x=X) = φX(x1, x2) (8a)
θ(x1, x2, x=X) = θX(x1, x2) (8b) The above conditions lead to the following constraints for the spectral coefficients (an), (bn), (cn) and (dn):
N
n=0
bncos(2nπ) =
N
n=0
dncos(2nπ) = 0 (9)
For solving Equation (5) with the initial conditions (6), we have applied a numerical explicit discretization scheme with alternating directions and used the Fourier spectral model mentioned above. Thus, we have determined the probabilities P(x1, x2, x, Dµ) of the beam
impact positions on any plane (x1,x2) placed at a distancexfrom the beam entering point. The above numerical scheme enables to calculate the probabilitiesP(x1,x2,x=X,Dµ) which correspond to the outlet
plane x=X. In addition, the values W(x1,x2) of those probabilities have already been measured by our team, using an experimental set up described in [8, 9].
3. THE GENETIC ALGORITHM APPROACH
By adjusting our numerical solution P(x1, x2, X, Dµ) to agree with
the experimental resultsW(x1,x2), a cost function J is defined as :
J =
[P(x1, x2, x=X, Dµ)−W(x1, x2)]2dx1dx2
A shape optimization with genetic algorithms is then proposed and enables to calculate the diffusion coefficient of the jet, defined as the global minimum of the above cost function. The genetic algorithm approach is recommended for minimizingJ because the cost functionJ
depends on a lot of parameters which are of different types (α, diffusion coefficient and Fourier spectral coefficients), and are related to J by an unknown link in which differentiability can not be assumed.
are widely used for non-differentiable function minimizations, that is, for numerical optimization problems in which gradient-based methods are failed. Their foundation is inspired by the functioning of natural systems, according to Darwin’s theory on evolution, which states that the most fit members in a population have higher chances of successful reproduction, that is, higher chances of surviving [14–18]. A genetic algorithm works with the same number of individuals which are coded as strings of genes, having the same number of bits; each individual represents a set of the design variables, which allows the association of different types of variables.
If the optimization technique in this paper needs N Fourier spectral coefficients for each set of variables (an), (bn), (cn), (dn), the
design variables are defined as the following array: ((an), (bn), (cn),
(dn), α, Dµ) constituted by a vector of 4N + 2 real parameters. For
each parameter, we have used a binary code based on a parameter approximation scheme which uses the upper (ru) and lower (rl) values
of each parameter, and defines the following set of discretized values:
ri = rl +i(∆r) with: i = 0, . . . , Nr and ∆r = (ru−rl)/Nr. So,
there exists a unique correspondence between each valueri of a given parameterr and the integer isuch that codingri means coding i.
A simple genetic algorithm is composed of the following six operations [14–18]: Initialization, evaluation, selection or reproduction, crossover, mutation, construction of a new generation. Those operations can be detailed as follows:
1) Initialization: The population of the first generation is randomly initialized with a constant number of individuals, each individual being represented by its string of genes.
2) Evaluation: the fitness value of every individual is evaluated. This fitness function F must remain positive and is constructed from the cost functionJ such that the minimization of J is equivalent to the maximization ofF.
3) Selection or reproduction: individual strings are selected according to their fitness values, that is, the probability for a string of genes to be reproduced is all the more great as the fitness value of the string is high. This operation does not change the number of individuals constituting the population.
5) Mutation: It plays a secondary role in the simple genetic algorithm and is defined as the bit change which can randomly occur in a given string at a mutation rate. This rate must be very small, compared to the crossover rate.
6) New generation: after crossover and mutation operations, a new population is then formed and undergoes the step 2. Before performing this iteration, an elitist strategy is applied and ensures that the best individual is always selected.
There exist various criteria for ending the work of the genetic algorithm [14–18]. In this paper, we have used the criterion which consists to perform the genetic algorithm during a number of generations arbitrarily defined. Usually, one hope that the genetic algorithm will converge before reaching the final generation and that the best individual at the final generation could constitute the solution of the problem, that is, the global minimum of the cost function. 4. RESULTS
The number of discretization steps along thexaxis is chosen to be equal to the numberN of Fourier spectral coefficients. Initially, this number is assumed to be very great (N = 500). The genetic algorithm is then performed for 300 generations for a population of 100 individuals, with crossover rate = 0.70, mutation rate = 0.02. In Figure 1(a), is presented the convergence process of the genetic algorithm in which it is shown that the optimal value obtained for the diffusion coefficient is:
Dµ = 2.298142717497557×10⁻⁹m−1, that is,Dµ= 2.30×10⁻⁹m−1.
Figure 1(b) presents the successive values of the minimum of the cost function J, plotted as function of the generation number, for the following values of the GA parameters: probability of crossover = 0.60, probability of mutation = 0.03, population size = 50. By taking another group of those parameters such that their values verify Goldberg’s recommendations [15] (for example: probability of crossover = 0.60, probability of mutation = 0.04, population size = 75), the behavior of the above figures does not considerably change and all the curves we have obtained are nearly identical.
0 50 100 150 200 250 300 1.95
2 2.05 2.1 2.15 2.2 2.25 2.3
2.35x 10⁻⁹ Optimal diffusion coefficient (m -1)
Generation number
0 50 100 150 200 250 300
4.7 4.8 4.9
5x 10⁻⁴
generation number Minimum of the cost function
4.6
4.5
(a) (b)
Figure 1. Convergence process of the genetic algorithm: (a) values of the optimal diffusion coefficient as function of the generation number, (b) values of the minimum of the cost function as function of the generation number.
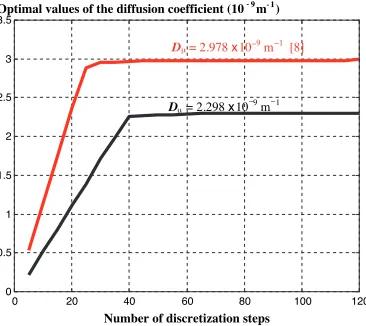
D = 2.978 x 10⁹ m1
= 2.298 x 10⁹ m1
[8]
D
0 20 40 60 80 100 120
0 0.5 1 1.5 2 2.5 3 3.5
Optimal values of the diffusion coefficient (10 9m1)
Number of discretization steps
-
-µ
µ
− −
− −
Figure 2. Optimal values of the diffusion coefficient as function of number of discretization steps.
is compared to the analogous curved obtained in [8]. Hence we have found that the total number 4×75 parameters (that is N = 75) for the complete array of Fourier coefficients are sufficient for obtaining the convergence of the Fourier series expansion and the stability of our numerical schemes.
(Pemha, Gay and Tailland [8]) (D = 2.98 x 10⁻⁹
m-1 )
New method of measurement (D = 2.27 x 10⁻⁹
m-1 )
2 2.2 2.4 2.6 2.8 3 3.2
8x 10⁻⁴
3.4 4.5
5 5.5 6 6.5 7 7.5
Cost function
diffusion coefficient (10-9 m-1) µ
µ
Figure 3. Variations ofJ as function ofDµin the neighbouring of its
minimum. Comparison with the results obtained in [8].
Fourier spectral coefficients and the parameter α remaining equal to their optimal values, the result derived from the genetic algorithm is improved by applying the golden section algorithm on the cost function J, which depends only on the parameter Dµ in that case. The final global minimum for the cost function is then obtained:
Dµ = 2.275235449856795×10⁻⁹m−1, that is,Dµ= 2.27×10⁻⁹m−1. This value corresponds to a minimum of J which is smaller than the previous minimum ofJ obtained in [8]. In Figure 3, are presented two curves which enable to compare the variations of the cost function J
near its minimum with the results ofJ obtained in [8]. 5. CONCLUSION
Genetic Algorithms and Turbulence are two interesting topics which have already been coupled in previous works, notably for solving applied optimization problems related to the solidification of thermosolutal flows, as those encountered in metallurgy and manufacturing processes [19–23].
This paper describes the possibility of connecting that coupling with optical diagnostic techniques used for experiments in turbulent flows.
By using a shape optimization technique with genetic algorithms and laser beam propagation, we have determined the value of the diffusion coefficient of a hot turbulent jet (Dµ= 2.27×10⁻⁹ m−1). The
method of measurement that we have described in this paper improves the optical technique previously used in [8], where the value derived is:
The validity of our method can be satisfactorily proved because our result is nearly equal to the experimental value obtained from [10] by means of the cold wire anemometer technique, that is, Dµ =
2.20×10⁻⁹m−1.
ACKNOWLEDGMENT
The authors would like to thank Emeritus Professor GAY Bernard for his help about Genetic Algorithms.
REFERENCES
1. Chernov, L. A., Wave Propagation in a Random Medium, McGraw-Hill, New York, 1960.
2. Tatarskii, V. I., Wave Propagation in a Turbulent Medium, McGraw-Hill, New York, 1961.
3. Ishimaru, A.,Wave Propagation and Scattering in Random Media, 1 and 2, Academic Press, New York, 1978.
4. Joia, I. A., B. J. Uscinski, R. J. Perkins, G. Balmer, D. Jordan, and E. Jakeman, “Intensity fluctuations in a laser beam due to propagation through a plane turbulent jet,” Waves in Random Media, Vol. 7, No. 2, 169–181, 1997.
5. Ivanova, I. V., D. I. Dimitriev, and V. S. Sirazetdinov, “Proba-bility density of intensity fluctuations for laser beams disturbed by turbulent aero-engine exhaust,”Lasers for Measurements and Information Transfer, Proceedings of SPIE, Vol. 6594, 2007. 6. Sjoqvist, L., O. Gustafson, and M. Henrikson, “Laser beam
propagation in close vicinity to a downscaled jet engine exhaust,”
Technologies for Optical Countermeasures, SPIE Proceedings,
Vol. 5615, 137–148, 2004.
7. Titterton, D. H., “A review of optical countermeasures,” Proceed-ings SPIE Conference on Technologies for Optical Countermea-sures, Vol. 5615, 1–15, London, 2004.
8. Pemha, E., B. Gay, and A. Tailland, “Measurement of the diffusion coefficient in a heated plane airstream,” Physics of Fluids A, Vol. 5, No. 6, 1993.
10. Gagnaire, A. and A. Tailland, “Interferometrical setup for study of thermic turbulence in a plane airstream,”SPIE Proceedings of the 1st European Congress on Optics Applied to Metrology, Vol. 138, 69–73, Bellingham, Washington, 1977.
11. Comte-Bellot, G., “Hot-wire anemometry,” Annual Review of Fluid Mechanics, Vol. 8, 1976.
12. Levine, B., Fondements Th´eoriques de la Radiotechnique Statistique, Editions MIR, Vol. 1, Moscou, 1973.
13. Blanc-Lapierre, A. and R. Fortet, Th´eorie des Fonctions Al´eatoires, Masson, Paris, 1953.
14. Holland, J., Adaptation in Natural and Artificial Systems, University of Michigan Press, Ann Arbor, 1975.
15. Goldberg, D. E.,Genetic Algorithms in Search, Optimization and Machine Learning, Addison-Wesley, Reading, MA, 1989.
16. Davis, L., Handbook of Genetic Algorithms, Van Nostrand Reinhold, New York, 1990.
17. Michalewicz, Z., Genetic Algorithms + Data Structures = Evolution Programs, Springer-Verlag, 1992.
18. Renders, J. M., Algorithmes g´en´etiques et R´eseaux de Neurones, Hermes Science Publication, Paris, 1995.
19. Colaco, M. J. and G. S. Dulikravich, “Solidification of double-diffusive flows using thermo-magneto hydrodynamics and optimization,” Materials and Manufacturing Processes, Vol. 22, No. 5, 2007.
20. Kumar, A., S. Chakraborty, and N. Chakraborti, “Fluid flow in a tundish optimized through genetic algorithms,” Steel Research International, Vol. 78, No. 7, 2007.
21. Kumar, A., D. Sahoo, S. Chakraborty, and N. Chakraborti, “Gas injection in steelmaking vessels: Coupling a fluid dynamic analysis with a genetic algorithms-based pareto-optimality,”Materials and Manufacturing Processes, Vol. 20, No. 3, 2005.
22. Colaco, M. J., G. S. Dulikravich, and T. J. Martin, “Optimization of wall electrodes for electro-hydrodynamic control of natural convection during solidification,” Materials and Manufacturing Processes, Vol. 19, No. 4, 2004.
![Figure 3. Variations of J as function of Dµ in the neighbouring of itsminimum. Comparison with the results obtained in [8].](https://thumb-us.123doks.com/thumbv2/123dok_us/1907533.1249922/9.612.181.342.100.236/figure-variations-function-neighbouring-itsminimum-comparison-results-obtained.webp)