Scholarship@Western
Scholarship@Western
Electronic Thesis and Dissertation Repository
6-10-2019 9:00 AM
Structural Optimization of Cable-Stayed Bridges Considering the
Structural Optimization of Cable-Stayed Bridges Considering the
Action of Permanent and Transitory Loads
Action of Permanent and Transitory Loads
Carolina Almeida Novaes dos Santos The University of Western Ontario
Supervisor
El Damatty, Ashraf
The University of Western Ontario Joint Supervisor Pfeil, Michele S.
Federal University of Rio de Janeiro, Brazil
Graduate Program in Civil and Environmental Engineering
A thesis submitted in partial fulfillment of the requirements for the degree in Doctor of Philosophy
© Carolina Almeida Novaes dos Santos 2019
Follow this and additional works at: https://ir.lib.uwo.ca/etd
Part of the Civil Engineering Commons
Recommended Citation Recommended Citation
Almeida Novaes dos Santos, Carolina, "Structural Optimization of Cable-Stayed Bridges Considering the Action of Permanent and Transitory Loads" (2019). Electronic Thesis and Dissertation Repository. 6505.
https://ir.lib.uwo.ca/etd/6505
This Dissertation/Thesis is brought to you for free and open access by Scholarship@Western. It has been accepted for inclusion in Electronic Thesis and Dissertation Repository by an authorized administrator of
iii
Cable-stayed bridges are complex structures with several advantages such as aesthetical
appeal, economic use of materials, and efficient construction method. Due to these
advantages and the extensive knowledge gained from projects over the years, longer
cable-stayed bridges are being constructed. As span lengths increase, structures become more
flexible, which makes the accurate evaluation of wind loads critically important in the
design of cable-stayed bridges. A large number of variables are involved in the design of
cable-stayed bridges. Those include overall geometric dimensions, cross-sectional
dimensions, number of stay-cables and pre-tensioning forces to be applied to the cables.
Taking all variables into account, and considering the need to conduct multiple moving
load analyses and to calculate accurately aerodynamic wind forces, a design optimization
process for such bridges becomes challenging. In this thesis, a numerical model capable of
achieving this design optimization task is developed. The numerical model uses a structural
system in which the deck is composite steel-concrete with two I main girder. The developed
numerical model is based on the Finite Element Method (FEM), the Real Coded Genetic
Algorithm (RCGA), and the Discrete-Phases Design Approach. The latter classifies
variables into two categories: (i) main variables: number of stay-cables, I-girder inertia,
concrete slab thickness, tower cross-section external dimensions, tower height above the
deck; (ii) secondary variables: I-girder dimensions, stay-cable areas and pre-tensioning
forces. The main variables are design variables optimized directly by the RCGA, while the
secondary variables are indirectly optimized by the discrete phases. Buffeting wind loads
are considered as equivalent static forces, which were validated through a
theoretical-experimental correlation. This powerful tool is used to assess the importance of considering
truck versus lane loads, as well as wind buffeting loads and various aeroelastic instabilities
in the design optimization process. Results show that the most critical load combination
include the wind effect, and that the critical wind velocities of aeroelastic phenomena play
iv
Keywords
Cable-stayed Bridge, Composite Deck, Finite Element Method, Real Coded Genetic
Algorithm, Pre-tensioning Forces, Live Loads, Buffeting Wind Loads, Critical velocities
v
Co-Authorship Statement
This thesis has been prepared in accordance with the regulation for an Integrated-Article
format thesis stipulated by the School of Graduate and Postdoctoral Studies at the
University of Western Ontario and has been co-authored as:
Chapter 2: Structural optimization of two I-girder composite cable-stayed bridges
under the action of dead and live loads
The analyzes were conducted by C.A.N. Santos under supervision of A.A. El Damatty and
M.S. Pfeil. Drafts of Chapter 2 were written by C.A.N. Santos and modifications were done
under supervision of A.A. El Damatty, M.S. Pfeil and R.C. Battista. A version of this work
co-authored by C.A.N. Santos, A.A. El Damatty, M.S. Pfeil and R.C. Battista was
submitted to the Canadian Journal of Civil Engineering and currently is under revisions.
Chapter 3: Comparison between the theoretical and experimental wind responses of
a full aeroelastic model test of a cable-stayed bridge
The analyzes were conducted by C.A.N. Santos under supervision of A.A. El Damatty and
M.S. Pfeil. Drafts of Chapter 3 were written by C.A.N. Santos and modifications were done
under supervision of A.A. El Damatty and M.S. Pfeil. A preliminary version of this work
co-authored by C.A.N. Santos, A.A. El Damatty and M.S. Pfeil was presented by C.A.N.
Santos at the 4th American Association for Wind Engineering Workshop, Miami - USA,
2016.
Chapter 4: Structural optimization of two I-girder composite cable-stayed bridges
under the action of dead, live and wind loads
The analyzes were conducted by C.A.N. Santos under supervision of A.A. El Damatty and
M.S. Pfeil. Drafts of Chapter 4 were written by C.A.N. Santos and modifications were done
vi
by C.A.N. Santos, A.A. El Damatty and M.S. Pfeil will be submitted to the journal
vii
Dedication
viii
Acknowledgments
I would like to express my gratitude to my research supervisors Dr. El Damatty and Dr.
Michele Pfeil for their dedication, valuable guidance and willingness to share their
knowledge along these years.
I wish to acknowledge the National Council for Scientific and Technological Development (CNPq),
Brazil for the financial support; and Compute Canada for its supercomputer facility.
I would also like to express my appreciation to my colleagues and staff that have helped
me through my thesis research.
A special thanks to my family, outstandingly to my mother and brother, for all their
unconditional support.
At last but not the least, I want to thank my husband for his kind words and constant
ix
Table of Contents
Abstract ... iii
Co-Authorship Statement... v
Dedication ... vii
Acknowledgments... viii
Table of Contents ... ix
List of Tables ... xiii
List of Figures ... xv
List of Symbols ... xx
List of Appendices ... xxiv
Chapter 1 ... 1
1 Introduction ... 1
1.1 Cable-stayed bridges ... 1
1.1.1 A brief history ... 1
1.1.2 Structural system ... 3
1.1.3 Structural components ... 4
1.1.4 Main characteristics ... 9
1.2 Optimization of cable-stayed bridges ... 11
1.2.1 Significance... 11
1.2.2 Literature review ... 12
1.3 Research Objectives ... 22
1.3.1 Methodology and Relevance... 23
1.3.2 Organization of the Thesis ... 24
References ... 26
x
2 Structural optimization of two I-girder composite cable-stayed bridges under the
action of dead and live loads ... 29
2.1 Introduction ... 29
2.2 Description of numerical tool ... 32
2.2.1 Optimization procedure ... 36
2.2.2 Case study ... 43
2.2.3 Numerical results for design Objective-1 considering dead load and truck plus lane live load ... 46
2.2.4 Numerical results for design Objective-1 considering dead load and lane live load ... 51
2.2.5 Numerical results for design Objective-1 considering dead load only ... 52
2.2.6 Numerical results for design Objective-2 ... 54
2.2.7 Comparison of costs from Objective-1 and Objective-2 considering dead load and truck plus lane live load ... 61
2.3 Validation of the discrete phases design approach ... 63
2.4 Conclusions ... 65
References ... 67
Chapter 3 ... 69
3 Comparison between the theoretical and experimental wind responses of a full aeroelastic model test of a cable-stayed bridge ... 69
3.1 Introduction ... 69
3.2 Wind loads and bridge responses ... 70
3.3 Methodology ... 77
3.4 Case study ... 78
3.4.1 Theoretical approach ... 80
3.4.2 Experimental Approach ... 84
xi
3.5 Conclusions ... 90
References ... 92
Chapter 4 ... 94
4 Structural optimization of two I-girder composite cable-stayed bridges under the action of dead, live and wind loads ... 94
4.1 Introduction ... 94
4.2 Description of numerical tool ... 97
4.2.1 Design variables ... 97
4.2.2 Design constraints ... 99
4.2.3 Objective function ... 103
4.2.4 Finite element model... 104
4.2.5 Design methodology ... 105
4.2.6 Optimization technique ... 109
4.2.7 Cable-stayed bridge optimum design algorithm ... 111
4.3 Case of study ... 112
4.3.1 Cable-stayed bridge optimum design algorithm ... 112
4.3.2 Results and Discussion ... 115
4.4 Conclusions ... 122
References ... 124
Chapter 5 ... 128
5 Conclusions and Recommendations ... 128
5.1 Structural optimization of two I-girder composite cable-stayed bridges under the action of dead and live loads ... 129
5.2 Comparison between the theoretical and experimental wind responses of a full aeroelastic model test of a cable-stayed bridge... 131
xii
5.4 Recommendations for future research ... 133
Appendices ... 135
Appendix A: Examples of cable-stayed bridges constructed in the last 40 years. ... 135
Appendix B: I-girder dimensions for width-to-thickness limit ratio of Class 3 in order to minimize the cross-section area. ... 137
Appendix C: I-girder dimensions for width-to-thickness limit ratio of Class 2 in order to minimize the cross-section area. ... 138
Appendix D: Finite element modelling of concrete-steel composite two I-girders deck ... 139
Appendix E: Aerodynamic coefficients and flutter derivatives ... 140
xiii
List of Tables
Table 1. 1: Record main spans for cable-stayed bridges (Svensson, 2012; Pedro & Reis,
2016). ... 7
Table 1. 2: Relation between main span length and cross-section material and geometry. 9
Table 2. 1: Material properties and costs used in the study. ... 45
Table 2. 2: Lower and upper bounds of the design variables. ... 46
Table 2. 3: Deck masses obtained for Objective-1 normalized by the minimum mass. ... 47
Table 2. 4: Deck mass ratio (DL + lane LL)/(DL + truck and lane LL) obtained for
Objective-1. ... 52
Table 2. 5: Deck mass ratio (DL)/(DL + truck and lane LL) obtained for Objective-1. ... 53
Table 2. 6: Design variables obtained for the considered case study. ... 55
Table 2. 7: Constraint values (Equations 2.7 to 2.18) obtained for the considered case
study. ... 55
Table 2. 8: Maximum longitudinal displacements at the top of towers (SLS). ... 56
Table 2. 9: Material costs for the optimal solutions with miminum deck mass (TL1=6m
and TL2=3m). ... 61
Table 2. 10: Comparison of material costs for Objective-1(Hb=30m, Ha=50m, TL1=3.0m,
and TL2=1.5m) and Objective-2 (Hb=30m) optimal solutions in London-ON. ... 62
Table 2. 11: Comparison of material costs for Objective-1(Hb=30m, Ha=40m, TL1=3.0m,
and TL2=1.5m) and Objective-2 (Hb=30m) optimal solutions in North Bay-ON. ... 62
Table 2. 12: Comparison of material costs and design variables for validation of the
xiv
Table 3. 1: Geometric properties of the structural elements. ... 80
Table 3. 2: Frequencies and mode shapes. ... 81
Table 3. 3: Aerodynamic coefficients and theirs slopes for a wind attack of 0º. ... 81
Table 4. 1: Design variables: lower and upper bounds. ... 113
Table 4. 2: Hourly mean basic wind velocities adapted from CAN/CSA-S6-14. ... 114
Table 4. 3: Main cases of analysis. ... 114
Table 4. 4:: Load factor combinations. ... 114
Table 4. 5: Deck limiting design constraint and material cost for cases A1, B1 and C1.118 Table 4. 6: Design variables, frequencies and damping ratios for optimized cable-stayed bridges considering critical wind velocity V0,2. ... 121
Table A. 1: Concrete cross-section cable-stayed bridges (Svensson, 2012). ... 135
Table A. 2: Steel cross-section cable-stayed bridges (Svensson, 2012). ... 135
xv
List of Figures
Figure 1. 1: First bridges designed, but not constructed, with the concept of cable-stayed
bridge: (a) Bridge designed by Verantius in 1617 (Verantius, 1617 apud Svensson, 2012);
(b) Bridge designed by Löscher in 1784 (Löscher, 1784 apud Svensson, 2012). ... 2
Figure 1. 2: First proven constructed cables-stayed bridge: Kings Meadow Bridge, 1817
(Stephenson, 1821 apud Svensson, 2012)... 2
Figure 1. 3: First modern cable-stayed bridge: Strömsund, 1956 (Wenk, 1954 and Ernst,
1956 apud Svensson, 2012). ... 3
Figure 1. 4: Flow of forces in a cable-stayed bridge (Svensson, 2012). ... 4
Figure 1. 5: Longitudinal cable arrangement systems (Svensson, 2012). ... 5
Figure 1. 6: Tower shapes for (a) double-plane and (b) single-plane cable arrangements
(Svensson, 2012). ... 6
Figure 1. 7: Concrete cross-sections: (a) thin concrete beams (Koppel, 1984 apud Svensson,
2012); (b) 2 concrete girders (Leonhardt, 1980 apud Svensson, 2012); (c) box girder
(Battista, 2011). ... 8
Figure 1. 8: Composite steel-concrete cross-section: two main plate girders (Battista,
2013). ... 8
Figure 1. 9: Steel cross-section: box girder (You et al., 2008 apud Svensson, 2012); two
box girders (Morgenthal, 2008 apud Svensson, 2012). ... 8
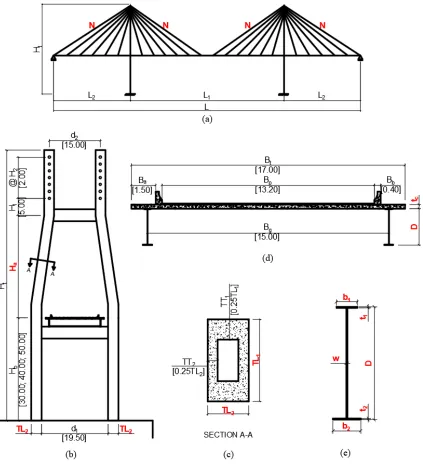
Figure 2. 1: Cable-stayed bridge geometry: (a) longitudinal view; (b) tower dimensions;
(c) tower cross-section; (d) deck cross-section; (e) steel I-girder dimensions. Dimensions
in meter. ... 35
Figure 2. 2: Flow chart for the optimization scheme. ... 37
xvi
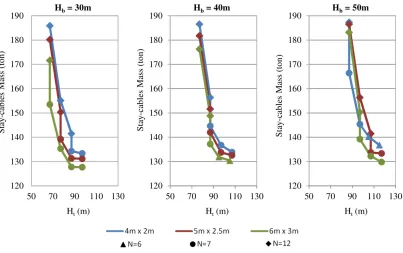
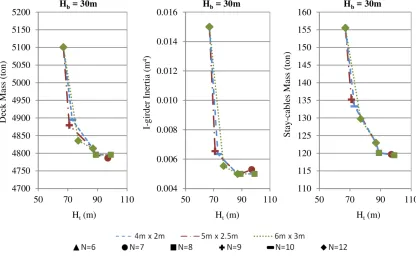
Figure 2. 4: Deck mass due to dead plus live loads as a function of Hb and tower dimensions
TL1 x TL2. ... 48
Figure 2. 5: Steel I-girder inertia about major axis due to dead plus live loads as a function
of Hb and tower dimensions TL1 x TL2. ... 48
Figure 2. 6: Stay-cables mass as a function of Hb and tower dimensions TL1 x TL2. .... 49
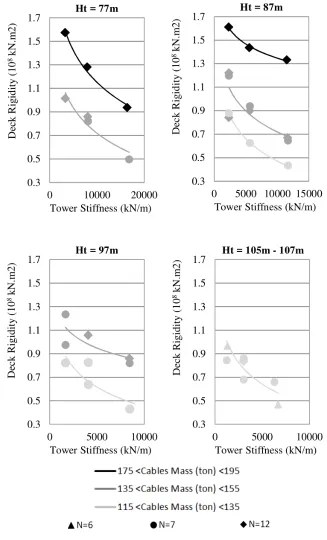
Figure 2. 7: Relation between deck rigidity and tower longitudinal stiffness to obtain
lightest deck mass. ... 50
Figure 2. 8: Deck mass, stay-cables mass, and steel I-girder inertia due to dead and lane
live loads as a function of tower dimensions TL1 x TL2. ... 52
Figure 2. 9: Deck mass, stay-cables mass, and steel I-girder inertia due to dead load as a
function of tower dimensions TL1 x TL2. ... 53
Figure 2. 10: Comparison of material costs for the considered case study. ... 54
Figure 2. 11: Deflections, axial forces, and vertical bending moments at the deck spine due
to dead loads for the considered case study. ... 57
Figure 2. 12: Deflections, axial forces and vertical bending moments at the deck spine due
to dead and live loads for the considered case study. ... 58
Figure 2. 13: Axial forces and longitudinal bending moments in one of the tower’s legs due
to dead loads for the considered case study. ... 59
Figure 2. 14: Axial forces and longitudinal bending moments in one of the tower’s legs due
to dead and live loads for the considered case study. ... 59
Figure 2. 15: Cables areas and pre-tensioning forces for the considered case study. ... 60
Figure 3. 1: Scheme of deck cross-section dimensions, mean and turbulent wind speeds,
xvii
Figure 3. 2: Flowchart of the comparison between theoretical and experimental approaches.
... 77
Figure 3. 3: Bridge geometry, cross-section of the side span, and finite element model of
the cable-stayed bridge. ... 79
Figure 3. 4: Longitudinal turbulence intensity profile and mean wind speed profile obtained
experimentally from the full aeroelastic model test and the ones used in the theoretical
approach. ... 82
Figure 3. 5: Comparison of mean drag displacements: (a) at ½-point of main span; (b) at
¼-point of main span. ... 85
Figure 3. 6: Comparison of mean lift displacements: (a) at ½-point of main span; (b) at
¼-point of main span. ... 86
Figure 3. 7: Comparison of mean rotations: (a) at ½-point of main span; (b) at ¼-point of
main span. ... 86
Figure 3. 8: Comparison of mean lateral displacements at the top of the 1st tower. ... 87
Figure 3. 9: Comparison of peak drag displacements: (a) at ½-point of main span; (b) at
¼-point of main span. ... 88
Figure 3. 10: Comparison of peak lift displacements: (a) at ½-point of main span; (b) at
¼-point of main span. ... 88
Figure 3. 11: Comparison of peak rotations: (a) at ½-point of main span; (b) at ¼-point of
main span. ... 89
Figure 3. 12: Comparison of peak lateral displacements at the top of the 1st tower. ... 89
xviii
Figure 4. 2: Deck mode shapes: (a) 1st symmetric vertical mode; (b) 1st antisymmetric
vertical mode; (c) 1st symmetric lateral mode; (d) 1st antisymmetric lateral mode; (e) 1st
symmetric torsional mode; (f) 1st antisymmetric torsional mode. ... 109
Figure 4. 3: Optimized material cost for distinct load combinations and different basic wind velocities. ... 116
Figure 4. 4: (a) Relation between deck rigidity and tower longitudinal stiffness; (b), (c), (d) proportion of elements material cost for cases of analysis (A1), (B1), and (C1). ... 119
Figure 4. 5: Material total cost optimized for the six main cases of analysis: A1, B1, C1, A2, B2 and C2... 120
Figure B. 1: I-girder depth as a function of the Class3 I-girder inertia. ... 137
Figure B. 2: Bottom flange width as a function of the Class3 I-girder inertia. ... 137
Figure B. 3: Web thickness as a function of the Class3 I-girder inertia. ... 137
Figure C. 1: I-girder depth as a function of the Class3 I-girder inertia. ... 138
Figure C. 2: Bottom flange width as a function of the Class3 I-girder inertia. ... 138
Figure C. 3: Web thickness as a function of the Class3 I-girder inertia. ... 138
Figure D. 1: Finite element modelling of concrete-steel composite two I-girders deck according to Wilson et al. (1991). ... 139
Figure E. 1: Geometry of plate girder section model evaluated by Lin et al. (2005). .... 140
Figure E. 2: Drag coefficients (Lin et al., 2005). ... 140
Figure E. 3: Lift coefficients (Lin et al., 2005). ... 141
Figure E. 4: Torsional coefficients (Lin et al., 2005)... 141
xix
xx
List of Symbols
[m] Influence matrix
{x} vector of design variables
{X} Vector of stay-cables pre-tensioning force corrections
A Steel total cross-section area of stay-cable
A1φ Steel nominal cross-section area for 1 strand
A2* Flutter derivative function of the torsional frequency
B Deck width
b1 Deck I-girder top flange width
b2 Deck I-girder bottom flange width
Cf Factored compressive force at ULS
CFx, CFZ, CMθ Static force coefficients
Ci Constants specified by the design for determining
maximum displacements allowed
Cr Factored compressive resistance
D Deck I-girder depth
, , Slopes of static force coefficients
DL dead load
Ecs Stay-cable effective modulus of elasticity
Eeq Stay-cable equivalent tangent modulus of elasticity
f Frequency of vibration
f* Reduced frequency
′ , Quasi-steady horizontal force (wind direction)
′ , Quasi-steady vertical force
′ , Quasi-steady pitching moment
F{x} Fitness value
FB Breaking force of stay-cable
fB First vertical bending mode frequency
FB,1φ Steel nominal breaking load for 1 strand
fmax Fitness value of the worst feasible solution that has been
observed
fT First torsional bending mode frequency
g Design constraint
xxi
GEN number of generations
H Horizontal projection of the stay-cable
Ha Tower height above the deck level
Hb Tower height below the deck level
Ht Tower total height
| | Mechanical admittance
I Moment of inertia of the deck steel I-girder about its major axis
I Wind longitudinal turbulence intensity
I Wind vertical turbulence intensity
Im Deck mass moment of inertia
Jt Torsional moment of inertia
| | Joint acceptance function
L Total length of the bridge
L1 Main span length
L2 Side span length
LL live load
Turbulence length scale
m Mass per length
M0 Desired bending moments at deck control points
MDL Bending moment at SLS due to dead load
Mf Factored bending moment at ULS
Mfx Factored bending moment at ULS about x-axis
Mfy Factored bending moment at ULS about y-axis
MLL Bending moment at SLS due to live load
Mp
Bending moments at the control points due to dead and superimposed loads obtained from the cable-stayed bridge complete 3D FEM
Mr Factored bending moment resistance
Mrx Factored bending moment resistance about x-axis
Mry Factored bending moment resistance about y-axis
MSL Bending moment at SLS due to superimposed load
N Number of stay-cables in the side spans or in half of the main span, in one plane of cables.
POP number of samples in the population
′ , Mean-square fluctuating generalized horizontal force
xxii
′ , Mean-square fluctuating generalized pitching moment
R Vertical reaction of continuous beam FEM
r Mass of gyration
R!"#!"$ Cross spectrum of forces
S Elastic section modulus of the steel section
S' Elastic section modulus of the steel section and reinforcement within the effective width of the slab
Sc Scruton number
SL superimposed load
Sn, S3n Elastic section modulus of the steel girder and the concrete
slab using a modular ratio n and 3n
%&' ,(
Power spectral density of the fluctuating generalized force in ) direction
%&' ,(
Power spectral density of the fluctuating generalized force in * direction
%&' ,(
Power spectral density of the fluctuating generalized moment about axle
St Strouhal number
% Power spectral density for longitudinal wind velocity
%++ Power spectral density for vertical wind velocity % ",, Power spectral density of displacements in ) direction
% ",, Power spectral density of displacements in * direction
% ",, Power spectral density of rotations about axle
T Stay-cable final pre-tensioning force
T0 Stay-cable initial pre-tensioning force
t1 Deck I-girder top flange thickness
t2 Deck I-girder bottom flange thickness
tc Thickness of concrete slab
Tf Factored axial forces at ULS
Tf,DL+SL Factored axial forces at ULS due to dead and
superimposed loads
Tf,LL Factored axial forces at ULS due to live load
TL1 External dimension of the tower cross-section in the
longitudinal direction
TL2 External dimension of the tower cross-section in the
transverse direction
-. Mean wind speed at the deck height
u(t) Horizontal velocity fluctuation
Ucr,divergence Torsional divergence critical velocity
xxiii Ucr,galloping Galloping critical velocity
Ucr,vortex Vortex shedding excitation critical velocity
Um,k Mean wind velocity for return period TR=k years
U0 Basic wind velocity
Vf Factored shear force at ULS
Vr Factored shear resistance
w Deck I-girder web thickness
w(t) Vertical velocity fluctuation
wcs Weight per unit length of the stay-cable
WL wind load
X Deck transversal direction
Z Deck vertical direction
/0 Roughness length
/̅ Effective height
α Wind tunnel test angle of attack
δDL+SL Displacements at the deck due to dead and superimposed
loads
ΔDL+SL Displacements at the towers due to dead and superimposed
loads
δLL Displacements at the deck due to live load
ΔLL Displacements at the towers due to live load
η Deck longitudinal direction
η' Reduction factor for calculating classical flutter critical velocity
θ Stay-cable horizontal angle of inclination
23 Aerodynamic damping ratio
ξS Structural damping ratio
ρ Air mass density
4 Standard deviation of longitudinal wind velocity fluctuations
4+ Standard deviation of vertical wind velocity fluctuations 4 " ,(, 4 " ,(, 4 " ,( Mean-square value of the equivalent static forces
4 ', 4 ', 4 ',, Mean-square value of fluctuating generalized deflections
4 '5, , 4 '5, , 4 '5, Background mean-square equivalent static forces
4 '6, , 4 '6, , 4 '6, Resonant mean-square equivalent static forces
ϕ Mode shape function
xxiv
List of Appendices
Appendix A: Examples of cable-stayed bridges constructed in the last 40 years. ... 135
Appendix B: I-girder dimensions for width-to-thickness limit ratio of Class 3 in order to
minimize the cross-section area. ... 137
Appendix C: I-girder dimensions for width-to-thickness limit ratio of Class 2 in order to
minimize the cross-section area. ... 138
Appendix D: Finite element modelling of concrete-steel composite two I-girders deck 139
Chapter 1
1
Introduction
1.1 Cable-stayed bridges
1.1.1 A brief history
One of the first projects designed with features that resemble a modern-day cable-stayed
bridge was dated in 1617 and attributed to Faustus Verantius. The bridge consisted of a
timber beam deck suspended by inclined eye bars and a suspended cable in the middle as
shown in Figure 1. 1(a) (Verantius, 1617 apud Svensson, 2012). Over one-hundred and
fifty years later, the concept of considering only inclined stays in a cable-stayed bridge was
developed for the first time by the German carpenter Immanuel Löscher in 1784. As shown
in Figure 1. 1(b), the 44.3m cable-stayed bridge was conceived with all structural members
– deck, stays and towers - constructed with timber. Although the structural designs for
these two projects were completed, neither bridge was fully constructed as originally
planned (Löscher, 1784 apud Svensson, 2012).
In 1817 two Scottish ironworkers, James Redpath and John Brown, designed the first
constructed permanent cable-stayed bridge. The Kings Meadow Bridge was constructed as
a pedestrian walkway over the River Thames with stays made of iron wires (Figure 1. 2),
and partially collapsed in the winter of 1822/1823 (Stephenson, 1821 apud Svensson,
2012). It was later repaired by using an additional number of stays but failed again in 1954
due to flood waters. Also in 1817, John and William Smith constructed the first bridge over
the Tweed River in Scotland. This bridge had similar geometry to the Kings Meadow
Bridge and shared the same fate as serious dynamic problems led to its collapse in 1818
after a thunderstorm (Stephenson, 1821 apud Svensson, 2012).
The accidents and collapses described previously (and many others) were due to the lack
of knowledge of the real behavior of cable-stayed bridges and the availability of adequate
materials to build the structural components. For these reasons, the development of
cable-stayed bridges was slow until the end of World War II when many bridges needed
cable-stayed bridges ideal for many of these projects because they have the advantages of
efficient use of materials and high-speed construction.
The Strömsund Bridge with central span of 182m, designed by the German engineer Franz
Dischinger and constructed in Sweden in 1956, is considered by many authors as the first
modern cable-stayed bridge. Although it contains a concrete roadway, the Strömsund
Bridge is classified as steel bridge (rather than composite) because the concrete slab only
distributes local wheel loads and is not integrated with the main steel girders (Figure 1. 3)
(Wenk, 1954 and Ernst, 1956 apud Svensson, 2012).
(a) (b)
Figure 1. 1: First bridges designed, but not constructed, with the concept of
cable-stayed bridge: (a) Bridge designed by Verantius in 1617 (Verantius, 1617 apud
Svensson, 2012); (b) Bridge designed by Löscher in 1784 (Löscher, 1784 apud
Svensson, 2012).
Figure 1. 2: First proven constructed cables-stayed bridge: Kings Meadow Bridge,
Figure 1. 3: First modern cable-stayed bridge: Strömsund, 1956 (Wenk, 1954 and
Ernst, 1956 apud Svensson, 2012).
1.1.2 Structural system
In a cable-stayed bridge, the deck is supported at numerous points along its length by
pre-tensioning cables, in a way that the beam spans large distances without the need of
intermediary rigid supports.
The flow of forces in a cable-stayed bridge, in the static configuration due to dead loads
and superimposed loads, is detailed in the Figure 1. 4 and shows that stay cables transfer
their forces directly to the deck. The horizontal components are introduced to the deck as
compression forces on the girders achieving maximum value at the position of the tower.
This is explained by the fact that compression forces in the deck produced by the
pre-tensioned cables in the main and side spans act in opposite directions. The vertical
components of the stay cable-forces are upward on the deck anchorages and downward on
Figure 1. 4: Flow of forces in a cable-stayed bridge (Svensson, 2012).
1.1.3 Structural components
When a cable-stayed bridge is chosen to span over an obstacle, there is a vast number of
possible geometric configurations that must be considered. These include, but are not
limited to: (i) cable arrangement; (ii) type of deck cross-section; and (iii) shape of towers.
When these three parameters are defined it is then necessary to determine: (i) number of
cables, their cross-section areas and pre-tensioning forces; (ii) dimensions of the girder;
(iii) thickness of the roadway slab; (iv) height of the towers; and (v) cross-section
dimensions of the tower components. In addition, other parameters must be carefully
adopted such as proportion between the side span and main span that should be selected in
accordance with the terrain topography, width of the deck required for number of traffic
lanes, and the support conditions.
1.1.3.1 Cable arrangement systems
Choosing a small number of stay-cables results in greater forces on the cables and
consequently requires a complex anchorage system and robust beams to span the distance
between anchorage points. A better and lighter structural system is achieved by increasing
the number of stay-cables. This provides a uniform distribution of forces along the deck
and eliminates the need for temporary cables during construction stages (Podolny, 1976).
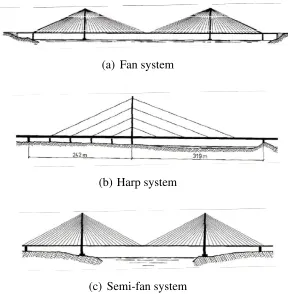
There are three basic types of longitudinal cable arrangements for cable-stayed bridges:
fan systems, harp systems, and semi-fan systems as illustrated in Figure 1. 5. In the fan Bridge Beam
Stay Cable
Load Tower
arrangement system, all the cables are attached to a single point at the top of the towers.
This is not a practical option because damage in one of the cables may destabilize the
structure. For this reason, all cables should have individual anchorage points and be able
to withstand additional forces until the problem is solved. In the harp arrangement system,
cables are parallel and anchored equally spaced to the towers to distribute the forces.
However, this means that increasing the number of cables requires higher towers to
accommodate all anchorages. Finally, the semi-fan arrangement is an intermediate system
between the fan and harp arrangements, that does not present the disadvantages previously
mentioned.
(a) Fan system
(b) Harp system
(c) Semi-fan system
Figure 1. 5: Longitudinal cable arrangement systems (Svensson, 2012).
The transversal cable arrangements can be single-plane or double-plane. In the single plane
arrangement, cables are anchored under the roadway slab dividing it in the middle. This
means they do not have transversal component forces and should only be used with box
beam cross-sections, double-plane arrangements are required to carry additional loads (ex.
loads generated from asymmetric traffic of vehicles).
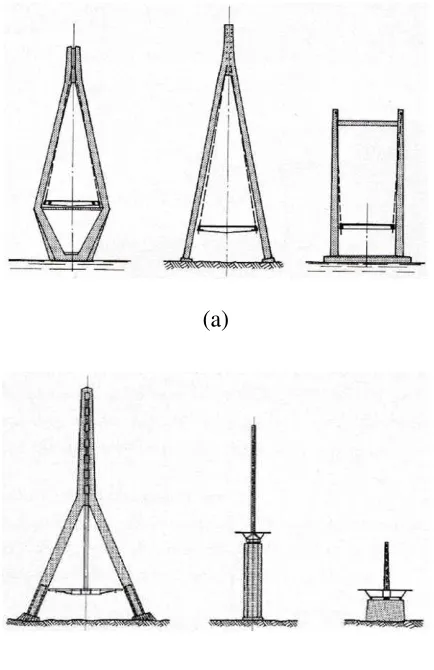
1.1.3.2 Towers
Given that towers are primarily subjected to compression forces, the most common and
economic material to be used for their construction is concrete. The type of tower will
depend mainly on the transversal arrangement systems as illustrated in Figure 1. 6. In
addition, short and medium spans may have towers with vertical legs connected with cross
beams, while long spans should have tower legs connected at the top to increase torsional
rigidity (Podolny, 1976 and Svensson, 2012).
(a)
(b)
Figure 1. 6: Tower shapes for (a) double-plane and (b) single-plane cable
1.1.3.3 Deck cross-sections
Deck cross-sections are classified by the type of material used in the construction: concrete,
steel, and composite steel-concrete (Podolny, 1976). In addition, deck cross-sections may
also be classified as a hybrid deck when the main and side spans have different materials.
In this case, the main span is usually made of steel in order to be lighter in weight, and the
side spans are in concrete and work as a counterweight to provide stability for the main
span. Figure 1. 7 to Figure 1. 9 show some deck cross-section geometries that are used
depending on the type of material.
Besides the geometry, the value of the cable-stayed bridge main span has a direct relation
to the type of material. Svensson (2012) compared deck costs for different main span
lengths and concluded that concrete decks are the most economic for main span under
400m, composite decks for main spans between 400m and 900m, and steel decks for main
spans over 900m. Essentially, concrete decks are for short spans, steel decks are for long
spans and composite steel-concrete are used for intermediate spans. These guidelines are
exemplified by the record of longest main span of cable-stayed bridges (Table 1. 1) with
530m, 616m and 1104m for concrete, composite and steel deck cross-sections,
respectively.
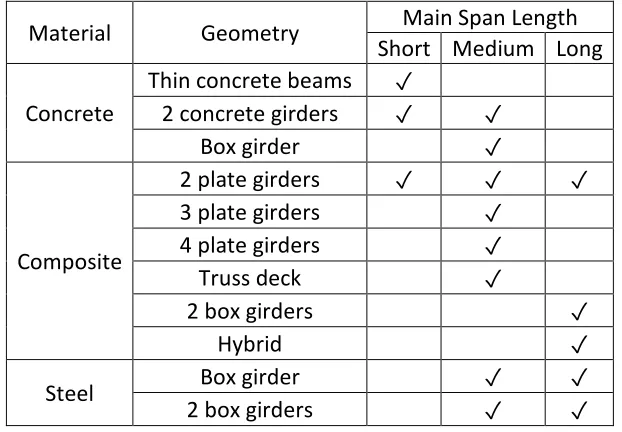
Considering the example of over 40 cable-stayed bridges constructed in the last 40 years,
Table 1. 2 shows the relation between type of cross-section and main span size. To develop
this relation, it was assumed that short and medium main span lengths are under 200m and
450m, respectively, while long spans are over 450m. Importantly, it is necessary to
emphasize that Table 1. 2 represents the most common situations observed in the literature
and so unique cable-stayed bridges would not be covered in these relations. Details of the
bridges used in Table 1. 2 are presented in the Appendix A.
Table 1. 1: Record main spans for cable-stayed bridges (Svensson, 2012; Pedro &
Reis, 2016).
Material Bridge Country Year Main Span (m)
Concrete Skarnsundet Bridge Norway 1991 530
Composite Erqi Yangtze River Bridge China 2011 616
(a) (b)
(c)
Figure 1. 7: Concrete cross-sections: (a) thin concrete beams (Koppel, 1984 apud
Svensson, 2012); (b) 2 concrete girders (Leonhardt, 1980 apud Svensson, 2012); (c)
box girder (Battista, 2011).
Figure 1. 8: Composite steel-concrete cross-section: two main plate girders (Battista,
2013).
(a) (b)
Figure 1. 9: Steel cross-section: box girder (You et al., 2008 apud Svensson, 2012);
Table 1. 2: Relation between main span length and cross-section material and
geometry.
1.1.4 Main characteristics
The main goals in bridge design were listed in the following order of importance by Menn
(1991): structural integrity and resilience, maintenance, economics, and aesthetics. While
structural integrity, resilience, and maintenance are vital requisites for the design project,
the costs and aesthetics are control criteria to define the geometry. In addition, the project
must also consider the topography, geology, span length, clearance, design codes, and
planned routes for the roadway or railway.
After evaluating all the components of a cable-stayed bridge given in Section 1.1.3, as well
as their structural system behavior provided in Section 1.1.2, one may state the following
(Nazmy, 1990; Svensson, 2012; Troitsky, 1988; Podolny, 1976):
Cable-stayed bridges provide an efficient and economical use of materials because: (i) the cables subjected to tension are composed by multi-paralel strands formed by
5 or 7 helical wires of 5mm diameter made of low relaxation high strength steel;
(ii) the towers subjected to compression and bending moments are generally
constructed with reinforced or prestressed concrete; and (iii) there are many
alternative design solutions for the deck cross-section.
Material Geometry Main Span Length
Short Medium Long
Concrete
Thin concrete beams ✓
2 concrete girders ✓ ✓
Box girder ✓
Composite
2 plate girders ✓ ✓ ✓
3 plate girders ✓
4 plate girders ✓
Truss deck ✓
2 box girders ✓
Hybrid ✓
Steel Box girder ✓ ✓
Cable-stayed bridges result in reduced bending moments on the deck because the girders work as a continuous supported beam and due to the flow of loads on the
deck, bending moments along the girders are minimized.
Cable-stayed bridges have an efficient construction method. The balanced cantilever construction method widely used for cable-stayed bridges eliminates the
need for temporary supports because the flow of loads is the same during
construction and in the completed structure. Conversely, temporary supports may
be needed in construction of long span arch bridges which are not stable during
erection and also of suspension bridges.
Cable-stayed bridges have greater stiffness than suspension bridges. This is because the main cables of a suspended bridge find equilibrium by small increases in cable
stress, while cable-stayed bridges always have cables stresses increased
substantially to support the applied load. Consequently, the frequencies of
cable-stayed bridges tend to be higher than suspension bridges.
Cable-stayed bridges have an aesthetical appeal due to the variety of cable arrangements and towers, slender decks and large spans with reduced number of
supports.
Despite all these advantages, the combination of long spans with light and slender decks
increases the flexibility of cable-stayed bridges. Consequently, these bridges are highly
1.2 Optimization of cable-stayed bridges
1.2.1 Significance
As detailed previously in Section 1.1, the construction of cable-stayed bridges involves
choosing one of many deck cross-section options, towers shapes and cable arrangements.
In this way, the optimization of cable-stayed bridge is important not only economically,
but also to exploit new possibilities.
Regarding the economical perspective, optimization aims to identify the optimum
geometry to fulfill all the requisites from the Ultimate Limit State and Serviceability Limit
State as well as to provide the lowest cost. Regarding the new possibilities, optimization
offers the opportunity to fix certain parameters (ex. ratio between tower and main span,
ratio between deck depth and main span length, etc.) to check if they result in feasible
design solutions.
The optimization of cable-stayed bridges may be classified into three different levels:
1. Optimization of stay-cable pre-tensioning forces: The optimum distribution of
cable pre-tensioning forces corresponding to the complete bridge affects the
structure stiffness and is paramount to a successful project design.
2. Optimization of some geometries together with cable pre-tensioning forces. At this
level, general features of the bridge have already been defined, such as span lengths,
deck material and cross-section type, shape of the towers, cable arrangements, etc.
The remaining parameters to be optimized are: thickness of slab, dimensions of
main girders, dimension of tower cross-sections, number of stay cables, stay-cables
cross-sectional areas, and pre-tensioning forces.
3. Optimization of all bridge features: (i) number of spans and towers; (ii) constraints;
(iii) material and type of deck cross-section; (iv) material, shape, and height of
towers; (v) longitudinal and transversal arrangement of cable system; (vi) number
1.2.2 Literature review
The main studies found during the literature review for this thesis are presented below
according to the classifications levels introduced in Section 1.2.1. No example of
cable-stayed bridge level 3 was found in the literature.
1.2.2.1. Level 1 optimization of cable-stayed bridges
Shape Finding Procedure / Zero Displacement Method
Wang et al. (1993) developed a procedure for calculating the pre-tensioning forces of
cable-stayed bridges that attend deck displacements requirements. In this procedure,
two-dimensional finite element models that consider cable-sag, beam-column, and large
displacement non-linear effects are were developed. All bridge materials were considered
to behave linearly. The Newton Raphson Method was chosen to iteratively determine the
equilibrium configuration of the cable-stayed bridge models under the action of deck dead
loads and pre-tensioning stay-cable forces.
In the first step, stay-cables pre-tensioning forces are set equal to zero, which results in
very large displacements and bending moments values. The second step considers the
deformed shape and cable pre-tensioning forces obtained in the first step. The deck
displacements at control points (nodes of stay-cable anchorage at the deck) obtained from
the second step are compared to the tolerance to check if convergence is achieved (Equation
1.1). This procedure is repeated until the tolerance (ϵ is attended.
9:;<=;>?@AB 3? >AB?CA= DA@B?ED3B 9 ≤ G (1. 1)
When convergence is achieved, the pre-tensioning forces of stay-cables for the deck
self-weight are determined. The authors showed that the Shape Finding Procedure converted
monotonously for three cable-stayed bridge examples: (i) unsymmetrical; (ii) symmetric
Displacement Method because the objective of the problem is to minimize displacements
at the control points.
Force Equilibrium Method
Instead of minimizing displacements, Chen et al. (2000) minimized the bending moments
diagram by considering a three-stage method. To establish the target bending moments
vector HI0J due to dead load, the first stage considers only the deck by substituting the
tower and cables by rigid supports.
In the second stage, bending moments vector HI:J due to dead loads are obtained
considering a model of the deck and tower, whereas the cables are substituted by internal
forces. The matrixKLM of influence and initial pre-tensioning forces vector HN0J were also
calculated in this stage:
HI0J = KLMHN0J + HI:J (1. 2)
HN0J = KLMQR HI0J − HI:J (1. 3)
where HI0J is the target bending moments vector obtained from the first stage; KLM is a
NxN matrix of T@, coefficients; T@, is the ith control section bending moment due to a
unit force applied at the jth stay cable; HI:J is the bending moments vector due to dead
loads from the second stage; HN0J is the initial vector of pre-tensioning forces.
In the third stage, the same second stage FEM is considered, and the initial estimate of
cable forces HN0J is used as input to calculate the new deck bending moments vector HIUJ.
Adjustments of cable forces HVNUJ are calculated as follow:
HVNUJ = KLMQR HIUJ − HI0J (1. 4)
where HNUJ is the vector of pre-tensioning forces obtained from the first iteration of the
third stage. This procedure is repeated until the updated deck bending moments vector
HIWJ of the kth iteration converge to the target bending moments HI0J by the tolerance X.
‖HIWJ − HI0J‖ < X (1. 6)
Chen et al. (2000) evaluated 2D linear-elastic structure behaviour of cable-stayed bridges
with three different deck vertical profiles and compared to the Zero Displacement Method
from Wang et al. (1993). The authors demonstrated that for bridge deck with a vertical
slope the Force Equilibrium Method is preferred.
Unit Load Method
Janjic et al. (2003) developed the Unit Load Method with experience acquired in the
Uddevalla cable-stayed bridge (Sweden) design project. Similar to the Force Equilibrium
Method presented by Chen et al. (2000), the Unit Load Method also considers bending
moments as constraints. Janjic et al. (2003) concisely described the method by the equation
below:
[ =
\[+ ∑BabU ^[_. )a (1. 7)
where [ is the desired moment distribution at the kth control point; c is the total number
of control points for which the desired bending moments are known; \[ is the bending
moment due to dead loads at the kth control point; ^[_is the bending moment at the kth
control point due to a unit load applied to the mth stay-cable; )a is the unknown
multiplication factor, i. e. the mth stay-cable pre-tensioning force. The \[ and ^[_
Two-step Method
Lee et al. (2008) applied the Unit Load Method to the Wando cable-stayed bridge (Korea).
According to the authors, the cable forces and bending moments obtained were not well
distributed due to the lack of symmetry in the structure. Besides that, the authors obtained
stay-cables forces that were exceeding maximum working load values. To avoid increasing
the cable cross-section areas, the authors added a new step to the Unit Load Method. In
this new step, an additional constraint related to the lower and upper bound of stay-cable
forces is added and the Unit Load Method becomes the Two-step Method.
B-spline Method
Hassan et al. (2012) observed that the distribution of cable pre-tensioning forces along the
spans, provided by Simões & Negrão (2000), Chen et al. (2000) and Lee et al. (2008),
follow an arbitrary polynomial function. According to the authors, B-spline curves were
chosen for representing the pre-tensioning forces distribution because they are able to
represent complex curves with low degree polynomials. The pth degree B-spline curve
were presented in Hassan et al. (2012) work as follow:
d = ∑ eB@b0 @,D d f@; 0 ≤ d ≤ 1 (1. 8)
e@,0 d = j1 kl d0 n ℎpqrksp @ ≤ d ≤ d@mU (1. 9)
e@,D d = tuvQQtte@,DQU d + tuvu#tuvu#QQtu#e@mU,DQU d (1. 10)
- = w0, … ,0yz{
DmU , dDmU, … , daQDQU, 1, … ,1yz{DmU |
(1. 11)
T = c + } + 1 (1. 12)
where d is the B-spline curve; d is the independent variable; c + 1 is the number of
degree B-spline basis functions; - is the knot vector with T + 1 elements. The horizontal
coordinate (~) of the control points represents a deck side span or half of the main span,
while the vertical coordinate (•) characterizes pre-tensioning forces.
The optimization of pre-tensioning stay-cable forces was obtained by combining B-spline
curves, finite element modelling and real coded genetic algorithm. The three-dimensional
finite element models considered cable sag, the P-V and the large displacements nonlinear
effects. The optimization of pre-tensioning forces was obtained under the self-weight of
deck and towers, considering as constraints the vertical deflection of the deck and the
horizontal deflection of the towers. The authors expressed the objective function by the
equation below:
= € XU + X + ⋯ :;>W+ XU?+ X ?+ ⋯ ?A+;CE (1. 13)
where is the objective function; X@is the vertical deflection of the ith deck node; X,,?is the
longitudinal deflection of the jth tower node.
Hassan et al. (2012) considered the optimization of pre-tensioning stay-cables forces for a
symmetric cable-stayed bridge with composite steel-concrete two I-girder deck, H-shape
towers, and semi-fan double plane cables arrangement. An example with total number of
stay-cables equal to 80, being 10 cables in one plane of the side span or half of the main
span was evaluated. Among other solutions, two cases were compared: (i) optimization
considering the concept of B-spline curves; (ii) direct optimization of pre-tensioning
stay-cable forces.
As the bridge is symmetrical, a total of 20 pre-tensioning forces were optimized in the
second case. For the first case, the authors considered four control points c + 1 = 4 . The
horizontal coordinate of the first and forth control points that represent the beginning and
end of the side span or half of the main span are known. Again, considering symmetry, 12
variables were optimized. Results showed that the first case presented more uniform
distribution of pre-tensioning forces and exemplified the efficacy of the B-spline curve
method. The authors also conclude that cable sag effect was the only source of non-linearity
1.2.2.2. Level 2 optimization of cable-stayed bridges
Entropy Based Optimization Method
Simões & Negrão (1994) developed a multi-objective optimization method for determining
sizing and geometric variables of a cable-stayed bridge constituted by a steel box girder
deck cross-section, H-shape towers with steel box section, and semi-fan cables
arrangement. The vector of sizing variables (ƒ) included distance between pier and cable
anchorages and height of the first stay-cable at the tower. The geometric variables vector
(„) consisted of equivalent plate thickness of tower elements, equivalent plate thickness of
the upper and bottom flanges of main girder elements, and cross-sectional area of each
stay-cable. The constraints included stay-cables cost, lower limit of sizing variables, lower
and upper limit of geometric variables, spacing between cables and strength requirements.
In comparative analysis performed by the authors, they concluded that the P-V and the
large displacement nonlinear had less than 1% effect when compared to linear analysis and,
thereby, they recommended disregarding these effects. The non-linear axial force
elongation of the cables was expected to be very small and consequently disregarded. The
material behavior of the structural steel was assumed linear elastic. The modelling of the
cable-stayed bridges was accomplished through a two-dimensional finite element model.
Regarding the loads, dead loads were evaluated in the erection stage analysis, while dead
and uniform live loads were considered in the service stage analysis.
The method presented by Simões & Negrão (1994) determines the variables (ƒ and „
vectors) that minimize all goals by using a minimax optimization problem. The minimax
was solved indirectly by minimizing a continuously differentiable function based on
entropy. This technique measures the amount of disorder in a system, with a small value
indicating that the solution is in order. The unconstrained and differentiable equation
solved by the optimization method is presented below.
where • are constraint functions; and Ž is the control parameter that has to be increased
through the iterations. As stresses are obtained numerically throughout the analysis, the
Taylor series is applied for providing explicit algebraic form. Pareto solution was also
applied for determining the minimum solution that attends both objectives.
Simões & Negrão (2000) used the Entropy Based Optimization Method for optimizing a
steel box-girder deck cable-stayed bridge with goals of cost, strength requirements and
displacements. The three-dimensional finite element model considered plate membrane
elements for representing the deck. The variables included equivalent thickness of top,
bottom and side plates of the box-girder in different parts of the bridge, length, width, and
thickness of towers below and above the deck, cross-sectional area of cables,
pre-tensioning forces of cables, and cable anchorages positioning at deck and towers. The
completed bridge configuration was evaluated due to dead loads, uniform live loads, and
uniform lateral wind loads at the deck. The sag effect of the cables was the only source of
non-linearity considered in the optimization process, through the use of Ernst modulus of
elasticity.
Power Search Optimization Methodology
Neves (1997) applied a multi-objective nonlinear programming optimization method to the
design procedure of cable-stayed bridges. Power search routines to find optimal Pareto
solutions were employed within the formulation of the multi-objective problem. A
three-dimensional finite element modelling of the structural system was used within the
framework to reach an optimized solution for the completed bridge structure as well for
the construction stages.
The optimization process considered cable sag, beam column and large displacements
nonlinear effects and aimed to minimize: (i) displacements, shear and bending moments in
towers and deck, (ii) stay-cable cross-section areas and stresses in all elements, (iii)
geometric deviations of deck grade during construction stages, and (iv) overall weight. The
pre-tensioning forces, (ii) I-girder composite deck or box girder deck dimensions, and (iii)
height of towers and cross-section dimensions.
Powell’s Direct Search Method
Long et al. (1999) optimized composite box girder cable-stayed bridges to minimize cost
of the structure by applying the Powell’s Direct Search Method, which does not make use
of the functions derivatives. Two-dimensional finite element models considered
non-linearity effects and optimized the final configuration of the structure under the action of
dead and live loads. Optimized design variables included: (i) thickness of concrete slab,
(ii) width and thickness of flanges and webs of the steel box girder, (iii) dimensions and
spacing of stiffeners, (iv) area of stay-cables cross-sections, and (v) towers dimensions.
Hybrid Genetic Algorithm (GA) and Support-vector Machine (SVM) Method
Although the GA is very efficient for finding global optimum, it may require a large
number of analyses. By considering the extra analysis due to the nonlinearities, the
optimization becomes impractical due to the high computational cost. In order to consider
the nonlinear effects in the cable-stayed bridge optimization process, and at the same time
to avoid the massive number of analysis, Lute et al. (1999) proposed a hybrid GA and SVM
method.
SVM is a supervised machine learning algorithm that generalizes the input/output relation
of experiments (also called training set) in order to predict unseen examples. The inputs
are the side to main span ratio, tower height to bridge length ratio, girder top and bottom
flange widths, girder overall depth, tower box width and depth, and cables diameter. The
corresponding outputs are maximum vertical girder deflection, maximum longitudinal
tower deflection, maximum girder positive and negative bending moments, maximum
girder compression force, maximum tower moment, and maximum stay-cable force. The
obtained through ANSYS analyses. The inputs described above are considered design
variables, while the outputs are used for calculating constraint functions. These functions
are related to the strength of cables, stiffness of deck and towers, and stability due to critical
buckling load. The overall objective is to obtain the minimum material cost.
The framework proposed by Lute et al. (1999) has two main phases. In the first phase,
training data is generated via ANSYS, and posteriorly SVM is used as a regression
machine. In the second phase, GA and SVM are used together for the optimization. While
GA generates random design variables, apply operators and calculate fitness values, the
SVM predicts outputs based on the same probability distribution as the training data.
Two-dimensional box-girder deck cross-section cables-stayed bridges with fan cable
arrangement were considered considering total length ranging from 300 and 500m. The
comparisons between outputs obtained by SVM and ANSYS provided less than 5% error.
According to the authors, results showed that the hybrid GA and SVM method is efficient
computationally and can be used for preliminary design of cable-stayed bridges.
Surrogate function Method
Hassan et al. (2013a), continuing their work described above as B-spline Method (Hassan
et al., 2012), developed surrogate polynomial functions for evaluating pre-tensioning
cable-forces in semi-fan cable-stayed bridges under the action of dead loads. This way,
during the optimization of bridge geometric variables, the pre-tensioning forces are directly
estimated through surrogate functions instead of being considered as design variables.
In order to minimize the deflections at the deck and towers, Hassan et al. (2013a)
considered that the follow main variables for the optimization of pre-tensioning cable
forces: the number of stay-cables, main span length, and height of the towers. The authors
adopted the ordinary least square method (OLS) as the technique of fitting data, responsible
for determining the regression coefficients that compose the surrogate polynomial function
of the pre-tensioning stay-cable forces. The vector of stay-cable forces was defined as
•×U = )•×D‘D×U+ ’•×U (1.15)
where e is the number of stay-cables, •×U is the vector of stay-cable pre-tensioning
forces, } is the number of constants that compose the surrogate function, )•×D is the matrix
of constants, ‘D×U is the vector of unknown parameters to be determined from the
regression analysis, ’•×U is the vector of independent random variables with expectation.
The constants depend on the following parameters: (“U) the ratio of main span length and
the total length of bridge, (“ ) the ratio of the upper strut height of tower and the total
length of bridge, (“”) the total length of the bridge divided by 1000.
A total of 1800 bridges covering different number of cables and parameters (“U, “ and “”)
were analyzed in a parametric study performed by the authors. The stay-cable
pre-tensioning forces of each one of these bridges were optimized to minimize deck and towers
deflections. The adequacy of the surrogate functions was proved by comparing the results
with pre-tensioning forces obtained through surrogate functions to “exact solutions”. The
latter solutions were obtained via finite element analysis and RCGA optimization as
described by the B-spline Method (Hassan et al., 2012). The coefficients obtained through
the parametric study were stored in a built-in library of the optimization program.
Hassan et al. (2013b) optimized two I-girder composite cable-stayed bridges with
semi-fan cable arrangements. The considered design variables were: (i) number of stay-cables
and their diameters, (ii) main span length, (iii) height of the tower upper strut, (iv) thickness
of concrete slab and I-girder dimensions, (v) depth, width, and thickness of tower
cross-section. The pre-tensioning forces were estimated using the surrogate polynomial functions
developed by Hassan et al. (2013a). Dead load, uniformly distributed live load, and mean
wind loads at the deck were applied to the FEM. The structures were optimized using
RCGA with the objective of minimizing the total cost of the structure.
1.2.2.3. Optimization of other types of cable-supported bridges
Studies have also been dedicated to the structural optimization of arch bridges and
optimization of the cable system of hybrid cable-stayed suspension bridges with the
objective of minimizing the amount of steel used in the cable system. The first iteration
considers an initial configuration based in practical rules. In the first step, the FEM is
assessed under the action of dead loads in order to evaluate the cables cross-sectional areas
and post-tensioning forces. In the second step, live load analysis is performed and the
maximum stresses of the cable elements are determined. If the tolerance conditions are not
satisfied, a new iteration is performed considering the updated stresses. Lonetti et al.
(2014b) performed a parametric study applying the two-step iteration algorithm verifying
the convergent behaviour of the method.
Regarding arch bridges, Bruno et al. (2016) presented a Three-steps algorithm model for
the optimization of hangers with multiple intersections (network) of arch bridges. The
hanger post-tensioning forces are calculated in the first step, while in the second step the
hangers, the arch and girder cross-sections are evaluated. In the third and last step, the
tolerance conditions are checked. If these tolerances are not satisfied the variables are
updated and a new iteration is performed.
1.3 Research Objectives
The subject of this thesis is level 2 (stay-cables pre-tensioning forces and geometric
variables) optimization of highway composite steel-concrete two I-girder cable-stayed
bridges considering the action of dead, live and wind loads.
Similarly to Hassan et al. (2013b), the RCGA is used for the structural optimization of
cable-stayed bridges. The aim objective is to develop an optimization procedure that
performs truck moving load and buffeting wind forces evaluation with a reduced number
of design variables in order to avoid excessive computational effort. The resulting
procedure called Discrete Phases Approach is based on classifying the variables to be
optimized into two categories; main and secondary variables. Instead of the secondary
variables being considered as design variables for the RCGA, they are optimized indirectly
1.3.1 Methodology and Relevance
Optimization of cable-stayed bridges is a powerful tool for design because it provides the
optimum solution from the structural and economic points of view. This optimization will
focus on medium span cable-stayed bridges (rather than long span bridges) because longer
bridges have challenges that may require unique solutions.
Considering the background information presented in Section 1.1, composite
steel-concrete cross section is one of the best options for medium span cable-stayed bridges.
This is because steel girders are lightweight and offer high strength, while the concrete slab
improves deck resistance to axial loads and provides a proper platform for vehicles or
trains. The record main span for this type of bridge was established in 2011 by the Erqi
Yangtze River Bridge in China, which has 616m of main span and two-plate girder
cross-section. According to Pedro et al. (2016), the competitiveness of composite cable-stayed
bridges is explained by two facts: (i) the cost of the deck per square metre does not show
great sensitivity to span increases, (ii) none of the bridge’s main components – deck, towers
or cables – have reached their limit application. Given these facts, the following work is
focused on a two I-girder composite steel-concrete cable-stayed bridge with semi-fan
double plane cable configuration and H tower shape.
In the literature review presented in Section 1.2 for level 2 optimization of cable-stayed
bridges, one may observe that previous efforts have considered live loads as a simple
uniform distributed load and wind loads as basic mean wind loads. Given that engineers
are adopting thinner and lighter decks, a deeper analysis of dynamic loads (specifically live
and wind loads) is essential for the design and optimization of cable-stayed bridges.
In this study, live loads, truck and lane loads are evaluated according to the Canadian
Highway Bridge Design Code. The envelope of displacements and internal forces are
calculated by considering different configurations of loading on the main and side spans.
For each configuration, several analyses will be done to consider the five truck axles