Training an Effective Way of Organization Growth and Employee
Development
A STUDY IN E. S. COMPANY LTD, Chennai
Dr.S.Poongavanam, Asst. Professor, AMET Business school,AMET University, Chennai
ABSTRACT
Employee training is the process whereby people learn the skills, knowledge, attitude and
behaviours needed in order to perform their job effectively. No big industrial organization can
long ignore the training and development needs of its employees without seriously inhabiting its
performance. In this article the training process of the company with the help of percentage and
chi-square test. The study group for this study is 60 and stratified random sampling technique is
used select the sample.
Key Words: Motivation, work life, Interpersonal relationship and work culture.
INTRODUCTION
Training is the act of increasing the
knowledge and skill of an employee for
doing a particular job. It is concerned with
imparting specific skills for particular
purposes. Whereas the term ‘development’
is a broad one. Its aim is to improve the
overall personality of an individual. The
term is mostly used in the context of
executives only. Every organization needs to
have well trained and experienced people to
perform the activities that have to be done.
Training is a process of learning a sequence
of programmed behavior. It is application of
knowledge. It gives people an awareness of
the rules and procedures to guide their
behavior. It attempts to improve their
performance on their current job and prepare
them for an intended job. Development is a
related process. It covers not only those
activities which improve job performance,
but also which bring about the growth of the
personality; help individuals in the progress
towards maturity and actualization of their
potential capabilities so that they become
not only good employees but better men and
women. In organizational terms, it is
intended to equip person to earn promotions
and hold greater responsibility.
To study the level of motivational and inter
personal relationship in the E S company.
To study the level of understanding of
training programme.
To study the employee growth after
attending the training
To give viable suggestions
RESEARCH
METHODOLOGY
METHODOLOGY:
Methodology is defined as
the specification of methods and procedures
for acquiring the information needed. It is a
plan (or) frame work for doing the study and
collecting the data. This project is a study
marked by prior formulation of research
questions. This investigator already knows
the substantial amount about the research
problems before the project is initiated.
AREA OF RESEARCH:
The research is carried out on
training and development of supervisor of E
S company , chennai.
RESEARCH DESIGN:
The research design is
descriptive in nature. Descriptive studies
attempt to obtain a complete accurate
description of a situation.
METHOD OF SAMPLING:
Sampling is the process of
obtaining the information about an entire
population by examining only a part of it.
For the purpose of this study the researcher
has used the stratified random sampling
method. The total population was divided
into groups and samples are collected
randomly from these groups.
SAMPLE SIZE:
The size of the sample is 60.
CONSTRUCTION OF TOOLS:
The tools used for collecting
data is a questionnaire. A questionnaire is a
simply formalized schedule to obtain and
record specified and relevant information,
with tolerable accuracy and completeness. In
other words, it directs the questioning
process and promotes the clear and proper
recording.
The data collected through a
specially designed questionnaire for the
present study. The five point likert scaling is
used in order to elicit frank opinion of the
respondents with regard to training and
development in E S company ltd..
For the purpose the
and to their superior. They are selected at
stratified random sampling.
SOURCE OF DATA:
Both the primary as well as
the secondary data is taken into account for
the purpose of the study.
PRIMARY DATA:
The instrument used to
collect primary data is a well – designed
questionnaire. The questionnaire consisted
only the likert scaled responses. The
questionnaire is carefully constructed and
properly setup.
SECONDARY DATA:
Secondary data are extracted
from the files, registers, records, obtained
from personnel department.
FRAME WORK ANALYSIS:
For analyzing the supervisors
and superior (respondents) opinion towards
training and development the data are
collected through primary source are
subjected to statistical techniques namely
percentage analysis and Chi –square to
arrival at a valid and reliable conclusion.
LIMI TATION:
1. Time constraint was the major limiting factor, hence only a specific sample from the entire segment is taken in to consideration
2. Questionnaire has been administrated in the form of
interview. The findings are therefore based on how the respondents have perceived the question.
3. The cost constraint was due to the fact that the project was self supporting in nature
ANALYSIS AND INTERPRETATION
TABLE: 1
Motivation Level of superior
During training inspiration of the superior is must. If the support is from
superior the employees will participate in the training very actively.
PARTICULARS NO.OF RESPONDENTS PERCENTAGE
To full extent 33 55
Moderate 12 20
To some extent 8 13
Very little 7 12
From the study it is observed that 55% of respondents got full extent of
motivation from their superior, 20% moderate, 13% to some extent and 12% got very little of
motivation from their superior during the time of training.
GRAPH:1
TABLE:2
Techniques learnt are applicable in job:
The techniques which are taught during training should be related (or) relevant to the job.
PARTICULARS NO.OF RESPONDENTS PERCENTAGE
Strongly agree 33 55
Agree 17 28
Partically agree 7 12
Disagree 3 5
Total 60 100
From the study it is observed that 55% of respondents strongly agree that
the techniques learnt are applicable to job, 28% of them agree, 12% of them partly agree to the
statement however 5% have not agree upon the statement.
GRAPH:2
Motivation level
33
12
8 7
0 5 10 15 20 25 30 35
To full extent Moderate To some
extent
Very little
Particulars
N
o
of
r
e
s
po
nd
e
nt
TABLE:3
Any change in work life
After training there should be some modification (or) alteration in the daily work.
PARTICULARS NO.OF RESPONDENTS PERCENTAGE
Strongly agree 27 45
Agree 16 27
Partly agree 14 23
Disagree 3 5
Total 60 100
From the study it is observed that 45% of respondents strongly agree that
they have change in daily work, 27% agree to the statement, 23% partly agree however 5% have
not agree upon the statement.
GRAPH:3
Techniques learnt are applicable to job
6
10
2 2
0 2 4 6 8 10 12
Strongly agree Agree Partly agree Disagree
Particulars
N
o
of
r
es
po
nd
ent
Any changes in daily work
27
16
14
3 0
5 10 15 20 25 30
Strongly agree Agree Partly agree Disagree
Particulars
No.
of
re
spo
nd
ent
TABLE:4
Inter – personal relations
Employees, particularly supervisors and executives, need interpersonal skills popularly
known as the people skills. Interpersonal skills are needed to understand oneself and others
better, and act accordingly.
PARTICULARS NO.OF RESPONDENTS PERCENTAGE
To full extent 41 68
Moderate 10 17
To some extent 6 10
Very little 3 5
Total 60 100
From the study it is observed that 68% of respondents have full extent of
inter – personal relation with their superior, 17% moderate relationship, 10% to some extent and
5% have very little of inter – personal relation with their superior.
GRAPH:5
TABLE:6
Training makes better in field
Inter - personal relations
To full extent 68% Moderate
17%
To some extent 10%
Training makes employee’s to improve their performance by increasing their ability to perform through learning. Usually by changing the employee’s attitude (or) increasing his (or) her skill
and knowledge.
PARTICULARS NO.OF RESPONDENTS PERCENTAGE
Excellent 29 48
Good 15 25
Average 12 20
Poor 4 7
Total 60 100
From the study it is observed that 48% of respondents are excellent in
their field after training, 25% are good, 20% are average however 7% are poor in their field even
after the training.
GRAPH:6
TABLE:7
Satisfaction of training
The requirement which are provided in the organization during the time of training should be
able to fulfill the needs of the employee’s. So that many will be attending the training with
interest.
Training makes better in field
Excellent 48%
Good 25% Average
20%
PARTICULARS NO.OF RESPONDENTS PERCENTAGE
Strongly agree 30 50
Agree 18 30
Partly agree 8 13
Disagree 4 7
Total 60 100
From the study it is observed that 50% of respondents strongly agree that they are
satisfied with training need, 30% agree with the statement, 13% partly agree however 7% have
not agree upon the statement.
GRAPH:7
TABLE:8
Level of understanding
To what extent the employee’s obtain knowledge about the subject which is taught during
training.
PARTICULARS NO.OF RESPONDENTS PERCENTAGE
Strongly agree 34 57
Agree 15 25
Partly agree 8 13
Disagree 3 5
Total 60 100
Satisfaction of training need
0 5 10 15 20 25 30 35
Strongly agree Agree Partly agree Disagree
Particulars
N
o
of
r
es
po
nd
From the study it is observed that 57% of respondents strongly agree that their
level of understanding is improved, 25% agree, 13% partly agree however 5% have not agree
upon the statement.
GRAPH:8
TABLE:9
Positive work culture: Training enables to hold a different view from other employee’s.
PARTICULARS NO.OF RESPONDENTS PERCENTAGE
Strongly agree 31 52
Agree 22 37
Partly agree 5 8
Disagree 2 3
Total 60 100
From the study it is observed that 52% of respondents strongly agree that there is
positive work culture, 37% agree, 8% partly agree however 3% have not agree upon the
statement.
Level of understanding
0 5 10 15 20 25 30 35 40
Strongly agree Agree Partly agree Disagree
P
a
rt
ic
ul
a
rs
GRAPH:9
TABLE:10
Useful of training in personal life
Training should also improve the standard of a individual in is own life.
PARTICULARS NO.OF RESPONDENTS PERCENTAGE
Strongly agree 34 57
Agree 15 25
Partly agree 9 15
Disagree 2 3
Total 60 100
From the study it is observed that 57% of respondents strongly agree that training
is useful in their own life, 25% agree, 15% partly agree however 3% have not agree upon the
statement.
GRAPH:10
Positive work culture
Strongly agree 52%
Agree 37%
Partly agree 8%
TABLE: 11 Recommendation
Reference is needed in all the things. By telling some good words only others will
come to know about the training.
PARTICULARS NO.OF RESPONDENTS PERCENTAGE
Strongly agree 44 73
Agree 7 12
Partly agree 7 12
Disagree 2 3
Total 60 100
From the study it is observed that 73% of respondents strongly agree that they
will refer, 12% agree, 12% partly agree however 3% have not agree upon the statement.
GRAPH:11
34
15
9
2
0 5 10 15 20 25 30 35
No of respondent
Strongly agree
Agree Partly
agree
Disagree
Particulars
Useful of training in personal life
44
7 7
2
0 5 10 15 20 25 30 35 40 45
No of respondent
Strongly agree
Agree Partly agree Disagree
Particulars
TABLE:12
Subject met the needs and interest:
The area in which they have discussed should be the need (or) want of the employee and also it
should be relevant to their work. The way of explaining should catch the eyes of the audience.
PARTICULARS NO.OF RESPONDENTS PERCENTAGE
Very well 35 58
Fairly 17 28
To small extent 6 10
Not adequately 2 4
Total 60 100
From the study it is observed that 58% of respondents says that the subject need
met with the interest and 28% include the statement fair, 10% to small extent however 4% have
got poor subject need and not relevant to their work.
GRAPH:12
TABLE:12
Benefits:
After training the employee should gain some extra knowledge about what is going on around
Subject met the needs and interest
Very well 59% Fairly
28% To small extent
10%
PARTICULARS NO.OF RESPONDENTS PERCENTAGE
Knowledge of what other companies are doing
34 57
How theory and principles are pertinent
15 25
Ideals and techniques that can be applied on the job
9 15
Other gains 2 3
Total 60 100
From the study it is observed that 57% of respondents got knowledge of what
other companies are doing, 25% knew the theory and principles are pertinent, 15% knew ideals
and techniques that can be applied on the job however only 3% have got the other gains.
GRAPH:12
TABLE:13
Entire programmes rating:
By seeing the total estimation based on cost and time the evaluation takes place.
Benefits
Knowledge of what other companies are
doing 57% How theory and
principles are pertinent
25%
Ideals and techniques that
can be applied on the job
15%
PARTICULARS NO.OF RESPONDENTS PERCENTAGE
Very worthy 45 75
Fairly worthy 7 12
Just worthy 5 5
Not so worthy 3 5
Total 60 100
From the study it is observed that 75% of respondents says the programme is very worthy, 12%
fairly worthy, 5% just worthy however 5% telling it is not so worthy.
GRAPH:13
CHI SQAURE ANALYSIS
Hypothesis: There is no significant relationship between trainer and satisfaction in training
.OBSERVED FREQUENCY
Entire programmes rating
45 7
5 3
0 10 20 30 40 50
Very worthy Fairly worthy Just worthy Not so worthy
P
a
rt
ic
ul
a
rs
EXPECTED FREQUENCY:
FORMULA:
CHI SQUARE= ? [(O-E)²/E]
O- Observed frequency , E-Expected frequency
(O-E)=Difference between observed frequency and expected frequency.
(O-E)²=Square of the difference
CALCULATION: Satisfaction in training/Effective Trainer
Strongly agree
Agree Strongly
Dis-agree
Dis-agree Total
Excellent 9 9 1 2 21
Good 6 7 2 2 17
Fair 8 5 4 0 17
Inadequate 2 2 1 0 5
Total 25 23 8 4 60
Satisfaction in training/Effective Trainer
Strongly agree
Agree Strongly
Dis-agree
Dis-agree Total
Excellent 8.75 8.05 2.8 1.4 21
Good 7.1 6.51 2.3 1.1 17
Fair 7.1 6.5 2.27 1.13 17
Inadequate 2.08 1.9 0.7 0.33 5
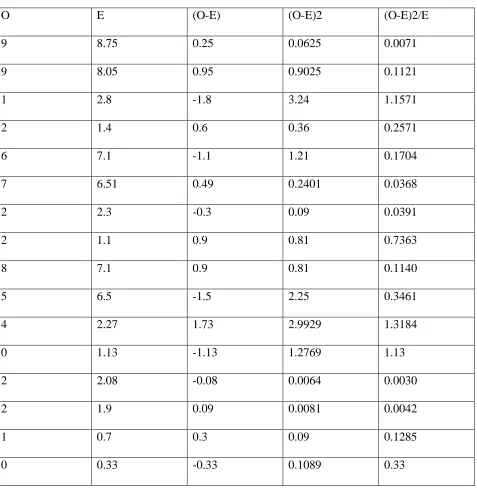
O E (O-E) (O-E)2 (O-E)2/E
9 8.75 0.25 0.0625 0.0071
9 8.05 0.95 0.9025 0.1121
1 2.8 -1.8 3.24 1.1571
2 1.4 0.6 0.36 0.2571
6 7.1 -1.1 1.21 0.1704
7 6.51 0.49 0.2401 0.0368
2 2.3 -0.3 0.09 0.0391
2 1.1 0.9 0.81 0.7363
8 7.1 0.9 0.81 0.1140
5 6.5 -1.5 2.25 0.3461
4 2.27 1.73 2.9929 1.3184
0 1.13 -1.13 1.2769 1.13
2 2.08 -0.08 0.0064 0.0030
2 1.9 0.09 0.0081 0.0042
1 0.7 0.3 0.09 0.1285
0 0.33 -0.33 0.1089 0.33
[(O-E)2/E] =5.8902
Degree of freedom =(R-1) (C-1)
=(4-1) (4-1)
=3*3 = 9
Calculated value =5.8902
At 5% level of significance the table value is
16.19
Table value ˃ calculated value
Hₒ is accepted
There is no significance relation
between satisfaction in training program in
organization and Effective trainer.
FINDINGS
55% of respondents have got full extent
of motivation from their superior during
the time of their training.
55% of respondents strongly agree, the
techniques learnt are applicable to their
job.
45% of the respondents strongly agree,
that there is change in daily work.
68% of respondents have full extent of
inter – personal relation with their
superior.
It is found that 48% of the respondent
are excellent in their field after the
training.
It is found that majority (50%) strongly
agree, they are satisfied with training
need.
Majority numbering 57% respondents
strongly agree, their level of
understanding is improved.
52% of respondents strongly agree, there
is positive work culture.
57% of respondents strongly agree,
training is useful in own life.
73% strongly agree, will refer this
training to co – workers.
58% of respondents got very well the
subject need and had interest in training.
75% of respondents says the entire
program is very worthy.
SUGGESTIONS
Companies have to provide
modern equipment and
technologies which may refresh the
employee mind.
Effective organizational
communication must be promoted
in order to reduce role ambiguity,
role conflict, to share employee
perception.
A survey on training and
development can be made with
employees on periodic intervals to
measure the difficulty faced by the
employees’.
Job rotation must be implemented.
A scientific approach to select
participants in training
programmes will prove a long way
in improving the general climate of
the department.
CONCLUSION
It is concluded that effective training
for the company ranging from small to beg.
Developing the skills and knowledge of the
employees not only contribute to the
individual growth it also contribute
positively towards the achievement of
organization goals. It is better organization
plans its training activities, and prepare a
training calendar to suit the need and make it
a more effective. .
REFERENCES
1.Heinich R., Molenda M., Russell JD. & Smaldino, S. E. (2002). Instructional media and technologies for learning, Washington: Merrill Prentice Hall.
2.Jonassen, D. H., Peck, K. L., & Wilson, B. G. (1999). Learning with technology: A constructive perspective. New Jersey: Prentice-Hall Inc.
3.Burden, R. and Proctor, T. (2000). Creating a sustainable competitive advantage through training. Team Performance Management 6(5,6): 90-97.
4. Bushardt, S. C., Fretwell, C. et al. (1994). Continuous Improvement through Employee Training: A Case Example from the Financial Services Industry. The Learning Organization: An International Journal 1(1): 11-16.
5.Hallier, J. and Butts, S. (2000). Attempts to advance the role of training: process and context. Employee Relations 22(4): 375-402.
6. Hughey, A. W. and Mussnug, K. J.
training programmes. Training for Quality 5(2): 52-57.
7.Mathews, B. P., Ueno, A., et al. (2001). Quality training: findings from a European survey. The TQM Magazine 13(1): 61-71.