ISSN (Print) : 2320 – 3765 ISSN (Online): 2278 – 8875
I
nternational
J
ournal of
A
dvanced
R
esearch in
E
lectrical,
E
lectronics and
I
nstrumentation
E
ngineering
(An ISO 3297: 2007 Certified Organization)
Vol. 5, Issue 3, March 2016
Optimal Capacitor Placement in 69-Bus RDS
Using Shuffled Frog Leaping Algorithm
Shangavi S M1, Ajin S2,Kirthana K3
PG Student [PSE], Dept. of EEE, Anna University Regional Campus, Coimbatore, Tamilnadu, India1
PG Student [PSE], Dept. of EEE, Anna University Regional Campus, Coimbatore, Tamilnadu, India2
PG Student [PSE], Dept. of EEE, Anna University Regional Campus, Coimbatore, Tamilnadu, India3
ABSTRACT: This paper presents a method for the Capacitor Placement in Distribution Systems with theobjective of improving the voltage profile and reduction in power losses by applying shuffled frog leaping algorithm(SFLA).The solution methodology consist of two parts: in part I, the loss sensitivity factors are used to select the candidate locations for the placement of capacitor and un part II, SFLA is used to estimate the optimal size of capacitors at the optimal buses determined from the part I. The other advantage of the algorithm is the global search ability which is implemented by introducing neighborhood source production mechanism which is similar to mutation process. To demonstrate this, computer simulations are carried out on a 69-bus system and compared the results with the other approaches. The proposed method has outperformed the other methods in terms of the quality of solution and computational efficiency.
KEYWORDS: Capacitor placement, Sensitivity analysis, SFLA,
I. INTRODUCTION
Energy is always transferred from source to distribution via transmission and consuming active and reactive power losses. By Proper reactive power management, the losses due to the reactive power losses can be controlled. In order to avoid such reactive power loss, local reactive power compensation can be made by placing appropriate shunt capacitor. This is the most powerful method employed for this problem.
Shunt capacitors are of great use in enhancing the performance of distribution system and it may be unbalanced due to several reasons. This includes single and three phase loads, phases of transmission lines are unequally loaded and the overhead lines in distribution systems are not transposed.
Due to the extensive use of harmonic producing equipment, harmonics are propagated throughout the distribution systems. By excessive losses and potential malfunctioning of electrical equipment, harmonics may become undesirable and cause over heating in the equipment. This inclusion of shunt capacitor without the consideration of harmonics may leads to an increase in harmonic distortion levels.
Benefits of capacitor placement are minimizing active and reactive power losses, improving power factor, maintaining appropriate voltage profile and releasing capacity of feeders and transformers. If the capacitors are not selected with appropriate size and not placed in appropriate place then system may become vulnerable. It behaves in abnormal way and voltage may increase beyond limits, unacceptable power factor and series and parallel resonance issues.
Several methods was proposed and developed for the optimal capacitor placement and sizing by using various method such as dynamic programming method [1-2], a nonlinear programming based method [3], fuzzy based approach [4] in radial distribution networks in the presence of voltage and current harmonics.
However, most of the analytical, numerical Programming or heuristic based methods are unable to work well. In recent years, AI-based methods such as genetic algorithm (GA) [5-7] have been applied to the capacitor placement problem with promising results. Moreover, due to premature convergence of GA, its performance degrades and its search capability reduces.
ISSN (Print) : 2320 – 3765 ISSN (Online): 2278 – 8875
I
nternational
J
ournal of
A
dvanced
R
esearch in
E
lectrical,
E
lectronics and
I
nstrumentation
E
ngineering
(An ISO 3297: 2007 Certified Organization)
Vol. 5, Issue 3, March 2016
the shuffle frog leaping algorithm (SFLA) [10-13] is based on the combining concept of the shuffled complex evolution (SCE) and PSO .SFL algorithm similar to the SCE uses from portioning and shuffling members of population and to improve member of subsets has been used from a process similar to the PSO algorithm.
II. PROBLEM FORMULATION
The objective of the capacitor placement is to minimize the cost of the system by reducing the real power losses subjected to certain constraints and load pattern. Here, in this paper, for simplicity, the operation and maintenance cost of the capacitor is not taken in to consideration. The three- phase system is considered as balanced and loads are assumed as time invariant. The Objective function can be described as,
t
or
f
P
loss
f
min
cos
min
min
min
(1) where cost is the objective function which includes the cost of power loss and the capacitor placement. The voltage magnitude at each bus must be maintained within limits and is expressed as,
max min
V
V
V
i
(2)
where
V
i is the voltage magnitude of bus i. The power flows are computed by the following equations derived from the single line diagram show in fig.1Fig.1. Single line diagram of main feeder
Real and reactive power equations,
2 2 2 1 1 1 i i i ij Li i i
V
Q
P
R
P
P
P
(3) 2 2 2 1 1 1 i i i ij Li i i
V
Q
P
X
Q
Q
Q
(4)
22 2 2 1 2 1 1 1 2 2
2
i i i ij ij i ij i ij i iV
Q
P
X
R
Q
X
P
R
V
V
(5) Where
P
i andQ
i are the real and reactive power flowing out of bus i,PL
i andQL
iare the real and reactive power loads at bus i. The resistance and reactance of the line section between buses i and i+1 are denoted byR
i,i1andX
i,i1respectively. The Power loss of the line section connecting buses I and i+1 may be computed as,
2
2 2 1 1 , i i i j i i LOSS
V
Q
P
R
P
ISSN (Print) : 2320 – 3765 ISSN (Online): 2278 – 8875
I
nternational
J
ournal of
A
dvanced
R
esearch in
E
lectrical,
E
lectronics and
I
nstrumentation
E
ngineering
(An ISO 3297: 2007 Certified Organization)
Vol. 5, Issue 3, March 2016
1 0 1 , , N i i i LOSS LOSS FP
P
(7)Consider the practical capacitors, there exists a finite number of standard sizes which are integer multiples if smallest size
Q
0c.Besides, the cost per kVAr varies from one size to another. In general, capacitors of larger size have lower unit prices. The available capacitor size is usually limited toc c
LQ
Q
max
0(8)
whereL is an integer. Therefore, for each installation location, there are L capacitors sizes
Q
0,
2
Q
0,....LQ
0L available. Given the annual installation cost for each compensated bus, the total cost due to capacitor placement and the change in power loss is written as,
c i c i c i Cf Loss TP
P
K
K
Q
K
OST
C
,(9)
where n is the number of candidate locations for capacitor placement,
K
Pis the equivalent annual cost per unit ofpower loss in $/ (kW-year).
K
Cf is the fixed cost for the capacitor placement. The constantK
ciis the annual capacitor installation cost and i=1,2,…n are the indices of the buses selected for compensation. The bus reactive compensation power is limited to
n i Li i cQ
Q
1 (10)
Where
Q
ciandQ
Liare the reactive power compensated at bus I and the reactive load power at bus I, respectively.III. SENSITIVITY ANALYSIS AND SENSITIVITY FACTORS
The candidate nodes for the placement of capacitors are determined by using loss sensitivity factors. The estimation of these candidate nodes helps in the reduction of the search space for the optimization process.
Consider the distribution line with an impedance
R
jX
and a load ofP
eff
jQ
eff connected between pand q buses as shown in fig.2. Active power loss in the kthline is given by,
I
k*
R
k
2
which can be expressed as,
22 2
q
V
k
R
q
Q
q
P
q
P
lineloss
eff
eff(11)
Similarly, reactive power loss in kth line is given as,
22 2
q
V
k
X
q
Q
q
P
q
Q
lineloss
eff
eff(12) Where
P
eff
q
andQ
eff
q
is the total active and reactive power supplied beyond the node’q’.
2*
*
2
q
V
k
R
q
Q
Q
P
eff eff lineloss
(13)
2ISSN (Print) : 2320 – 3765 ISSN (Online): 2278 – 8875
I
nternational
J
ournal of
A
dvanced
R
esearch in
E
lectrical,
E
lectronics and
I
nstrumentation
E
ngineering
(An ISO 3297: 2007 Certified Organization)
Vol. 5, Issue 3, March 2016
CANDIDATE NODE SELECTION
The loss sensitivity factors (
P
lineloss/
Q
eff ) are calculated from the base load flows and the values are arranged in descending order for all lines in given system. A vector bus position “bpo
i
” is used to store therespective end bus of the lines arranged in descending order of the values (
P
lineloss/
Q
eff ). The descending order of elements of “bpo
i
” vector will decide the sequence in which the buses are to be considered for compensation.This sequence is governed by (
P
lineloss/
Q
eff) and hence the proposed loss sensitivity factors become powerful. At these buses of ‘bpo
i
’ vector, normalized voltage magnitudes are calculated by considering the base case voltage magnitudes given by
nor
i
V
i
/
0
.
95
. Now for the buses whosenor
i
value is less than 1.01 are considered as the candidate buses requiring the placement of capacitor.These candidate buses are stored in “rank bus” vector. It is worth note that the “loss sensitivity factors” decide the sequence in which the buses are to be considered for compensation placement and the “
nor
i
” decides whether the bus needs Q-compensation or not. If the voltage in the bus sequence list is healthy (i.e.nor
i
>1.01), then the bus don’t need compensation that bus will not be listed in the “rank bus” vector. This offers the info about the possible potential or candidate buses for capacitor placement.IV.SHUFFLED FROG LEAPING ALGORITHM
The shuffled frog-leaping algorithm (SFLA) is an algorithm base on memetic meta-heuristic.it was brought forward and developed by Eusuff and Lansey in 2003. The shuffled frog-leaping root in the frog groups behavior of looking food. This algorithm uses the mode of memetic evolvement among frog subgroups in local exploration. The algorithm uses the shuffled strategy and allows the message changing in local exploration.
This algorithm combine the advantages of memetic evolvement algorithm and particle swarm optimization (PSO) The algorithm change message not only in the local exploration but also in the global exploration.so the local and the global are combined well in the SFLA. The local search makes memetic to transfer among the individuals and the shuffled strategy make memetic to transfer among the global. As genetic algorithm (GA) and PSO, SFLA is an optimization based on colony. The SFLA has good ability for the global exploration and it is easy to realize. The SFLA can resolve many non-linear, non-differentiable, multimode questions.
V RESULTS AND DISCUSSION
To illustratethe performance of the proposed SFLA method, it was tested on a 69-bus RDS and the results have been obtained to evaluate its effectiveness. It was programmed in MATLAB environment and run on a Pentium IV, 3-GHz personal computer with 0.99 GB RAM. The results obtained are explained as follows.Theproposedmethodwas testedon69-bus radial distributionsystem andresultshave been obtained toevaluateitseffectiveness. The algorithm ofthismethodwas programmedinMATLAB environmentand run onaPentium IV,3-GHzpersonal computerwith 0.99GBRAM.Theresults obtainedin thesemethodsareexplainedin thefollowingsections
69-BUS TEST SYSTEM
ISSN (Print) : 2320 – 3765 ISSN (Online): 2278 – 8875
I
nternational
J
ournal of
A
dvanced
R
esearch in
E
lectrical,
E
lectronics and
I
nstrumentation
E
ngineering
(An ISO 3297: 2007 Certified Organization)
Vol. 5, Issue 3, March 2016
Fig.2. IEEE 69 Bus Radial Distribution system
The base values are taken as 12.66kV and 100MVA. The sensitivity analysis method is used to select the candidate node for the installation of capacitor and the buses are ordered according to their values as (19, 22, 20, 21, 23, 24, 25, 26, and 27). Here the capacitor values are taken as a continuous variable. The capacitor allowable range is 100kVAr to 1000kVAr with step of 2kVAr. Top three nodes are selected as candidate locations (nodes 19, 22 and 20) to reduce the search space.
Fig.3. Voltage profile of 69 Bus RDS system before and after capacitor installation.
The fig.3 shows the improvement in the voltage profile of the system after capacitor installation. The amount to be injected in the selected nodes is optimized by SFLA. The amount of kVAr injected for the nodes is 900, 986 and 150 kVArrespectively. The power loss before and after capacitor placement are 221.67 and 168.8 kW respectively. The minimum and maximum voltages before capacitor placement are 0.9417(at bus 27) and 0.9941(at bus 2) in p.u which are improved to 0.9504 and 0.995 in p.u after capacitor placement respectively. The time needed by the CPU by proposed method is 3.07 sec. From the results obtain it can be said the proper installation of the capacitor improve the voltage profile of the system which in turn reduces the losses and minimizes the total cost of the system. The total cost reduces by 0.22% with capacitor in the bus from the buses without capacitor.
ISSN (Print) : 2320 – 3765 ISSN (Online): 2278 – 8875
I
nternational
J
ournal of
A
dvanced
R
esearch in
E
lectrical,
E
lectronics and
I
nstrumentation
E
ngineering
(An ISO 3297: 2007 Certified Organization)
Vol. 5, Issue 3, March 2016
Fig.4. Convergence Characteristics
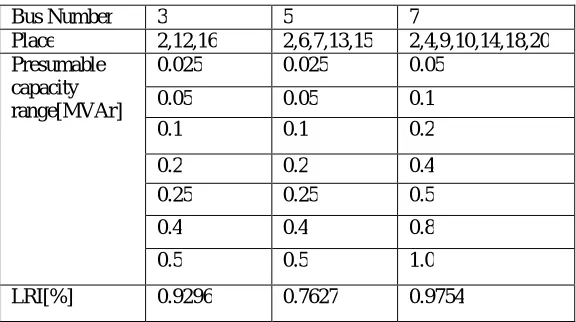
The optimal capacitor location and size are calculated for the selected bus and it is given in below table.The table gives the capacitor value that can be placed in the bus and the position in the selected bus. The buses selected are 3, 5, 7.
Table 1: Results summary of 69 bus RDS system
Capacitors are installed in these buses to improve the voltage of the system and to reduce the losses.
VI. CONCLUSION
In this paper, the capacitor placement problem is solved by using SFLA. Simulations are carried out on 69-Bus system and the result obtained by this method is better than the other methods in terms of quality of solution and computational efficiency. The main advantage of this algorithm is that it does not require external parameters such as cross over mutation rate etc., as in case of genetic algorithm, differential evolution and evolutionary algorithm and these are hard to determine in prior. The other advantage is that the global search ability in the algorithm is implemented by introducing neighborhood source production mechanism which is similar to mutation process.
REFERENCES
[1] Schmill J V, “Optimum size and location of shunt capacitors on Distribution Feeders”, IEEE Trans on PAS, vol.84, pp.825-832, Sept.1965.
[2] Dura H, “Optimum Number Size of Shunt capacitors in radial Distribution Feeders: A dynamic Programming Approach”, IEEE Trans. Power
Apparatus and Systems, Vol 87, pp.1769-1774, sept 1968.
Bus Number 3 5 7
Place 2,12,16 2,6,7,13,15 2,4,9,10,14,18,20
Presumable capacity range[MVAr]
0.025 0.025 0.05
0.05 0.05 0.1
0.1 0.1 0.2
0.2 0.2 0.4
0.25 0.25 0.5
0.4 0.4 0.8
0.5 0.5 1.0
ISSN (Print) : 2320 – 3765 ISSN (Online): 2278 – 8875
I
nternational
J
ournal of
A
dvanced
R
esearch in
E
lectrical,
E
lectronics and
I
nstrumentation
E
ngineering
(An ISO 3297: 2007 Certified Organization)
Vol. 5, Issue 3, March 2016
[3] Grainger J J and Lee S H, “Optimum Size and Location of Shunt Capacitors for Reduction of Losses on Distribution Feeders,” IEEE Trans on
PAS, Vol.100, No.3, pp.1105-1118, March 1981.
[4] Masoum M A S, Jafarian A, Ladjevardi M, Fuchs E F and Grady W M, “Fuzzy approach for Optimal Placement and Sizing of capacitor banks
in the Presence of Harmonics”, IEEE Trans on Power Delivery, vol.19, No.2, April 2004.
[5] Sudharajan and Palwa A, “Optimal Selection of Capacitors for radial Distribution Systems using Genetic algorithm,” IEEE Trans. Power systems, vol.9, No.3, pp.1499-1507, Aug. 1994.
[6] Baghzouz Y and Erten S, “Shunt Capacitor Sizing for Radial Distribution feeders with Distorted Substation voltages,” IEEE Trans Power delivery, vol.5, po.2, pp.650-657, Apr. 1990.
[7] Niknam T, Ranjbar A M, Arabian H and Mirjafari M, “Optimal Reactive Power Planing in Harmonic distorted power system using Genetic
Algorithm”, in proc.IEEE region 10 Conf…. pp.347-350,2004
[8] AbdelsalamEajal A and EI-Hawary M E, “Optimal Capacitor Placement and Sizing in Unbalanced Distribution systems with Harmonics
consideration using Particle Swarm Optimization”, IEEE Transactions on Power Delivery, vol.25, No.3, July 2010.
[9] Xin-mei-Yu, Xin-Yin Xiong and Yao-wu Wu, “A PSO based Approach to Optimal Capacitor Placement with Harmonic distortion consideration”,
Elect. Power syst. Res. Vol.71, no.1, pp.27-33, 2004.
[10] Fayzul Pasha, Kevin Lansey and MuzaffarEusuff, “Shuffled Frog Leaping Algorithm: A Memetic meta-heuristic for discrete optimization”, Energy Optimization, vol.38, No.2. 2006.
[11] AliniaAhandani M, and MashadiKastiban, “Various Strategies for Partitioning of memeplexes in shuffle Frog Leaping Algorithm”, 14th International CSI Computer Conference. 2009.
[12] BaopigGuo, Mei Yue, Tao Hu and XuanGuo, “The research Base on Memetic Meta- Heuristic Shuffled Frog Leaping Algorithm”, 2nd
International Conference on Power Electronics and Intelligent Transportation System.2009.
[13] JawadEbrahimi, SeyedHosseinHosseinian and GevorgGharehpetian, “Unit Commitment Problem Solution Using Shuffled Frog Leaping