Experimental and
S
imulation
S
tudy of
T
emperature and
T
elative
H
umidity
I
ndoor of the
B
uilding
I
mproved Iroko
M
aterial of
Douala, Cameroon:
C
onsideration in 3D
M
odelling of
T
hermal
B
ridge and
R
adiation
1*Adeline Chugoua Njamen1Energy Laboratory, University of Douala, Email: B.P 1872 Douala Cameroon
*Corresponding author,
[email protected]
2Louis Monkam2Laboratory of technologies and applied sciences, University Institute of Technology (IUT), University of Douala,
BP 8698 Douala Cameroon
3Alexis Kemajou,
3Laboratory of Refrigeration and Air Conditioning, Advanced Teachers Training College for Technical Education
(ENSET), University of Douala, B.P 1872 Douala Cameroon
4Félix Junior Ngouem
4Energy and Applied Thermal Laboratory of ENSAI, University of Ngaoundéré BP 455- Ngaoundéré Cameroon
Abstract
Use of material adapted climate of region contributed of the hygrothermal comfort reducing consumption of energy in buildings. The aim of work is to determine temperature and relative humidity indoor air of built wooden envelop essence Iroko improved. measurements series over a period of 2 months was performed using a LOG32TH thermohygrometer in experimental room in Douala. Data collected is treated in MATLAB 8.1. Then, numerical code equations transfer 3D was developed in variable regime, considering diffusion in material, convection and radiation on faces. The results show a real damping between outdoor and indoor of the order of 2.5°C for a drop relative humidity of 7%. relative error between simulated and experimental values are respectively in temperature and relative humidity,1.2% and 2.6%. We conclude that results obtained can help to optimize comfort in non-air-conditioned and thermal treatment of wood has an advantage, the regulation of humidity in hot and humid climate. Keywords: temperature, relative humidity, dew point, Iroko essence improved wood, thermal bridge, radiation, experimental, simulation.
1 Introduction
Negligence of analysis of the climatic effects on use of the energy led in the past decades to the design of the systems that today we qualify as energetic. Modeste Kameni et al., shows in his works that Building energy consumption increased by 14% between the 1970s and 2000s, and this demand is still growing if we look into 2033 [1]. Since in perpetual pursuit of thermal comfort, an objective aimed at its true value because knowing that it will bring him good health and better performance in the work, the man resorted to systems able to give him satisfaction [2]. Kemajou et al (2008), shows in his works that air conditioning, ventilation and air conditioning systems (HVAC) account for 50 to 70% of the electricity consumption of buildings [3] . Several researches in the field of the building were carried out on the search for solutions to adapt the best to the environment in order to obtain an acceptable
account local materials in accordance with the environment of the populations and the geographical area. Because the building is one of the most energy-intensive sectors after the business sector, the government today more than yesterday must take into account in housing construction projects in Cameroon [5] economic and ecological issues related to reducing the energy consumption of buildings. It is increasingly important to look at areas where the energy deposit is present. The building envelope, engine for controlling the thermohydric exchange between the inside and the outside, plays a very important role in the regulation of the temperature and relative humidity of the indoor environment. [6- 10]. The envelope is an essential factor in the success and improvement of thermal comfort in hot weather. One material is differentiated from another by its ability to absorb or restore heat. The difficulty of having a decent urban housing pushed most urban dwellers who do not have significant financial means to address the sector and found mechanisms of production of the habitat adapted to its purchasing power and its know-how from where abundant use Carabot. This used wood is not treated however in view of the statistics 52,6% on average of the population of the city of Douala uses it in the construction of the habitats. [11- 12].
The aim is not only to have a beautiful architecture of construction but the real problem raised is the existing adequacy between the thermal comfort which reigns in the building iroko envelop, the compatibility of the used building material and the design thermal envelopes taking into account the climatic zone. Different scales of studies are possible to carry out the works: microscopic scale (material, component of the material); macroscopic scale (building). Several works with different approaches and methods were conducted to understand and analyze the thermal and energy behavior in the building. Among them we can mention the analysis tools based on thermal simulations with software [13-17], the use of prediction models [18] or exploitation of data from experimentation [10]. Most models developed in thermal building conducts deterministic simulations that simulate the thermal behavior of the building with a single sequence of temperatures. However, we know that buildings have a thermal inertia and that the thermal behavior of the building at a given moment depends on the meteorological conditions. The present study is based Firstly, on the measurement of the temperature and the humidity reigning in a room with improved wooden envelope, then the simulation of the thermo-hydric behavior starting from the software FLUENT 6.3.26 and a numerical code of the 3D heat and moisture equation developed in MATLAB 8.1. We have chosen a horizontal wood paneled construction (Fig.2) which is up to the present time met much more in the offices of some companies of the city and yet can be extended to social habitats.
2. Material and method
2.1. Material
2.1.1. Climatic Conditions of Study Area
Cameroon is divided into three climatic zones, namely: the Sudanese, the Sudano-Sahelian and the Equatorial regions. Cameroon is characterized by an equatorial climate with two main seasons of equal amplitudes; a long rainy season from mid-March to mid-November and a short dry season from mid-November to mid-March [19]. The study was conducted in the equatorial cities of Douala (Coastal region), the economic capital of Cameroon. The city is located along the Atlantic Ocean, between 04° 01 Nord and 09° 44 East with an area of nearly 210 Km2.the
climate of Douala is characterized by temperatures between 18°C to 34°C; air is almost constantly saturated with moisture 99 % relative humidity during the rainy season against 80 % in the dry season. [18]
The local is built on the site of the University Institute of Technology (IUT), the University of Douala. The altitude of the city is 5 meters, the direction of the prevailing wind is southwest and its average speed varies between 1.8 m / s and 3.0 m / s.
Figure 1: study area
The wooden used in construction is Iroko under its scientific name Chlorofora Excelsa comes from sawmills in the city of Douala in Cameroon. It is hardwood category with a density between 700 and 900 kg / m3, the volume
shrinkage is < 0.44 %. The saturation point of the fibers is on average depending on the drying temperature between 23 % and 30 %.[20] The dimensions of the test room are shown in Figure 2. Length: 2.3 m; Width: 1.6 m; Height: 2.5 m; Thick Iroko wood envelope: 4 cm; Iroko wood door: 0.7 x 2.10 m2; Wooden window Iroko: 0.63 x 0.80 m2.
The whole room is made of wood an incline of 30° was applied during the assembly of the roof. Sawdust of wood was used to insulate the roof because in the literature the great heat input into the atmosphere comes from the roof.[21]
Figure 2: room test on the University of Douala, front view.
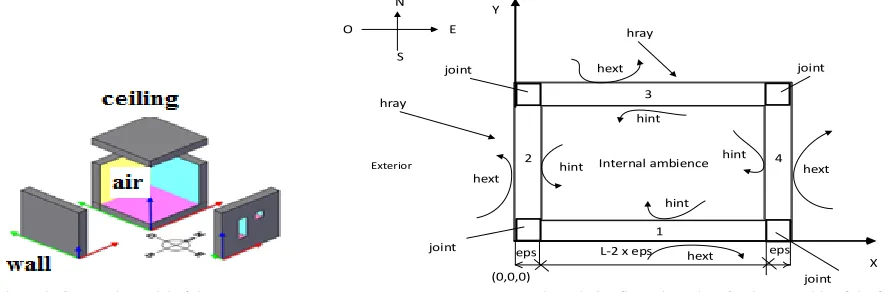
2.1.3. Building modeling
The physical model (figure.3) of the building in which our study is carried out is shown in figure 4. The walls are considered homogeneous and the roof is taken from the ceiling in contact with an untied roof.
Internal ambience
eps L-2 x eps eps
3
1
2 4
hext hext
hext
hext hray
hray
joint joint
joint joint
hint
hint
hint hint
Y
X N
S
O E
(0,0,0) Exterior
Figure 3:Geometric model of the room Figure4: Configuration adopt for the assembly of the frame We have neglected, convection between two layers of the building wall separated by an air and consider that the transfer at the joints is continuous. [22]
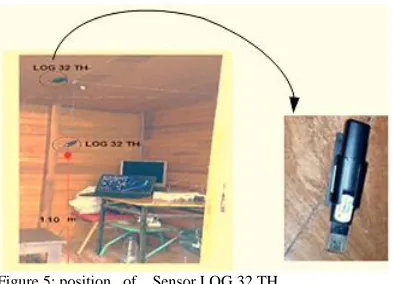
2.1.4. Equipment used
The characteristics of the measuring instruments used are shown in the table 1.
Table 1: characteristics of the measuring instruments
measuring device Range Precision
Thermohygrometer LOG 32 TH – 50°C to + 100 °C
and HR 0 % to 100 %
±0.1°C
Figure 5: position of Sensor LOG 32 TH
2.1.5. Measurement protocol
A crawl space has been provided between the floor and the floor. The measurements were made in the room in a calm atmosphere, door and window closed. The paneling is arranged horizontally in the constructive architecture. Measurements not only of the relative humidity and dry temperatures and dew point of the indoor air were made using a thermo hygrometer LOG 32 TH placed inside the room at 1.10m from the ground.[23] [9]. wooden comes from the Douala sawmills in Cameroon and dried to a moisture content of 12.5% in an industrial dryer. After acquiring the dried wood, we followed the steps below:
- Machining of parts in the workshop, in order to obtain paneling, set-up and assembly on the site, the wood-frame; - Installation of the LOG 32 TH thermo hygrometer in the room, test of the reliability of the measuring instruments and effective measurement of the dry temperature, the dew point and the relative humidity of the indoor air.
2.2. Method
2.2.1 Thermal Model of the temperature inside building
We start on the basis of the three-dimensional Fourier equation (eq.1) to model the transfers in materials.
2 2 2
( , , ) ( , , ) ( , , ) ( , , )
2 2 2
c
T
i j k xT
i j k yT
i j k zT
i j kt
x
y
z
(1)Initial conditions of the system are those of the building at the beginning of the observation
, , ,
0
iT x y z t
T
(2) The basis of a convective transfer on the different walls of the building and solar radiation in two faces following the configuration fig.4. Boundary conditions are present in equation 3.
.
int int.
1 2
, ,
,
, ,
0,
e surf ext e e ext
i surf i i
S
T
h S T T
rclo
S
T
h S T T
T x y z
H t
T
T x y z
t
T
(3)
The expressions of the numerical derivative of order at the various nodes of the mesh where the different flows are evaluated. Equations (4), (5) and (6) represent the expressions of the second derivative at the various nodes of the mesh
2
2 2
1, 2 , , 1, , ,
k k
T i j T i j k T i j
T i j k
x x
(4)
2
2 2
, 1 2 , , , 1 , ,
k k
T i j T i j k T i j
T i j k
y y
(5)
1
1
2
2 2
,
2
, ,
,
, ,
k k
T
i j
T i j k
T
i j
T
i j k
z
z
The numerical solution indoor air is present in equation 7.
,
,
1
1 6
1 6
t t t t t
k k
i j i j n
n
fo
T
T
T
fo
fo
(7)With:
1
2
3
4
5
6t t t t t t t t t t t t t t
n n
T
T
T
T
T
T
T
(8)and
1 1, 2 1,
3 , 1 4 , 1
1 1
5 , 6 ,
;
;
;
k k
i j i j
k k
i j i j
k k
i j i j
T
T
T
T
T
T
T
T
T
T
T
T
(9)
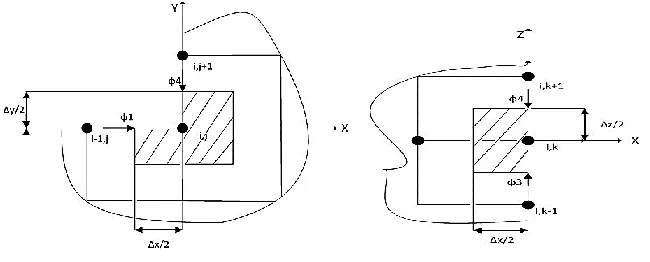
2.2.2. Thermal bridge model of the Building
Among the numerical resolution methods, we have chosen the finite difference method, which is based on two notions: the discretization of finite difference differentiation operators on the one hand, and the convergence of the numerical scheme thus obtained on the other hand. share. A partial derivative problem requiring a domain well circumscribing partial differential equations describing the physical phenomena observed, boundary conditions of the problems and initial conditions.
Figure 6: Expression of the different flows on the inside bulkhead: (a) function of length and width, (b) function of length and height
The temperature at any point of the edges has an expression different from that of the indoor air and is of order 1. All the flows applied in the bridges are represented by the equation
1 2 3 4 1 2 ,
k
i e L L ext i j
i
h S
S
T
T
(10)Expression of fluxes
1 1 1
, 1,
1
. , , .
2
T i j T i k T
S i j k S
x x
(11)
(12)
3 3 3
, , 1
1
. , .
2
T i k T i k T
S i k S
z z
(13)
4 4 4
, , 1
1
. , .
2
T i k T i k
T
S i k S
z z
(14)
5 5 5
, , 1
. 1, .
k k
T i j T i j
T
S j k S
y y
(15)
2 2 2
, 1,
1
. , , .
2
T i k T i k
T
S i j k S
x x
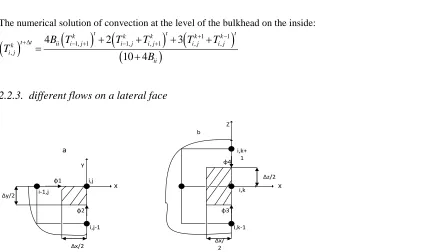
The numerical solution of convection at the level of the bulkhead on the inside:
1, 1
1, , 1
, 1 , 1
,
4
2
3
10 4
t t t
k k k k k
t t ii i j i j i j i j i j
k i j
ii
B T
T
T
T
T
T
B
(16)2.2.3. different flows on a lateral face
∆y/2
∆x/2 i,j
i,j-1
i-1,j X
Y
φ2
φ1 ∆z/2
i,k
I,k-1 i,k+ 1 Z
φ4
φ3
X
∆x/ 2 b
a
Figure 7: Expression of the different flows on the faces: (a) along the length and height, (b) according to the thickness and the height.
The model outdoor and inside of the bulkhead are present in equation. The temperature at any point of those edges has a different expression because of provider of the solar radiation of the exterior of faces.
1 2 3 4 5 ,
k
i e L i j ext rclo i
h S T
T
(17)
By replacing the different flows of equation by their different numeric expressions, we arrive at the equation (14)
1 1
1, 1, , ,
, 1 ,
.
2 3
k k k k
i j i j i j i j
k
io ext i j rclo
k i j
io
T T T T
s
B T T
T
B
(18)
The dimensionless Fourier and Biot numbers are:
Fourier number:
2
. . .
t fo
c s
(19)
Biot number:
.
io
h
s
B
(20)A simple algorithm is used to assemble the transfer equations in the envelope, the internal air mass and the boundary conditions of the problem
We have considered different mesh pitches in the thickness of the wall because it is much smaller in front of L and H and a slightly larger pitch in the air mass.
We consider a homogeneous and isotropic medium:
x
y
z
s
;x y z
.2.2.3. Model of relative humidity
Equation of the moisture flow inside the room
The evaluation method is based on the application of the isothermal diffusion equation, giving the expression of mass flux density, in the absence of gravitational effects, during the transfer.
2 2 2
2 2 2
C
k
k
k
t
x
y
z
(21)h a, K D C
(22)
The discretized expression of the equation of moisture in space and time:
, , , , 1, , 1, , , , , 1, , 1, , ,
2 2
, , 1 , , 1 , , 2
2
2
( , )
+
2
t t t i j k i j k
t t t t t t t t t t t t
i j k i j k i j k i j k i j k i j k
t t t t t t
i j k i j k i j k
C
a
k
t
x
y
z
(23)Modeling Convection on the faces
To model the convective transfer on the different lateral faces, we have discretized according to the diagram represented in fig. 2. The sum of the flows applied to the target node is equal to the convective flux at this node according to Newton's law and that radiative flux when the wall is sunny
0 int , , 0, , , ,m Ext mur
x
v mur m
x e
x t
h x t x t K
x x t
D h x e t x t
x (24) External Edges
1 1 , ,, 1 1, ,
2
2
3
2
k k
i j i j
k k
ie ext i j i j
k i j ie
B
T
B
(25)Internal Edge
1 1
1, 1 1, , 1 , ,
,
4
2
3
10 4
air
k k k k k
ii i j i j i j i j i j
k i j ii
B
B
(26)ext ie int ii
h
x
B
k
h
x
B
k
(27)Indoor air mass
1 11, 1, , , 0
, ,
0 0
1
1 6
1 6
2
t t
k k k k
t t t i j i j i j i j
k k
i j i j
f
f
f
(28) 0 2 D t f x (29)
Table 2: Parameters used for simulation of temperature Materials Thermal
conductivity W/m. K Specific heat J/Kg. K Density Kg/m3
Envelop Wood 0.29 in 15% moisture
2700 869
Envelop Clay brick
1 1000 1850
Envelop Cinder block
Ceiling Roof+ plywood
0.14 1600 600
Ground 0.29 2700 869
Roofing 0.14 1600 600
Air 0.0262 1006 1.29
Table 3: Parameters used for simulation relative humidity Materials Water convection coefficient
Kg/m2
Resistance water m2. s/kg
Wood 0.02973 28.6
air 1.1.04 2.5
For all simulations, the convergence control is done using convergence thresholds. These are residues resulting from the iterative resolution of the system of equations. the temperatures will be imposed on the ceiling and floor. The mesh is 17 x 17 x 21 and initial temperature Ti is 26 °C. The external and internal convections were considered to be natural coefficient 23 W/m2.K and 8 W/m2.°C for model of temperature and 0.015 Kg/m2outside 0.081 Kg/m2
inside for relative humidity. Because unventilated atmosphere the solar flux varies depending on the latitude, the orientation of the wall and the time we are in, considering that we are around 4° north latitude. [15]
2.2.4. Typical day used for simulation
We have to get this curve presenting the typical day considered. This result is obtained from the experimental data measured over six months, period from October 2017 to March 2018. We considered the curve that is closer to the average of the points recorded. To obtain the typical day we have from experimental data on 6 months find the average points. The day corresponding to the day whose values are closest to the calculated average. [24]
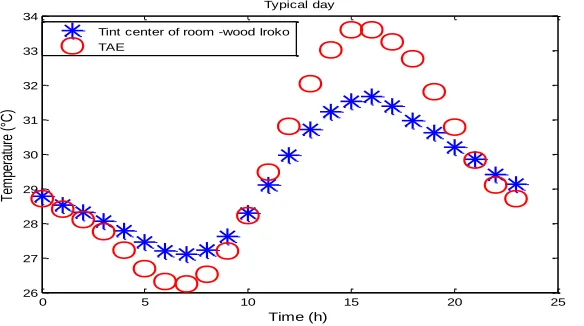
Figure 8: Typical day temperature measured
we having a warmer atmosphere at night, there is a real phase difference between indoor and outdoor temperatures. While we reach the maximum outside at 15h we reach that of the interior one hour later.
0 5 10 15 20 25
26 27 28 29 30 31 32 33 34
Time (h)
Te
m
pe
ra
tu
re
(°C
)
Typical day
Figure 9 : Damping per hour between internal and external values day typical of temperature for a room in iroko wood
A phase difference between the external conditions and the interior of the envelop of the order of 2.2°C.
The maximum and minimum temperature values of the outside typical day obtained are close to the data presented by Kameni in his work concerning the city of Douala: range [36°C - 28.9°C] dry season and up to 26.5°C for the rainy season.[19]
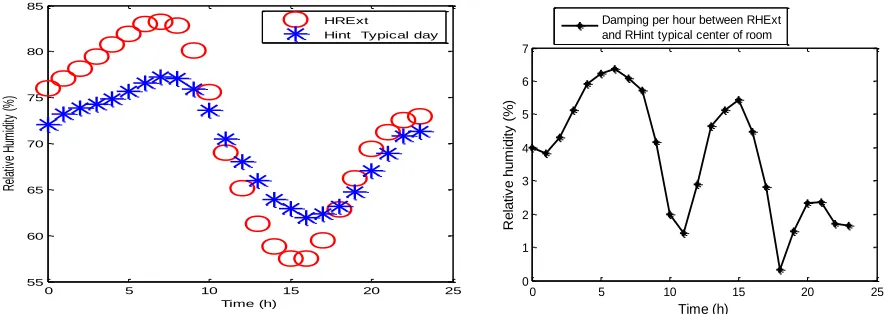
Figure 11 : Damping per hour between internal and external values day Figure 10 : Typical day relative humidity measured
Damping per hour of RH is 6.62%. the Relative humidity is well regulated in the wooden room.
3. RESULTS AND DISCUSSION
3.1. In Situ Measurements
There is no wet surface when observing dew temperatures (Figure 12). In this period when we had a lot of sunshine in the first days of June and rain at the end of the month, we can see the variation of the amplitudes of the outside temperature. On the other hand, the internal conditions have less pronounced amplitudes.
In order to better observe the influence of the indoor air dew temperature measurements were made between July 23 and August 29, 2018. Figure 13.
0 5 10 15 20 25
0 0.5 1 1.5 2 2.5
Time (h)
Te
m
pe
ra
tu
re
(
°C
)
Damping per hour between TAE and Tint typical day
0 5 10 15 20 25
55 60 65 70 75 80 85
Time (h)
Re
la
tiv
e
Hu
m
id
ity
(%
)
HRExt
Hint Typical day
0 5 10 15 20 25
0 1 2 3 4 5 6 7
Time (h)
R
e
la
ti
v
e
h
u
m
id
it
y
(%
)
Figure 12: Measure of temperature- data from June 6 to 22, 2018
The figure 12 shows the relative humidity data from June 6 to 22, 2018
Figure 13. Measure of temperature- data from June 6 to 22, 2018
In figure 12 et 13, outside maximum and minimum values recorded for this measurement period are respectively 38.3°C and 89.5% RH, 23°C-44.2%.the indoor maximum and minimum values recorded are 32.8°C and 79.2% RH, 26.7°C , 60.1%. The average outside is 31.5°C ,77.5% and inside is 29.3°C to 69.8% RH. The dew point of the air is respectively 19.9°C minimum, 26.8°C maximum and 23.1°C average.
The coupled study of the temperature and the relative humidity in the building made of wood species is very important for control of the performance envelope and thus to exploit the thermo-hydric response in the analysis of the ambient comfort knowing when it has been subjected to variable conditions.
Figure 14: comparison between data measured values of the temperature inside, relative humidity and dew point at center of room The maximum values recorded for this measurement period are respectively 22.6°C and 88.3% RH. the minimum values are 23.5°C and 59.6% RH. The average is 26.6°C to 76.9% RH. The dew point of the air is respectively 19.7°C minimum, 26.2°C maximum and 22.1°C average.
0 50 100 150 200 250 300 350 400 450
15 20 25 30 35 40
Time (h)
T
e
m
p
e
ra
tu
re
(°C
)
TAE Tint
dew point outdoor dew indoor
0 50 100 150 200 250 300 350 400 450
40 50 60 70 80 90
Time (h)
R
e
la
tiv
e
h
u
m
id
ity
(%
)
RHExt RHint
0 50 100 150 200 250 300 350 400 450 500 550 600 650 700 750 800 850 900 950 1000 20
22 24 26 28 30 32 34 35
Time (h)
T
em
pe
ra
tu
re
(°C
)
0 100 200 300 400 500 600 700 800 900 100040
60 80 100
For this period of measurement (figure 14) there are several areas where we could see a priori appear wet surfaces. We observe that it is in this period in the city of Douala where we often see successive days of rain over several non-stop days.
Temperature is easier to sense and quantify but relative humidity is delicate and can have significantly affect: thermal comfort, perception, occupant health, energy consumption and durability of building materials [2], [25]. The measurement of the dew point temperature shows us that if we neglect the treatment of wood materials, the structure will be affected, hence the choice of the heat treatment below the fiber saturation so that subject to the different variations, there is no water recovery by the envelop.
3.2 Comparison between Simulated and Measured Values of ambient temperature and relative humidity
We present in Figures 15 and 19 the result of simulated and measured values. The different errors calculated by the equations 27,28 et 29 are represented by the figures 16,17,18,20, 21 and 22.
Figure 15: comparison between simulated and measured values of the temperature at the center of the room according to TAE
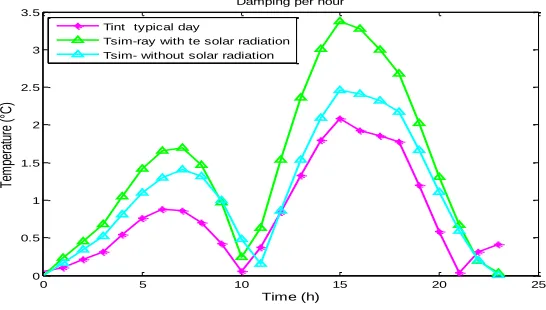
By analyzing Figure 15, we conclude that it is wise to predict the behavior of the building to consider solar radiation on the faces when there is no sunscreen or shading all around. a not inconsiderable difference is observed, 1.5°C, between the consideration of a wall with simple convection and convection and radiation.
Figure 16: Damping per hour between simulated and measured values of the temperature in the center of the room according to TAE
The relative error between experimental and simulation is calculated using the equation
0 2 4 6 8 10 12 14 16 18 20 22 24 25
26 27 28 29 30 31 32 33 34
Time (h)
Te
m
pe
ra
tu
re
(°C
)
Tsim-ray center of room with solar radiaton Tint typical day
Tsim center of room without solar radiation TAE
0 5 10 15 20 25
0 0.5 1 1.5 2 2.5 3 3.5
Time (h)
Te
m
pe
ra
tu
re
(°C
)
Damping per hour
Tint typical day
int int int 1 100 Exp sim i Expy i y i
Er
N y i
(27)
int int1
Exp sim i
Ea
y
i
y
i
N
(28)2 1 2 1 N i i N i i y t R square t t (29)
The relative error values of temperature in the center of room are of the order of 1.23% taking into account the solar radiation and 2.26% without solar radiation.
Also, the absolute error values of temperature in the center of room are of the order of 0.36 °C taking into account the solar radiation and 0.67°C by negligent solar radiation.
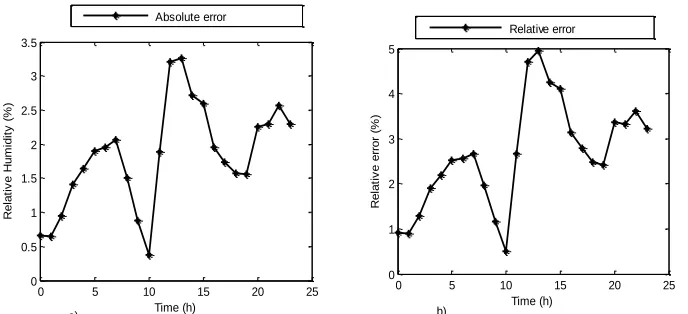
Figure 17: error per hour between simulated and measured values of the relative humidity in the center of the room: a) Absolute and b) relative error.
Figure 18. Square error of indoor temperature
0 5 10 15 20 25
0 0.2 0.4 0.6 0.8 1 1.2 1.4 Time (h) A bs ol ut e er ro r (° C ) Tint typical-Tsim-RAY
Tint Typical-Tsim-without solar radiation
0 5 10 15 20 25
0 0.5 1 1.5 2 2.5 3 3.5 4 4.5 Time (h) R el at iv e er ro r (% ) Tint Typical-TSIM-RAY
Tint TYPE-TSIM-without solar radiation
0 5 10 15 20 25
0 0.2 0.4 0.6 0.8 1 1.2 1.4 Time (h) A b s o lu te e rr o r (° C ) Tint typical-Tsim-RAY
Tint Typical-Tsim-without solar radiation
0 5 10 15 20 25
0 0.5 1 1.5 2 2.5 3 3.5 4 4.5 Time (h) R e la ti v e e rr o r (% ) Tint Typical-TSIM-RAY
Tint TYPE-TSIM-without solar radiation
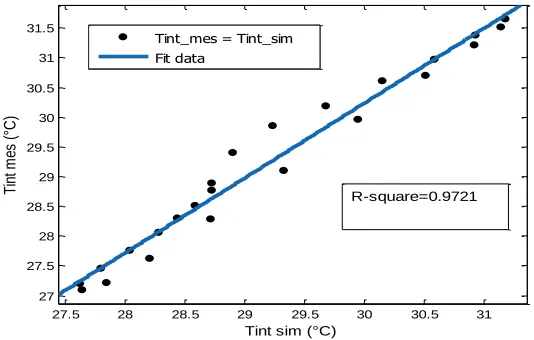
27.5 28 28.5 29 29.5 30 30.5 31
27 27.5 28 28.5 29 29.5 30 30.5 31 31.5
Tint sim (°C)
T in t m es (°C )
Tint_mes = Tint_sim Fit data
Figure 19: comparison between simulated and measured values of the relative humidity in the center of the room according to RHExt
The relative error value of relative humidity in the center of room are of the order of 2.6%. Also, the absolute error values are of the order of 1.82%. We observe that differences remain; this can be explained by the use of porous and hygroscopic materials in the construction of the envelop.
Figure 20 : damping per hour between simulated and RHExt
Figure 21: Error per hour between simulated and measured values of the relative humidity in the center of the room, a) Absolute, b) Relative error.
0 5 10 15 20 25
55 60 65 70 75 80 85
Time(h)
R
e
la
ti
v
e
H
u
m
id
it
y
(
%
)
Hsim Hint RHExt
0 5 10 15 20 25
0 1 2 3 4 5 6 7
Time (h)
R
e
la
tiv
e
h
u
m
id
ity
(%
)
Damping per hour between RHExt and RHint typical center of room
0 5 10 15 20 25
0 0.5 1 1.5 2 2.5 3 3.5
Time (h)
R
e
la
ti
v
e
H
u
m
id
it
y
(
%
)
Absolute error
0 5 10 15 20 25
0 1 2 3 4 5
Time (h)
R
e
la
ti
v
e
e
rr
o
r
(%
)
Relative error
Figure 22.: Square error of indoor RH
3.3 Observation of the behavior of the relative humidity on the wooden envelope
The Fig. 23 presents the profile of relative humidity on the vertical wall exposed to the sun at a x=0.6 m y= 1.3 m.
Figure 23: Relative humidity profile on the vertical wall a x=0.6 m y= 1.3 m
Figure 24: a) Distribution of the humidity on the faces at h=1.25 m: outside surface b) Distribution of the humidity on the faces at h=1.25 m: outside surface
The consideration of a refinement is necessary in the modeling of the transfer of heat and humidity of the physical phenomena in the building in order to better get closer to the reality.
3.4 influence of other materials on the thermal response with consider Thermal bridge
60 65 70 75 80
62 64 66 68 70 72 74 76 RHint-sim (%) R H in t-m es (% )
RH mes = RH sim Ajustement des données
R-square=0.9745
0 0.5 1 1.5 2 2.5
0 10 20 30 40 50 60 70 80 Heigth (m) R el at iv e H um id ity (% ) Face outside Face inside
0 0.2 0.4 0.6 0.8
37 38 39 40 41 42 43 44 45 46 47 Length(m) R el at iv e H um id ity ( % )
Face outside - wood
0 0.2 0.4 0.6 0.8
40 42 44 46 48 50 52 Length(m) R el at iv e H um id ity ( % )
Face inside - wood
0 0.2 0.4 0.6 0.8
37 38 39 40 41 42 43 44 45 46 47 Length(m) R el at iv e H um id ity ( % )
Face outside - wood
0 0.2 0.4 0.6 0.8
40 42 44 46 48 50 52 Length(m) R el at iv e H um id ity ( % )
The profiles found are consistent with those of Mokhtari's work for the case of red brick. On the other works of Mba et al. (2012) for a wood building, the is a difference. this can be explained by the influence of the essence of the used wood material (inertia), and the heat treatment that has been applied to it.
We present in Fig.25 the evolution of the temperature field in the room at different fixed Z values. Z represented the hauteur of our space of work.
Figure 25: Temperature field in the room at different fixed Z values equal 1.25 m a) wood b) cinder block c) clay brick
Figure 26: Temperature profile in the vertical of the wall at h=1.125 m: a) Outside b) Inside
The stratification of the temperature is more important for the profile of the wood than for the clay brick and the cinder block, the latter acting in the same way figure 25. this confirms the thermal filter which is the wood material compared to the others and therefore better in lime climate because during the external thermal fluctuations, the interior remains regulated. The works of Kemajou and Mba [26] emphasize that the wood copies the conditions; This is related to the leakiness of the envelope.
3.4 Influence of solar radiation
The 3D distribution of the temperature in the whole room is represented below with the observation of the radiation received on one of the faces Fig .27 et 28.
Width (m) L e n g th (m ) Wood iroko
0 0.4 0.8 1.2 1.6 0 0.34 0.62 0.9 1.18 1.46 1.74 2.02 2.3 width (m) Longueur ( m ) clay brick
0 0.4 0.8 1.2 1.6 0 0.34 0.62 0.9 1.18 1.46 1.74 2.02 2.3
width (m)
Longueur
(
m
)
cinder block
0 0.4 0.8 1.2 1.6 0 0.34 0.62 0.9 1.18 1.46 1.74 2.02 2.3 28 28.5 29 29.5 30 30.5 31 31.5 28 28.5 29 29.5 30 30.5 31 28 28.5 29 29.5 30 30.5 31 c) b) a)
0 0.5 1 1.5 2 2.5
20 22 24 26 28 30 32 Heigth (m) T e m p e ra tu re ( °C )
0 0.5 1 1.5 2 2.5
20 23 25 27 29 32 34 Heigth (m) T e m p e ra tu re ( °C
) Wood iroko
clay brick
cinder block Wood iroko
clay brick cinder block
a) b)
0 0.5 1 1.5 2 2.5
20 22 24 26 28 30 32 Heigth (m) T e m p e ra tu re ( °C )
0 0.5 1 1.5 2 2.5
20 23 25 27 29 32 34 Heigth (m) T e m p e ra tu re ( °C
) Wood iroko
clay brick
cinder block Wood iroko
clay brick cinder block
Figure.27: One face sunny beginning of observation of heat flow Figure 28: Heat flow propagation in the room with sunny side
It is found that the temperature decreases from this face towards the inside Fig. 27 and higher in the center of a plane than peripheral after a moment of 24h Fig 28. This result shows well that the face which undergoes the sunshine sees its highest temperature and that the room behaves like a heat accumulator. outside temperatures close to the sunny wall, the values in the center of the room are between 300.76 and 302.56 K. It is clear in this case that a controlled construction in wood material would contribute to the control of the energy consumption in the room.
4. Conclusion
Thermal analysis by simulation makes it possible to analyze and interpret the thermal phenomena which develop simultaneously through the envelope, influencing the indoor, and during which occur rapid thermal events (dynamic). It brings together potential evaluation criteria that can improve thermal comfort. The results presented are similar to those encountered in the literature. It is clear from the previous analyses that the envelope of iroko wood material, within the framework of the study, has an inertia allowing to contain the variations temperature of 2.5°C at 4 p.m. for a drop relative humidity of 7% when external are attempt to 3.p.m. It is clear in this case that a controlled construction of wood material would contribute to the control of energy consumption in the premises. The models obtained will have to provide an alternative solution of a room adapted to cities with high humidity levels in the air; extension in the construction of social housing in Cameroon is strongly encouraged because the results sufficiently demonstrate that the conditions of thermal comfort can be better controlled and the wood material used is less CO2 producing, unlike the cinder block too coveted thus protecting the environment. ( C.R. Rémond et
al.,2015)
REFERENCES
[1] M. K. Nematchoua and G. R. Roshan, “Climate change and its role in forecasting energy demand in buildings : A case study of Douala City , Cameroon,” no. March, 2015.
[2] C. J. Simonson and M. Salonvaara, “Improving Indoor Climate and Comfort with Wooden Structures,” 2001.
[3] Alexis Kemajou, “Le confort thermique dans les bâtiments Les fiches techniques PRISME (Programme International de Soutien à la Maîtrise de l’Énergie).”
[4] T. R. Djongyang N., “An investigation into thermal comfort and residential thermal nvironment in an intertropical Sub-Saharan Sfrica region: fiel study report during the Harmattan season in Cameroon.” pp. 1391–1397, 2010.
[6] I. Nardi, T. de Rubeis, E. Buzzi, S. Sfarra, D. Ambrosini, and D. Paoletti, “Modeling and Optimization of the Thermal Performance of a Wood-Cement Block in a Low-Energy House Construction,” Energies, vol. 9, no. 9, p. 1, 2016.
[7] J. Borderon, R. Cantin, and J. Virgone, “Etude du comportement thermique dynamique de l ’ enveloppe non isolée du bâtiment : cas des murs inertes,” pp. 1–8, 2007.
[8] A. Dugu, P. Lagi, and L. Trefle, “Evaluation des risques liés à l’humidité dans le cas d’une isolation thermique par l’intérieur de murs anciens : étude de cas.,” pp. 1–8, 2012.
[9] A. Kémajou, L. Mba, and P. Meukam, “Application of Artificial Neural Network for Predicting the Indoor Air Temperature in Modern Building in Humid Region,” vol. 1, no. 4, 2011.
[10] A. Piot, C. Abelé, M. Woloszyn, and J. Brau, “Cellule expérimentale en vraie grandeur pour la validation des outils de simulation thermo-hygro-aérauliques,” Conférence IBPSA Fr. 2008, pp. 1–8, 2008.
[11] C. Pettan and P. Vermande, “L ’ impact du secteur informel dans la production de l ’ habitat au Cameroun,” vol. 31, no. 4, pp. 883–903, 1995.
[12] A. M. O. MBIDA, “Institut de Formation et de Recherche Demographiques,” vol. 5, 2010.
[13] S. Medjelakh and D. Abdou, “Impact de l’inertie thermique sur le confort hygrothermique et la consommation énergétique du bâtiment,” Rev. des Energies Renouvelables Vol 11 N°3, vol. 11, pp. 329– 341, 2008.
[14] L. Chahwane, “Thèse : Valorisation de l’inertie thermique pour la performance énergétique des bâtiments,” pp. 1–222, 2011.
[15] P. Tittelein, “Environnements de simulation adapté a l etude du comportemen energétique des bâtiments basse consommation,” 2012.
[16] H. Rafidiarison, R. Rémond, A. Nicolas, and E. Mougel, “Etudes expérimentale et numérique du comportement hygrothermique des matériaux hygroscopiques,” Conférence IBPSA-France, 6 au 8 juin,
Chambéry, 2012.
[17] F. Antretter, J. Randon, and M. Pazold, “Coupling of Dynamic Thermal Bridge and Whole-Building Simulation,” Therm. Perform. Exter. Envel. Whole Build. XII Int. Conf., 2013.
[18] L. Mba, P. Meukam, and A. Kemajou, “Application of artificial neural network for predicting hourly indoor air temperature and relative humidity in modern building in humid region,” Energy Build., vol. 121, pp. 32– 42, 2016.
[19] R. T. Modeste Kameni, Gholamreza Roshan, “Impact of Climate Change on Outdoor Thermal Comfort and Health Hin Tropical,” no. April, 2014.
[20] TROPIX7, “Description du bois IROKO,” CIRAD, pp. 1–4, 2012.
[21] F. Fodoup, C. Vincelas, T. Ghislain, and T. Robert, “Effects of the type of building materials on the thermal behavior of building in the hot dry climates : a case study of Maroua city , Cameroon,” vol. 4, no. 3, pp. 1– 13, 2017.
[22] A. M. Chikhi, Azeddine Belhamri, Patrick Glouannec, “Hygro-thermal behaviour of porous building material subjected to different external temperature and humidity conditions,” Jounale Eng. Sci. Technol., vol. 11, no. 4, pp. 458–475, 2016.
[23] A. C. Njamen and A. K. L. Monkam, “Etude expérimentale du comportement thermique d' un local avec enveloppe en bois Iroko dans la ville de Douala au Cameroun,” vol. 21, pp. 217–230, 2018.
[24] D. Luna-sanchez, “Docteur l’École Nationale Supérieure d' Arts et Métiers,” 2008.
[25] N. Modeste Kameni and R. Tchinda, “Comparative Study on the Subjective Response Versus Physical Measure on Air Humidity in Some Modern and Traditional Buildings of Cameroon,” no. March, 2015. [26] A. Kemajou and L. Mba, “Matériaux de construction et confort thermique en zone chaude Application au
cas des régions climatiques camerounaises,” vol. 14, pp. 239–248, 2011.
[27] C. Distribués et al., “Modélisation du Comportement Thermique d’une Maison Bois à l’Aide de Micromodèles,” no. March 2015.
Nomenclature
i
: Heat flux at the node i (W/ m2) T : Temperature of the walls (°C or K)a
T : Indoor temperature (°C)
i
T : Initial temperature (°C)
AE
T : Outdoor temperature (°C)
max
T : Maximum temperature during the day
min
Sim
T
: simulate temperature (°C)int
T
: typical inside day temperature (°C) D: Diffusivity in the materialRHExt: Outdoor relative humidity (%)
RHint experimental internal relative humidity (%) hextexternal convection coefficient (Kg/m2)
Ray
: solar radiationhm: external water coefficient
rclo
: short wave solar flux fo : Fourier numberB
: Biot number,
,
,
x
y z
t
: Space and time interval (m), (s)t
: Time (s) h: Time (h) Si: Inside surface Se: Outside surfaceEr: relative error
Ea: absolute error
SUBSCRIPT
, ,
i j k
: Indices of coordinatesii: inside
ie : outside