ISSN (Print) : 2320 – 3765 ISSN (Online): 2278 – 8875
I
nternational
J
ournal of
A
dvanced
R
esearch in
E
lectrical,
E
lectronics and
I
nstrumentation
E
ngineering
(A High Impact Factor, Monthly, Peer Reviewed Journal) Website: www.ijareeie.com
Vol. 7, Issue 8, August 2018
Use Data Mining and Statistical Analysis to
Improve the Efficiency of the Three-Phase
Induction Motor Based on the Power Factor
Hamza Saad
Ph.D. Candidate, Dept. of System Science and Industrial Engineering. Binghamton University. USA
ABSTRACT: Three-phase induction motors play a vital rule in the industry and production operations. Machines may get external or internal problems because of the daily job and overload running. External problems might come from bad maintenance, humidity, high temperature, and bad using, and internal problem or technical problem may be happened due to fail in any internal part. Machines need suitable power electricity and optimum utilization to give high productivity, but for old machines, it is very complicated to get optimum utilization. In order to improve the efficiency of the machines, the study focuses on many electrical factors which have a real impact on the machine performance. Six variables (Power losses, Voltage, Real power, Current, Resistance, and Apparent power) used as input and one variable (Power factor) used as a dependent. Electrical equations used to complete missed data by calculating the missed variable from known variables. A decision tree (C4.5) applied to solve data in the regression model to extract the vital impact on the power factor.Next, feature selection applied to rank the best factors using the measures of P-value and F-P-value. Finally, correlation matrix conducted to see whether this relationship is negative or positive because in the solution; Power losses and Current variables have the highest impact on the power factor,but correlation matrix says that these variables have a negative impact on the power factor.According to the results, Real power, Voltage, and Resistance have a positive impact on the power factor and the efficiency of the machine. Apparent power does not give a significant impact. Therefore, the efficiency of the machine and power factor can be improved by an increase in the utilization of Real power and Voltage, and reduce the heat (from current) and the losses in the power of the machine by focusing on the positive relationship.
KEYWORDS, Electrical Equations, Decision tree, Feature Selection, Correlation matrix, Three-phase induction motor.
I. INTRODUCTION
The three-phase induction motor is simple in construction, rugged, low cost and easy to maintain. It runs at a constant speed from no-load to the full load. Therefore, these motors are frequently used in the industry operations.The motor has self-starting and no capacitor needs, start winding, centrifugal switch or another starting device. There are two types, slip ring motors and squirrel cage. Squirrel cage motor is widely usedin Libyan factories. Slip ring motor requires external resistors to get highly starting torque. The efficiency is based on the losses within the motor through conversion of electrical power to the mechanical energy. The essential loss comes from stator resistance loss which is the product of the square of the current multiplying by the stator winding resistance. The rotor also experiences (IR)I losses in the squirrel-cage rotor bars, named rotor resistance loss (rotor (IR)I).
ISSN (Print) : 2320 – 3765 ISSN (Online): 2278 – 8875
I
nternational
J
ournal of
A
dvanced
R
esearch in
E
lectrical,
E
lectronics and
I
nstrumentation
E
ngineering
(A High Impact Factor, Monthly, Peer Reviewed Journal) Website: www.ijareeie.com
Vol. 7, Issue 8, August 2018
However, old machine with low efficiency needs to study and extract more variables that have an impact on the power factor. The study aims to improve the efficiency of the machine by collecting all variables that have a real negative and positive effecton the efficiency. However, why did power factor select as the dependent variable in the solution of machine efficiency? Regarding the answer to the question, when current and voltage are out-of-phase, the COS (cosine) of the angular displacement is named the power factor (PF); displacing the voltage waveform from the current waveform reduces the electricity's effectiveness in doing work. In the study, many variables have a negative impact on the power factor also have a negative impact on the efficiency of machines such as power losses and high value of current which leads to increase the heat in the motor.
II. METHODOLOGY
Power factor has selected as the main impact on the performance of the three-phase induction motor.Six variables applied as input and one variable applied as the output. Decision tree used to solve data and extract the main knowledge about the whole process.Then, feature selection applied to rank each variable based on its effect on the output. Correlation matrix used to extract the nature of the relationship between variables.
III. DATA EXPLORATION
Data is collected based on the real tests conducted on the three-phaseinduction motor, and electrical powerequations. The data is for 31 instances with six input variables and one output. Following five equations applied to confirm and measure miss values in the whole dataset because some columns did not get by real measure but by applying electrical equations [5].
P = V*I*Cos θ (to calculate real power) ……….. (1)
S= V*I (to calculate apparent power) ………. (2)
There is another type of power calls the Reactive power (VAR), Q = V * I * Sin………. (3)
= (ohms)………. (4)
( ) = ( )
( )……… (5)
These variables will define as follows:
Real power (W).It is the time average of the instantaneous product of voltage and current.It measures in Watts.
Apparent power (VA).It is the product of the root mean square volts,androot means square amps.It measures inVolt-Amps.
Voltage. It isadifference in the charge between two points. It measures in Volt.
Current.It is a rate at which charge is flowing. It measures in Ampere.
Resistance.It is a tendency of the materialto resist the charge flow (current). It measures in Ohms.
Power factor (PF ). It is the ratio between apparent power and real power.
PF= -1 means that all the power consumed in the system is the real power.
A load with PF=1 mimics a resister, and Reactive power draw is zero
-Some loads such as electronic devices have low power factors, which request more reactive power from the electric grid.
ISSN (Print) : 2320 – 3765 ISSN (Online): 2278 – 8875
I
nternational
J
ournal of
A
dvanced
R
esearch in
E
lectrical,
E
lectronics and
I
nstrumentation
E
ngineering
(A High Impact Factor, Monthly, Peer Reviewed Journal) Website: www.ijareeie.com
Vol. 7, Issue 8, August 2018
-PFC is conducting by injecting reactive power into the electric system.
IV. DATAMININGAND STATISTICAL ANALYSIS
A. DECISION TREE (C4.5 ALGORITHM)
Decision tree conducts a regression or classification models by building a tree structure. It is breaking down the dataset into smaller subsets, and simultaneously the associated decision tree is incrementally developed. The ultimate result is a tree with leaf nodes and decision nodes. A decision node (e.g., Power Loss) has two branches (e.g., Power Loss, and Real Power). Leaf node (e.g., Power Factor) represents a regression or decision. The topmost decision node in a tree which is corresponding to the best predictor named root node. Decision trees can handle both numerical and categorical data [7].
The basis of the algorithm tobuild decision trees named ID3 by J. R. Quinlan which modified a top-down, greedy search through the space of possible branches with no backtracking. ID3 uses Entropy and Information Gain to construct a decision tree. In ZeroR model there is no predictor, in OneR model we try to find the single best predictor, naive Bayesian includes all predictors using Bayes' rule and the independence assumptions between predictors,but decision tree includes all predictors with the dependence assumptions between predictors [7].
B. FEATURE SELECTION
In data mining feature selection used to extract essential variables impact on the output. Many algorithms of data mining have feature selection such as random forests tree, lasso and boosted tree. Each algorithm has a special ability to define essential variables and rank them based on the effect of the final solution. Feature selection applied in the study to extract the primary effect on the power factor of the three-phaseinduction motor.
C. CORRELATION MATRIX
Linear correlation is quantifying the strength of a linear relationship between two numerical factors. When there is no relationship between two factors, that means there is no tendency for the values of one quantity to decrease or increase with the values of the second quantity.
r is only measuring the strength of a linear correlation and is always its value between -1 and 1 where -1 represents a perfect negative linear correlation,and +1 represents a perfect positive linear correlation,and zero is no linear correlation between variables [7].
V. RESULTS AND DISCUSSION
A. APPLICATION OF DECISION TREE
ISSN (Print) : 2320 – 3765 ISSN (Online): 2278 – 8875
I
nternational
J
ournal of
A
dvanced
R
esearch in
E
lectrical,
E
lectronics and
I
nstrumentation
E
ngineering
(A High Impact Factor, Monthly, Peer Reviewed Journal) Website: www.ijareeie.com
Vol. 7, Issue 8, August 2018
square (0.884). All these values indicate that the algorithm dealt with data in a sophisticated way. Values in table 1 present how this algorithm works to analyze data by respecting all input variables based on the output. Observed data and predicted data are very close and residual values arevery smallbecause of small error and high R square value.
Algorithm MSE RMSE MAE R² C4.5 0.006 0.075 0.066 0.884
Table 1 Output results for decision tree
Figure 1 Tree diagram
From tree diagram, there is a strong impact on power factor from (Loss) because the yellow side included high values of power factor and at the blueside, there is little impact on the power factor from (Apparent power).
In figure 2, there is impact scale based on the color such as the ultimate value of power factor in yellow scale and the lowest value of power factor at the blue scale. By joining figure 1 with figure 2, the highest impact on the power factor came from (Loss variable),and the lowest impact on the power factor came from (Apparent power variable).
ISSN (Print) : 2320 – 3765 ISSN (Online): 2278 – 8875
I
nternational
J
ournal of
A
dvanced
R
esearch in
E
lectrical,
E
lectronics and
I
nstrumentation
E
ngineering
(A High Impact Factor, Monthly, Peer Reviewed Journal) Website: www.ijareeie.com
Vol. 7, Issue 8, August 2018
B. USE A FEATURE SELECTION
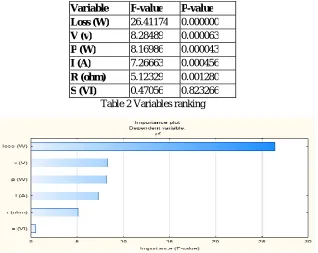
Feature selection in data mining applies to select and rank input variables (Loss, Voltage, Real power, Current, Resistance, and Apparent power) that impact on the Power Factor with the different levels. Some software like Weka has many algorithms for features selection,but the important algorithm is Wrapper feature selectioncannot extract the whole idea. However, variables in that program ranked in the sequence numbers based on the importance of each input variable without giving details for F-statistic, R-square, and P-value. In Statistica 13.3 software, results have modified to get the best essential variables based on P-value and F-value results and by respecting each variable effect. Table 2 shows ranked input variables based on Power Factor response. From table 2, Loss (W) has ranked on the top of the importance, then Voltage, Real power, Current, Resistance, and Apparent power respectively. However, the rank variable does not mean the full idea has obtained without joining results of the decision tree and correlation matrix in one conclusion.
Most algorithms of variable selection have the variable ranking as a principal selection mechanism because of its scalability, simplicity, and good empirical success. Different studies in this issue apply variable ranking as a baseline method.See [1] [2] [3] [4].
Variable F-value P-value Loss (W) 26.41174 0.000000
V (v) 8.28489 0.000063
P (W) 8.16986 0.000043
I (A) 7.26663 0.000456
R (ohm) 5.12329 0.001280
S (VI) 0.47056 0.823266 Table 2 Variables ranking
Figure 3 Displaysimportant variables by ranking
C. USEA CORRELATION MATRIX
Correlation matrix helps to extract the important relationship between each variable in the dataset.Correlation is measuring the relationship between two or more factors.It is valued ranging from -1 to +1. The value of -1 means a perfect negative correlation while a value of +1represents a perfect positive correlation. A value of 0 means that is no relationship between those variables. Based on the table, we can extract the relationship between every two variables and understand the main impact on the power factor. (Red numbers in the table represent a significant relation )
1- There is a positive correlation between (P) and (S), so (P) has a negative relation with (Loss) and (I). Furthermore, (P) has a strong and positive relationship with (PF) and (R).
2- (S) has a positive and small impact on (P), (Loss), and (V).
ISSN (Print) : 2320 – 3765 ISSN (Online): 2278 – 8875
I
nternational
J
ournal of
A
dvanced
R
esearch in
E
lectrical,
E
lectronics and
I
nstrumentation
E
ngineering
(A High Impact Factor, Monthly, Peer Reviewed Journal) Website: www.ijareeie.com
Vol. 7, Issue 8, August 2018
4- (V) impacted strongly on (P) and (R), and it normally impacted on (PF) and (S). However, the correlation between (V) and (I) is strong and negative.
5- (I) correlated negative and strong with (V), (PF), and (R), and it normally correlated with (P) in a negative relationship.
6- (R) Strongly related to (P), (V) and (PF). On the other hand, the negative relationship came from (Loss) and (I).
7- (PF) has a strong positive relationship with (P), (V) and (R), and a negative relationship with (Loss) and (I).
Variable P (W) S (VI) Loss (W) V (v) I (A) R (ohms) PF P(W) 1.000000 0.434698 -0.623338 0.790726 -0.563105 0.729714 0.816363
S(VI) 0.434698 1.000000 0.433245 0.471509 0.243847 0.222032 -0.125105
Loss (W) -0.623338 0.433245 1.000000 -0.381939 0.775270 -0.537496 -0.925623
V (v) 0.790726 0.471509 -0.381939 1.000000 -0.724472 0.959753 0.563538
I (A) -0.563105 0.243847 0.775270 -0.724472 1.000000 -0.854127 -0.742198
R (ohms) 0.729714 0.222032 -0.537496 0.959753 -0.854127 1.000000 0.654604
PF 0.816363 -0.125105 -0.925623 0.563538 -0.742198 0.654604 1.000000
Table3 The correlation between variables included Power Factor
Figure4 demonstrates the negative and positive relationships between variables. If plots are close, then the correlation is strong. The relationship will be positive if the straight line starts from left to the right and negative relationship if the straight line starts from right to the left.
Figure 4 Correlation matrix for all variables
The straight line in the different directions based on the nature of the relationship. However, there are a few outliers, which means a decision tree algorithm predicts the output is close to the observed output.
VI. CONCLUSION
ISSN (Print) : 2320 – 3765 ISSN (Online): 2278 – 8875
I
nternational
J
ournal of
A
dvanced
R
esearch in
E
lectrical,
E
lectronics and
I
nstrumentation
E
ngineering
(A High Impact Factor, Monthly, Peer Reviewed Journal) Website: www.ijareeie.com
Vol. 7, Issue 8, August 2018
the top of the importance, then Voltage, Real power, Current, resistance, and apparent power respectively. In the decision tree and feature selection, Apparent power did not give an important effect on the power factor. Finally, a correlation matrix applied to specify whether the relationship is negative or positive. Current and Loss have a negative impact on the power factor and the efficiency of the motor. To improve the efficiency and power factor, the real power and Voltage must be improved.
REFERENCES
[1] Bekkerman, R. El-Yaniv, N. Tishby, and Y. “Winter. Distributional Word Clusters vs. Words for Text Categorization”.JMLR, 3:1183–1208, 2003.
[2] Caruana and V. de Sa. “Benefitting from the Variables that Variable Selection Discards”. JMLR, 3: 1245–1264, 2003. [3] Forman. “An Extensive Empirical Study of Feature Selection Metrics for Text Classification”. JMLR, 3:1289–1306. 2003.
[4] Weston, A. Elisseff, B. Schoelkopf, and M. Tipping. “Use of the Zero Norm with Linear Models and Kernel Methods”. JMLR, 3:1439–1461, 2003.
[5] Hamza R Saad. “Use Fuzzy Rules and Experimental Design to Predict and Improve Output Performance of Three-Phase Inductive Motor”, International Journal of Advanced Research in Electrical, Electronics and Instrumentation Engineering, Vol. 6, Issue 7, July 2017.
[6] Liang, Xiaodong; Ilochonwu, Obinna. "Induction Motor Starting in Practical Industrial Applications". IEEE Transactions on Industry Applications. 47 (1): 271–280. (Jan 2011).