CENTRE FOR THE STUDY
OF ECONOMIC & SOCIAL
CHANGE IN EUROPE
SCHOOL OF SLAVONIC & EAST
EUROPEAN STUDIES
“Tradeand Industrial Upgrading in Countries of Central and Eastern Europe:
Patterns of Scale and Scope-based Learning”
Ulrike Hotopp, Slavo Radosevic, Kate Bishop
WorkingPaper No. 23
TRADE AND INDUSTRIAL UPGRADING IN COUNTRIES OF
CENTRAL AND EASTERN EUROPE:
PATTERNS OF SCALE AND SCOPE-BASED LEARNING
1Ulrike Hotopp
Department of Trade and Industry
[email protected]
2Slavo Radosevic
School of Slavonic and East European Studies, UCL
[email protected]
Kate Bishop
School of Slavonic and East European Studies, UCL
[email protected]
Abstract
The paper explores mechanisms that link trade and restructuring in countries of central and eastern Europe through a learning and industrial upgrading perspective. A theoretical model based on notions of scale (relative concentration in trade) and scope (changes in product variety) is introduced and applied, based on detailed product level data for six central and east European countries (CEECs).
During the early transition period the dominant mode of learning was scope based learning represented by a continuous increase in number of new products. In the later transition period, scope based learning has been complemented by scale-based learning or increased concentration in exports with significant country differences. Hungary is the only economy whose industrial upgrading has been continuously based on a complementary increase in both the number of new products and increased specialization.
An analysis, which is based on clusters of export products, shows the decreasing importance of commodities (homogenous goods) and a shift towards technology and labour intensive products to be a common trend. However, differences between central and east European countries are strong with respect to changes in both scale and scope dimensions in technology and labour intensive activities. These differences illustrate that trade based learning mechanisms - scale and scope - will have strong effects on differences in industrial upgrading between central and east European economies.
Keywords: corporate governance, ownership concentration, transition economies
April 2002
ISSN 1476-1734
1 This paper has been produced with the UK ERSC project “The emerging industrial architecture of the
1. Introduction
Economies of central and eastern Europe (CEE) have become highly integrated through trade into the world economy. In a relatively short period of time, their trade integration approached levels that would be expected given their proximity to the EU markets (Zoltan et al, 2001). Differences in patterns of their trade integration are closely related to differences in their recovery and growth. Countries that have reformed and restructured faster have significantly improved their technological structure of exports compared to laggards. In this paper we analyse patterns of changes in CEE trade in order to understand diverging patterns of industrial upgrading in these economies.
After ten years of institutional transition and economic restructuring the relevant issue for their long-term growth is whether or not integration through trade is pushing these economies towards long-term growth based on innovation and industrial upgrading. These dynamic effects of trade are highly dependent on its product composition. A
specific product composition reflects industry restructuring as well as assuming a specific technology base whose dynamic potential can be quite different. This is the case for imports and exports. Imports include capital goods and consumer goods. While the former can be used for production as well as imitation consumer goods can contribute to development mainly via changes in tastes and imitation in use. Exports on the other hand have to compete in the markets of the target country. This competition can take the form of price or quality competition. In this paper we concentrate on exports.
Changes in the product composition of exports are reflected in at least three different forms in the trade statistics: an increase in volume of exports (scale), an increase in
product differentiation or variety (scope) and increased unit prices (quality).1 In this paper
we analyse the patterns of industrial upgrading in CEECs which are reflected in changes in the composition of trade through changes in the relative shares of particular products and clusters in exports (scale) and in the number of products exported (scope). Our analysis of changes in the composition of trade is framed within the growth perspective or, more specifically, industrial upgrading perspective. It concentrates on two learning
related mechanisms – scale and scope.2 This enables us to clearly reveal patterns of
increasing differentiation in trade and industrial upgrading within the group of central and east European economies.
In the next section we review the relevant literature. In section three we explain the conceptual model that underpins the analysis. In section four we explain the features of the data set we use. Section five presents results and section six highlights and summarises the main conclusions.
2. Literature review
1 For the analysis of unit prices see Landesmann (2000) and Hotopp (2000)
Close links between trade and growth are essential in the catching-up process. Historical experience and econometric research shows that growth in output and in volume of international trade are closely related (Dosi et al, 1997) (Jones, 1998). In theoretical terms, Helpman and Grossman (1991) show that countries trading in world markets learn a great deal about new production methods used to produce goods other than those imported to these countries. In Schumpeterian models the rate of technical progress and patterns of international trade are jointly determined. In new growth theory free trade increases the size of the market and enlarges the scope for knowledge
spillovers. Developments in trade theory based on Heckscher-Ohlin use the argument of economies of scale for the development of international trade (Helpman 1985). Marginal production costs can fall if the market is large enough. Trade is one way of guaranteeing this scale effect.
Trade serves to promote specialization, increased scale of production and the variety of goods in which learning effects are embodied. These learning effects are generated through several learning mechanisms. Our understanding of these mechanisms is very vague. Empirical and theoretical research on trade and growth can tell us very little about the learning mechanisms which trade entails. As Aghion and Howit, (1998, p. 311) highlight the mechanisms of how trade affects growth remain unclear. Slaughter
(1997), Aghion and Howit (1998) suggest the following:
· Capital accumulation
· Factor price equalisation
· Knowledge spillovers
· Trade mediated technology transfer
However, these mechanisms are devoid of learning content (factor price equalization), unknown (spillovers) or insufficiently specified (capital accumulation and trade mediated technology transfer).
The empirical literature tends to focus on measures of openness (trade to GDP ratios) in order to establish links to growth. However, one usual objection is that openness may be the result of growth rather than vice versa. Data on per capita income cannot identify mechanisms by which convergence or growth takes place. This opens the problem of endogeneity in empirical research, which has been difficult to resolve. In reality growth and trade mechanisms operate in combination, which leads to serious problems for an econometric investigation. In addition, empirical research has to use proxies, which are far from perfect. This created a huge gap between theoretical models, which are by nature simplistic and empirical research, which has developed on its own.
catching-up process in technologically more advanced engineering branches, in the case of more advanced CEECs. Following Grossman and Helpman (1991) where rising product quality rather than increasing specialization matters in trade and growth Landesmann (1997, 2000) empirically analysed this pattern of trade-induced growth in the case of the CEE. He finds strong evidence for vertical product differentiation in EU – CEE trade. Also, Hoekman and Djankov (1996) consider vertically differentiated intra-industry trade to be the major mechanism fostering integration with the OECD countries.
Smith and Rollo (1994), Baldwin (1994), Gasiorek, Smith, and Venables (1995), and Drabek and Smith (1995) analyse the effect of increased trade with the CEE on the EU, especially the EU labour market.The majority of analyses have looked at the
changing patterns of CEE trade by using various factor intensity taxonomies. The works by Landesmann (1997 and 2000), Guerrieri (1997), Neven (1994) and Kubielas (1997) concentrate on the structure of trade itself. Guerrieri (1997) uses a modified Pavitt
taxonomy to explore the changing technological basis of CEE trade. Neven (1994) uses a factor-based classification of trade. Kubielas (1997) combines the taxonomies by Neven and Pavitt. In an earlier study Trabolt (1995) used Hirsch’s and Pavitt’s taxonomies.
Despite different taxonomies these studies came to rather similar conclusions regarding changing patterns of CEE trade. Landesmann (1997) shows a change towards labour-intensive branches and a shift away from capital-, R&D, and skill-intensive branches. Also, catching-up within product groups in terms of quality measured in export unit prices is present in most of the countries. His analysis emphasises increasing
differences in specialisation patterns among CEE countries. The more western CEE economies (Hungary, Czech Republic, Slovakia and Poland) experienced a less dramatic reinforcement of patterns based on inter-industry specialisation and much more on intra-industry specialisation. Landesmann (2000) shows a ‘relatively fast catching-up process in the technologically more advanced engineering branches in the case of the more advanced group of CEEC’s’.
Guerrieri (1997) shows several country-specific patterns. However, the general pattern is an increase in export of labour intensive products where the CEE countries doubled their share of world exports, from 0.81% to 1.62%. The share of these more ‘traditional’ or labour intensive products in the CEE’s export has increased from 23.5% (1989) to 31.7% (1995).
The analysis by Kubielas (1997), which is based on a combination of Neven’s and Pavitt's taxonomy, shows a clear structural change when analysed in terms of factor intensities of export. A pattern of changes is in selective improvements in Pavitt’s (1994) specialised suppliers, in low human but high physical capital intensive sectors and in
resource scale intensive sectors.3 In supplier dominated and low human - low capital
intensive sectors there was an instant adjustment upward followed by their further
stagnation so that revealed comparative advantage indices in supplier dominated products started to decrease after 1993.
As Hoekman and Djankov, (1996) point out the pattern of production and trade that emerges after opening the economy is driven in part by relative factor prices (endowments) and in part by economies of scale and scope. While inter-industry trade drives the first factor, intra-industry trade drives the changes in scale and scope.
In this paper we explore changes in scale and scope of CEE exports. We interpret changes in scale and scope as indicators for two dimensions of learning. Specialization through learning by doing should be reflected in increased scale of exported products while increased product diversification or production innovations should be reflected in increased scope or numbers of products exported. These learning processes are based on
learning by doing4 and on learning by interacting mechanisms5, one of the major
contributions of our paper to the existing empirical work. We assume the existence of strong effects of spillovers and increasing returns as trade develops.
Although scale and scope are not the true mechanisms of learning they support the transmition of knowledge via trade. In that respect, these trade indicators are used as proxies for different forms of learning or industrial upgrading. Since these concepts have both theoretical and empirical meaning they are potentially useful proxies for
understanding the links between trade and industrial upgrading. Industrial upgrading takes place by increased specialization (scale) and by the introduction of new products in exports (scope).
3. Model
Our conceptual model starts from the assumption that learning effects are embodied in exported goods and hence changes in the structure of export may enlighten our understanding of industrial upgrading. Links between patterns of trade and industrial upgrading take place via scale/scope mechanisms.
Economies accumulate production experience more rapidly in the sectors in which they specialize, than in sectors in which they do not. Excessive specialization may lead to ‘lock in’ into an initial pattern of specialization. This may not be the most dynamic as
modelled in Krugman (1987)6. For example, excessive Russian specialization in natural
textiles, where most new techniques originate in firms in the machinery and chemical industries. Pavitt, 1984
4 Arrow, K, 1962
5 Lundvall, B.Å. ed National Systems of Innovation - Towards a Theory of Innovation and Interactive Learning, London, Pinter Publishers, 1992
resources is a typical lock-in situation. Although an increase in scale or the export share is beneficial as it increases the size of the market it does not guarantee that this will ensure high growth. Growth based on increased specialization in exports ultimately needs to be complemented by an increased product variety. Long-term growth rests on
complementary relationships between scale and scope. An increased variety of products is subsequently followed by enhancements of specialization in those products proven to be competitive in export markets.
Behind the notion of scope is the idea that any learning is an exploratory process where stages of exploration are followed by cumulated learning-by-doing activities. Diversity is a precondition for further specialization. However, by definition the main drivers of diversity are firms, not factors or endowments. Firms are those agents who combine various resources (factors or endowments) and generate diversity.
Figure 1 shows the relationship between scale and scope or product specialization and product variety in exports.
Theoretically long-term industrial upgrading reflects an equilibrium development over time between the increase in the number of products and increased specialization. In figure 1 this would be the 45 degree line. However, in the case of economies that have been exposed to radical opening we would expect this curve to have the shape of the Y-curve, i.e. we would expect a sudden increase in the number of new products to be followed by an increase in specialisation as export markets ‘filter’ competitive products from uncompetitive products. However, in reality this curve is unlikely to have the smooth shape of Y. Instead it is more likely to be a cyclical curve such as Z. The initial
Scale/depeening of product surface Product specialization
L2 Y
Z
L1
increase in the number of products would be strong but eventually market filtering would generate increased specialisation. As economies grow and technologies diffuse we would expect again an increase in the number of products to be followed by increased
specialisation.
This virtuous cycle of upgrading would be expected in front-runner economies. Economies that have failed or are lagging in industrial upgrading would pursue two opposite paths. One group of laggards (L1) would continue to generate increasing numbers of products in exports but in none would the country be able to substantially increase its market share. These economies exhibit general advantages for exporting a large number of products but in none would they exhibit a significant competitive advantage. This marginal exporting across a large product surface is very stationary and would reach its limits in the number of new products.
Another group of laggards (L2) have a narrow product specialization. Its surface of export products remains very narrow and fragile to major external disturbances despite deepening of the existing structure. These economies show very weak structural
competitiveness.
However, scale and scope by themselves do not tell us much about the
technological content of trade. They are forms of learning, which need factor content in order to become analytically useful. We bring the factor content of trade into the analysis by grouping individual products into clusters. Clusters are groupings of products
according to their similarity in production, not use. Similarity in production is closely linked to homogeneity in terms of factor requirements.
Usually, the problem of aggregation has been approached through the notions of inter versus industry trade. Kaminski and Ng (2001) suggest the existence of intra-product trade between Central Europe and the EU. This leaves open the question about the most appropriate level of statistical aggregation. In this paper we introduce the level of clusters as the relevant level of aggregation for understanding trade flows. By grouping products into clusters in a bottom-up fashion we are able to generate a much more
meaningful grouping of clusters according to the underlying factors than we would from
top-down taxonomies.7
4. Data
Our analysis is based on the Eurostat COMEXT trade database at 8-digit level. This level of disaggregation is so detailed that we can interpret individual 8-digit
categories as ‘products’. The number of 8-digit categories is a proxy for scale or product diversity. The data covers the period between 1988 and 1999. However, changes in the classification in some categories in 1994/95 do not allow us a straightforward comparison of the number of products. Hence, we compare trends in absolute numbers of products in
the periods 1988-1994 and 1995-19998. However, this does not prevent us from analysing relative shares across the whole period.
The analysis encompasses six CEECs: Bulgaria, Czech Republic, Hungary, Poland, Romania and Albania. For the 1988-1994 period we use data for
Czechoslovakian export and compare them with Czech export in 1994.
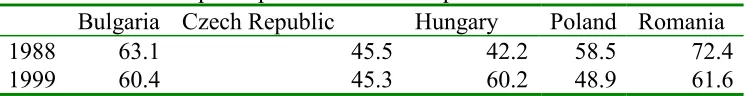
The main focus of the analysis is on the top 100 products. These are the 100 products of the country which have the highest individual share in total exports to the EU. The main objective of this step is to reduce the number of data and allow a detailed analysis. Table 1 shows the share of top 100 products in 1988 and 1999.
Table 1: Share of top 100 products in total exports to EU
Bulgaria Czech Republic Hungary Poland Romania
1988 63.1 45.5 42.2 58.5 72.4
1999 60.4 45.3 60.2 48.9 61.6
The shares of the top 100 products in total exports to the EU in 1999 vary from 45.3% (Czech R) to 61.6% (Romania). This suggests that the analysis based on the top 100 products is quite representative of a country’s total exports to the EU. We construct clusters by aggregating the top 100 products according to their underlying
factor/production similarity. A proxy for scale is the share of individual products or clusters in the top 100 products. The drawback of this proxy is that it does not take into account differences among countries in absolute values but only relative differences in concentration. However, our concern is not the absolute ranking of countries but relative patterns of trade. Given that in all CEECs exports have increased in the last 10 years the focus on relative patterns seems furthermore justified.
The aggregation of the top 100 products for each of the analysed CEECs has generated 22 product clusters (see Annex table 1). These 22 clusters can be aggregated further into three major groups of products: labour intensive, technology intensive and commodities (homogenous products).
5. Results
Data on the number of exported and imported products (table 2) show a strong increase during 1988-1994 compared to 1995-99. Previously closed economies have entered foreign markets by redirecting domestic market oriented products to foreign markets or by developing new products. They have not increased exports by narrowing
the range of export products or specialising. Instead, as all firms could be involved in foreign trade they used this opportunity to test foreign markets. This explanation is compatible with results of Hoekman and Djankov (1996) who find that a simple re-direction of goods that were traditionally exported to CMEA markets has not played an important role in the growth in exports to Western markets. They estimate that at most, 20% of the export volume comprises ‘diverted’ CMEA goods. So a majority of export growth was either in products that were not exported to the CMEA, or, comprise exports that have been upgraded or differentiated.
Table 2 shows that in the second period the number of products has stabilised. As firms rushed into foreign markets with new or existing domestic market oriented products they faced tough competition and realised that many of their products were not
competitive irrespective of their low prices (see Landesmann (2000) for evidence on very low unit price value positions of CEE exports). This learning experience forced them to reduce the number of products in exports and focus on those products that have
competitive potential. The analysis of innovation surveys in CEECs is quite compatible with this picture. In both Poland and Russia the share of innovative enterprises between the beginning of the 1990’s and the mid-1990’s has fallen (Radosevic, 1999). In Poland the share of innovative enterprises dropped from 62% (1992) to 38% (1994-96) while in Russia the share fell from 22% (1992-94) to 6% (1995-96). A high frequency of
innovative activities in the early period reflect intensive ‘search’ activities of enterprises that tried to enter into new markets with new products/technologies. However, these innovative activities did not result in business relevant innovations, i.e. in a high share of sales based on innovative products and processes. As a part of their diversification
efforts, enterprises have launched new products, which then had to be withdrawn from the market due to their marketing, cost or quality problems. The pure technical novelty of the products for the enterprise and the domestic market very often were insufficient for commercialisation. Similar to data on innovations, data on the number of products suggest that countries have reached a certain threshold whereby enterprises decreased the number of new products and the extent of their ’search’ efforts. Both exporting a wide range of products and innovating commercially dubious products turned out to be not as profitable in the new market conditions as perhaps previously expected.
Table 2: Change in the number of products, imports and exports
1988 - 1994 1995 - 1999
Country Export Import Export Import
Albania 2.39 1.85 0.98 0.98
Bulgaria 1.44 1.38 1.01 1.01
CZ/CR 1.53 1.71 1.02 0.98
Hungary 1.17 1.42 1.03 0.99
Poland 1.46 1.61 1.05 0.99
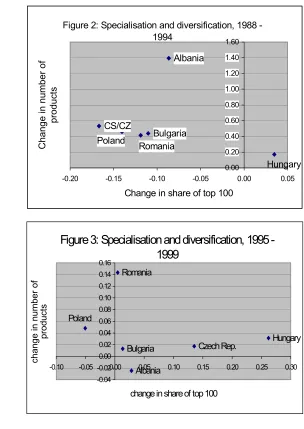
Figures 2, 3 and 4 show matrices that combine changes in the number of products with changes in the share of individual products in the top 100 for 1988-94, 1995-99 and for 1988-99. On the vertical axis we measure the change in the total number of products in exports of the CEEC to the EU. For example, for Hungary the total number of products exported has increased from 1,432 in 1988 to 1,675 in 1994 and from 5,799 in 1995 to
5,981 in 19999. On the horizontal axis we measure the share of the top 100 products in
total trade. This has increased for Hungary from 43.2% in 1988 to 44.7% in 1994 and from 47.7% in 1995 to 60.2% in 1999. For all other countries this share has fallen. In this way we capture both aspects of learning, scale and scope.
9Changes in number of products in few categories between 1994 and 1995 make comparison between 1988
and 1999 somewhat unreliable though they do not distort our conclusions about the relative patterns among countries, which is our main focus.
Figure 2: Specialisation and diversification, 1988 - 1994 Hungary Bulgaria Romania Poland CS/CZ Albania 0.00 0.20 0.40 0.60 0.80 1.00 1.20 1.40 1.60
-0.20 -0.15 -0.10 -0.05 0.00 0.05
Change in share of top 100
Change in number
of
pr
oduc
ts
Figure 3: Specialisation and diversification, 1995 - 1999 Albania Hungary Czech Rep. Bulgaria Poland Romania -0.04 -0.02 0.00 0.02 0.04 0.06 0.08 0.10 0.12 0.14 0.16
-0.10 -0.05 0.00 0.05 0.10 0.15 0.20 0.25 0.30
change in share of top 100
change i
n number of
Figure 1 shows that the dominant trend in the first period is increased
diversification and reduced concentration. This scope driven adjustment is characteristic for five out of six countries. Only Hungary increased simultaneously the number of products as well as increased concentration of the top 100 products. The Hungarian pattern of simultaneous scope and scale adjustment is distinctively different from other countries and suggests existence of industrial upgrading in terms of the scale/scope model (figure 1). In this first period no country exhibited either increased concentration and reduced diversification or reduced concentration and reduced diversification. In short, the dominant pattern is scope-based learning or exporting based on the introduction of new varieties of products, except Hungary whose exports have both diversified and
specialized.
In the period 1995-99, patterns of learning are becoming more diverse than in the first period. Four out of six economies (Bulgaria, Czech Republic, Hungary and
Romania) have increased the number of products as well as the concentration of exports in the top 100 products, i.e. they pursued scale and scope driven adjustment. As Hungary in the 1988-94 period, Bulgarian, Romanian and Czech exports have become more diversified as well as more specialised than in the first period. As before none of the countries reduced the concentration in the top 100 products and the overall number of products. Albania is the only economy with an increased share of the top 100 products in exports and a reduced number of products. This could suggest increased specialization, yet when combined with a reduction in the number of new products this suggests increased vulnerability of the Albanian economy and a fragile industrial upgrading.
The Polish economy is the only one that exhibits the same pattern in both time periods - increased diversification and reduced concentration. This may be a reflection of high growth in this economy where exports are generated as surpluses from domestic consumption rather than as truly competitive products. This may suggest that there are some problems in the industrial upgrading of Poland. On the other hand, a prolonged
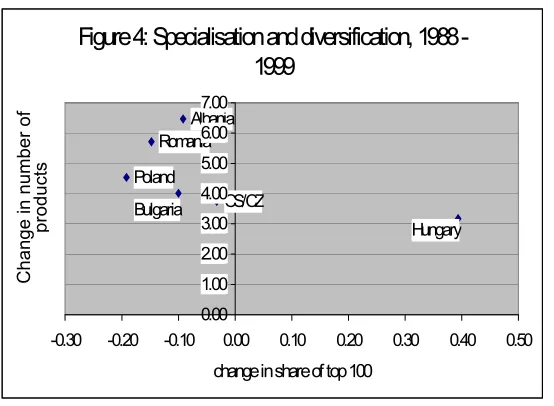
Figure 4: Specialisation and diversification, 1988 - 1999
Albania Romania
Poland
Bulgaria CS/CZ
Hungary
0.00 1.00 2.00 3.00 4.00 5.00 6.00 7.00
-0.30 -0.20 -0.10 0.00 0.10 0.20 0.30 0.40 0.50
change in share of top 100
C
hange i
n
number of
p
roduc
period of diversification, which may be partly a reflection of the size of the Polish
economy, may generate a larger number of products in the future from which markets can filter those most competitive. The analysis below shows an intermediate pattern of Polish adjustment in between two polarised patterns, which may partly explain the prolonged stage of diversification of Polish exports.
Figure 4 shows changes in the number of products and in the share of the top 100 products between 1988 and 1999. We are aware that comparisons of absolute numbers of products may be limited due to changes in the combined nomenclature (CN) between 1994 and 1995, as mentioned above. However, we are interested in the diversity of patterns among the group of countries and changes in the classification should affect all countries equally. Figure 4 suggests that changes in 1995-1999 period have not been strong enough to change the dominant development over the entire period. This has increased diversification and reduced concentration in five out of six economies
(Bulgaria, Romania, Czech Republic, Albania and Poland). Hungary is the only economy that exhibits a distinctive pattern of adjustment based on both scale and scope. These results basically conform with other changes in the Hungarian economy whose industrial adjustment is heavily based on foreign direct investments. For example, in 1998 foreign investment enterprises exported 86% of total Hungarian exports, invested 77% of total investment while employing only 45% of the manufacturing labour force (Hunya, 2000).
Similarities in the structure of CEEs exports to EU
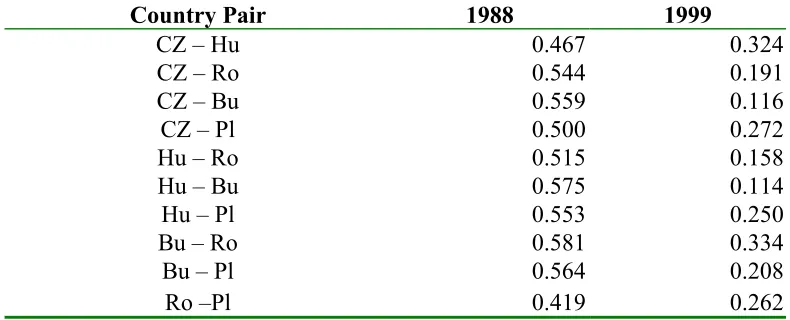
Similarities in scale and scope-based learning may hide significant differences in the content of trade. In order to explore this aspect of industrial upgrading we use the Finger – Kreinen (1979) index that measures similarities in the structure of exports between pairs of countries to a third country, in our case the EU. We use export clusters between pairs of CEECs (Table 3).
The expression for Finger Kreinen index is :
(
)
[
]
þ ý ü î
í ì
=
å
min ( ), ( ) *100 ,i
bc Xi ac Xi c
ab S
with: a, b, and c countries (c here the EU)
Xi: share of cluster i in total exports of country a and b to c.
Table 3: Finger-Kreinen index of similarities between pairs of CEECs in export to the EU based on clusters (share in total trade)
Country Pair 1988 1999
CZ – Hu 0.467 0.324
CZ – Ro 0.544 0.191
CZ – Bu 0.559 0.116
CZ – Pl 0.500 0.272
Hu – Ro 0.515 0.158
Hu – Bu 0.575 0.114
Hu – Pl 0.553 0.250
Bu – Ro 0.581 0.334
Bu – Pl 0.564 0.208
Ro –Pl 0.419 0.262
CZ: Czech Republic, Hu: Hungary, Ro: Romania, Bu: Bulgaria, Pl: Poland
Table 3 shows that in 1988 the exports to the EU of the five countries analysed were reasonably similar with values between 41 to 58%. This has fallen to between 11 and 33% in 1999, which suggests that the export structures of CEECs became divergent over time. Finger and Kreinen (1979)who use the index to analyse trade between the EU, USA, Japan and some less developed countries point out that the process of
industrialisation as experienced by Japan lead to an increase in the similarity between Japan and the EU. They further established that “the export similarity of the Semi-Industrial LDC exports and the Least Developed has been declining for exports to the United States and to Industrial Europe but rising for exports to EEC and to Japan.”
(Finger and Kreinen, 1979).10 Table 3 therefore indicates a diverse development for the
individual paths taken by the countries.
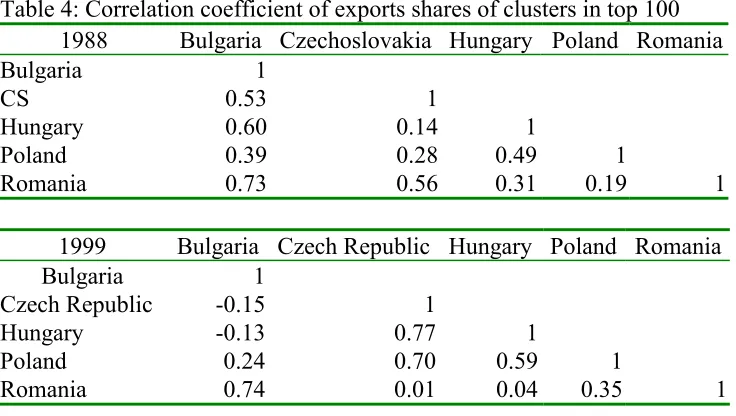
Using the simple correlation coefficients of cluster trade shares in 1988 and 1999 shows similar results with clearer grouping of countries (table 4).
Table 4: Correlation coefficient of exports shares of clusters in top 100
1988 Bulgaria Czechoslovakia Hungary Poland Romania
Bulgaria 1
CS 0.53 1
Hungary 0.60 0.14 1
Poland 0.39 0.28 0.49 1
Romania 0.73 0.56 0.31 0.19 1
1999 Bulgaria Czech Republic Hungary Poland Romania
Bulgaria 1
Czech Republic -0.15 1
Hungary -0.13 0.77 1
Poland 0.24 0.70 0.59 1
Romania 0.74 0.01 0.04 0.35 1
In the last years of socialism the largest similarities in exports were between Bulgaria and Romania, between Hungary and Bulgaria, and between Romania and Czechoslovakia. This significantly changed in 1999: a previously significant positive correlation between Hungary and Romania became negative, between Romania and Czech Republic the coefficient became zero. The correlation coefficient between Romania and Bulgaria remained of a similar magnitude while the strongest positive correlation is now between Czech Republic and Hungary. Tables 3 and 4 clearly show the pattern of polarisation of the export pattern between central Europe (Hungary, Czech R, Poland) and Eastern Europe (Romania and Bulgaria).
Intra-Cluster trade
However, before we examine the factor content of the CEE exports which lies behind these diverging patterns based on clusters, it would be necessary to examine the extent to which trade between CEECs and EU has become based on clusters, i.e. the extent to which clusters are relevant in explaining trade patterns. We test this by regressing shares of individual clusters in imports on shares of clusters in exports.
We apply equation
e J k g d c b
a + + + + + + +
= M Bu CZ Hu Pl Ro
XS S
where S
X : Share of export clusters in total trade
S
M : Share of import clusters in total trade
The results are reported in table 5.
Table 5: Regression
1988 1999
R Square 0.05 0.63
Observations 84 110
Coefficients (t Stat) Coefficients (t Stat)
Intercept 4.55 (2.13) 0.00 (-0.10)
Imports 0.24 (1.97) 1.62 (13.18)
Bulgaria -0.12 (-0.04) 0.00 (0.28)
Czechoslovakia -0.21 (-0.07) 0.00 (-0.26)
Hungary -0.38 (-0.14) 0.00 (0.11)
Poland 0.16 (0.06) 0.00 (0.10)
The regression does not claim to explain a causal relationship. Instead it is used as an instrument to explain patterns in the structure of imports and exports of the CEEC to the EU making positive use of a larger number of observations. The country dummies do not play a significant role in the determination of export patters. The regression results show a clear increase in the role of intra-cluster trade. While in 1988 imports were not similar to the structure of exports (coefficient of the imports variable is not significant) in 1999 the coefficient of the import variable is highly significant.
To understand the differences between the countries we used a simple correlation coefficient. Export shares of the clusters of top 100 products are compared to the import shares of the clusters of the top 100 products for five CEE countries.
Table 6: Correlation of import and export structure, 1988 and 1999
CS/CZ Romania Hungary Bulgaria Poland
1988 -0.06 0.58 0.43 0.30 0.15
1999 0.85 0.90 0.97 0.28 0.56
The structure of import and export shares of the 22 clusters in total trade for the all countries has increased for all countries apart from Bulgaria. In fact for Hungary the correlation coefficient between the export and import structure is almost 1.
Scale and Scope in CEE exports, 1999 CL CC CT RL RC RT HL HC HT BL BC BT PLL PLC PLT 0 10 20 30 40 50 60
0 10 20 30 40 50 60 70
Share - Scale
N u m b e r -S c o p e Factor content
We now want to explore the factor content of cluster-based trade. We classify 22 clusters into three major groups – technology based, labour based and commodity-based clusters. The group based on the bottom-up classification outlined in the Annex are similar to the classifications used by Wolfmayr-Schnitzler (1998) in her analysis of trade between CEE and EU. Figures 5 and 6 show factor-based clusters across two learning dimensions – scale and scope - for 1988 and 1999.
Figure 5 shows that in terms of both the number of products and the shares of clusters CEE exports were dominated by commodities based products. This dominance
scale- scope 1988
11 64 22 12 68 16 7 34 9 59 28 9 44 45 BC PC CC RL RC HL PL BL CL BT CT PT RT HT HC 0 10 20 30 40 50 60 70 80
0.00 5.00 10.00 15.00 20.00 25.00 30.00 35.00 40.00 45.00 50.00
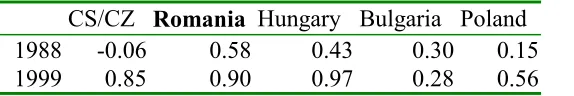
was very strong in all central and east European economies. Technology-based clusters played a very marginal role in terms of their concentration as well as in terms of the number of products with labour based clusters occupying a middle position. Figure 6 shows clearly how radically export patterns have changed between 1988 and 1999. The linear relationship between scale and scope in 1988 has been replaced by diversity of country positions in terms of scale and scope. This diversity becomes much clearer when we plot these figures for each individual country over time (see figures 7, 8, 9, 10 and 11).
Figure 7: Scale and Scope: Hungary 1988 - 1999
HT88 HL99 HC99
HL88
HC88
HT99
0 10 20 30 40 50 60 70
0 10 20 30 40 50 60
Share
Nu
mb
er
Figure 8: Scale and scope: Czech Republic 1988 - 1999
CT88CL88
CC99
CL99 CT99
CC88
0 10 20 30 40 50 60 70 80
0 5 10 15 20 25 30 35 40
Share
Num
b
Figure 9: Scale and Scope: Poland 1988 - 1999 PL99 PT88 PC99 PL88 PT99 PC88 0 10 20 30 40 50 60 70
0 5 10 15 20 25 30 35 40 45 50
Share
Nu
mb
er
Figure 10: Scale - scope: Bulgaria 1988 - 1999
BC99 BL88 BT88 BT99 BL99 BC88 0 10 20 30 40 50 60 70
0 5 10 15 20 25 30 35 40 45 50
Share Nu m b e r
Figure 11: Scale - Scope: Romania 1988 - 1999
RT88 RT99 RC99 RL88 RL99 RC88 0 10 20 30 40 50 60 70
0 5 10 15 20 25 30 35 40 45 50
Share
Nu
m
b
Hungary (figure 7) is the only country where large increases in scale and scope of technology-based clusters have been substituted for declines in both scale and scope of labour- and commodities based clusters. This clear shift from labour/commodities to technology-based clusters is impossible to explain by differences in factor endowments but only by strategies of MNCs in interaction with country-specific historical and institutional factors.
Figure 8 shows a similar trend for the Czech Republic with two differences. Firstly, the increase in scale of technology-based exports is less pronounced although the increase in the number of exported products is high. This may reflect some delay of the Czech Republic to attract FDI compared to Hungary. Secondly, the share of labour intensive clusters (scale) has increased although the number of products (scope) has decreased but much less than in Hungary.
Poland (figure 9) shows a similar trend as Hungary and the Czech Republic in terms of increased scale and scope for technology based products (clusters) and decreased importance in both dimensions of commodities based clusters (products). The main difference exists in terms of labour-based products (clusters) whose number increased yet concentration has decreased slightly.
Bulgaria (figure 10) shows a significantly different pattern compared to the three central European economies. While commodities based clusters (products) have lost importance in terms of both dimensions (scale and scope) these have been compensated by increased presence of labour intensive products (clusters) in both dimensions.
Although concentration of technology-based products has increased marginally their number has actually decreased. So, labour intensive products carried the entire burden of substitution of commodities based export.
Romania (figure 11) shows basically a similar though a quite specific pattern. As in all other economies its share of commodities in terms of scale and scope has
diminished but it has been primarily substituted by an increasing number of labour intensive products. However, the concentration in exports of labour intensive products did not take place. Instead, the burden of exports is carried by an increased variety of labour intensive products or by a horizontal expansion of the ‘product surface’ of exports. This may suggest that Romanian exports are not yet consolidated in terms of
specialization in labour intensive products. Technology intensive products (clusters) both have marginally increased their presence in terms of both dimensions (scale and scope).
Tables 7 and 8 summarise changes in terms of scale and scope. The number of commodities based products (scope) as well as their concentration (scale) has decreased in all countries. Differences among countries arise to the extent in which this decrease was compensated by technology-based products or by labour intensive products. Countries of Central Europe (Hungary, Czech R and Poland) have shifted to varying degrees from commodities to technology-based products. Hungary is clearly at the top in terms of degree to which this shift has taken place, followed by the Czech Republic and Poland. Bulgaria and Romania (only in terms of scope) have compensated the shift from commodities by increases in concentration and in the number of labour intensive
products.
Table 7: Changes in scale and scope features of export between 1988 and 1999
Technology Scale Scope
Bulgaria BT 3.37 -2
Czech Republic CT 13.18 41
Hungary HT 48.79 59
Poland PLT 21.84 25
Romania RT 0.79 5
Labour Scale scope
Bulgaria BL 31.51 26
Czech Republic CL 11.34 -5
Hungary HL -7.73 -20
Poland PLL -2.45 9
Romania RL 1.52 19
Commodity Scale Scope
Bulgaria BC -35.68 -21
Czech Republic CC -20.9 -32
Hungary HC -22.51 -36
Poland PLC -32.22 -30
Table 8: Changes in scope and scale features of export by factor-based groups
Bulgaria Scale Scope
BT 3.37 -2
BL 31.51 26
BC -35.68 -21
Difference -0.8 3
Czech Republic scale scope
CT 13.18 41
CL 11.34 -5
CC -20.9 -32
Difference 3.62 4
Hungary scale scope
HT 48.79 59
HL -7.73 -20
HC -22.51 -36
Difference 18.55 3
Poland scale scope
PLT 21.84 25
PLL -2.45 9
PLC -32.22 -30
Difference -12.83 4
Romania scale scope
RT 0.79 5
RL 1.52 19
RC -13.94 -22
Difference -11.63 2
Learning mechanisms that underpin export growth in technology-based products as well as a decrease in commodities are based on simultaneous respective increases and decreases in both scale and scope indicators. However, it is only for labour intensive products that we find differences between scale and scope. In other words, changes are much less homogenous across and within countries in labour intensive groups of products. It is only in this group that we find significant differences in increases (decreases) between product variety and specialization. For example, in Romania the increased variety of labour intensive products has not been accompanied by an equal increase in the specialization in new labour intensive products. In Poland, the increased number of new labour intensive products has been accompanied by a decrease in specialisation in this group. Contrary to this, in the Czech Republic, increased specialisation in this group has been accompanied by a decreasing variety of new products.
in labour intensive industries in the CEE, it is medium in resource-based industries, which closely resembles our category of commodities, and is the fastest in the high-technology group. Wage catching-up, on the other hand, is very similar across branches, which means that there is a wage drift between industries and that the competitive
position of labour intensive products is not yet consolidated. Firms are still exploring new market opportunities by introducing new labour intensive products into exports (Bulgaria, Romania, Poland) or by increased specialization in this group (Czech Republic) or by abandoning these products (Hungary).
6. Conclusions
The paper has focused on understanding mechanisms that link trade and industrial up-grading. Although intuitively appealing both empirical and theoretical literature on trade and growth have difficulties showing mechanisms by which trade influences growth and vice versa. We approach this problem using the learning and industrial upgrading perspective. The paper develops a descriptive theoretical model, which is based on notions of scale or relative concentration in trade, and scope or changes in product variety.
i) We used detailed product level data for six CEECs and analysed patterns of changes in trade by exploring these two dimensions of learning, which have taken place through changes in the variety of products and increased specialisation. Results have shown the relevance of our model for understanding patterns of learning and industrial upgrading in the CEECs.
ii) In the early transition period (1988-94) the dominant mode of learning is scope-based learning or a continuous increase in the number of new products. Countries that opened to world markets started to experiment and test competitiveness of products that were either undeveloped or sold on domestic markets only. Only in Hungary we observe both scale and scope-based learning or an increased diversity of products accompanied by an increased specialisation in the major product groups. This path is optimal from the perspective of industrial upgrading in our model as it ensures simultaneous variety and specialization.
iii) In the second period (1995-99), scope-based learning has been complemented by scale-based learning in four out of the six economies analysed. Hungary retains its ‘virtuous pattern’ of industrial upgrading in the second period. Patterns in the second period are much more country specific with Poland and Albania exhibiting distinctive paths when compared to Romania, Bulgaria and Czech Republic. However, the shift in this period seems not to be strong enough to overturn the trend from the first period in any of these economies.
v) When the data is organised into factor based clusters we find a clear shift common to all CEECs as well as significant country differences in patterns of learning and industrial upgrading.
A common trend is the decreasing importance of commodities and a shift towards technology and labour intensive products. Country differences emerge in the extent to which countries exhibit a shift towards technology or labour intensive products in both dimensions, in terms of scale and scope. Hungary again exhibits a very unique pattern where shifts from commodities and labour intensive products were more than
compensated by the shift towards technology based clusters and products.
Differences in countries' patterns in terms of increased importance of technology-based clusters (products) show clearly a polarisation between central and eastern Europe. Central European economies export growth is based on an increased diversification in technology-based clusters as well as on increased specialization in this group. Learning mechanisms that underpin their export growth are based on both increases in scale and scope. However, differences between scale and scope or between increased variety and specialization are much less homogenous in labour intensive groups of products. We presume that this reflects a transitive situation in terms of competitiveness in this group in CEE economies.
Our methodological approach has revealed new facets of trade restructuring and industrial upgrading in the countries of CEE. In particular, dimensions of scale and scope are useful proxies for a better understanding of the mechanisms that link trade and
7. Literature:
Dosi, Giovanni., and Teece. D., (eds.) (1997) Technology, organisation and
competitiveness: perspectives on industrial and corporate change, Oxford University Press
Helpman, Elhanan, (1985) Market structure and foreign trade, MIT
Helpman, Elhanan and Gene M. Grossman, (1991) Innovation and growth in the global
economy
Hoekman, Bernard and Simeon Djankov (1996) Intra-industry trade, foreign direct
investment and the reorientation of Eastern European exports, World Bank, March, mimeo
Hotopp, Ulrike, (2001) Trade, innovation and labour markets: Three essays on the UK’s
trade with Europe, University of Sussex,
Hunya, Gábor, (2000) International Competitiveness Impacts of FDI in CEECs, Paper
presented at the 6th E.A.C.E.S Conference, Barcelona, 7-9 September 2000
Jones, Charles I. (1997). An introduction to economic growth Norton.
Kaminski Bartolomiej and Francis Ng (2001) Trade and production fragmentation:
Central European economies in EU networks of production and marketing, World Bank
Working paper 2611, Washington.
Landesmann Michael, (2000) Structural Change in the Transition Economies 1989 to
1999, Economic Survey of Europe, 2000, No. 2/3, chapter 4,
www.unece.org/ead/ead-h-htm) (also: Vienna Institute for International Economic Studies, Research Reports,
September, No. 269, 2000)
Radosevic, Slavo (1999) Patterns of innovative activities in countries of central and
eastern Europe: an analysis based on comparison of innovation surveys’, SPRU
Electronic Working Papers Series, No,. 34, (www.sussex.ac.uk/spru)
Slaughter, Matthew (1997) Per capita income convergence and the role of international
trade, NBER, Working Paper, No.. 5897
Stehrer, Robert, Michael Landesmann and Johann Burgstaller (2001) Catching-up at the
Trabolt, Harald and Carla Berke, Die Komparativen Vorteile der mittel- und
osteuropaischen Lander: Gestern, heute und morgen, DIW Discussion paper No 123,
Oktober 1995
Wolfmayr-Schnitzer (1998) “Trade Performance of CEECs According to Technology
Classes” in The Competitiveness of Transition Economies: OECD Proceedings: 41-70
Zoltan, M. J. , M. A. Kovacs and A. Oszlay (2001), How far has trade integration advanced? An analysis of the actual and potential trade of three central and eastern