Scholarship@Western
Scholarship@Western
Electronic Thesis and Dissertation Repository
8-17-2011 12:00 AM
Decoding motor intentions from human brain activity
Decoding motor intentions from human brain activity
Jason P. Gallivan
The University of Western Ontario
Supervisor Dr. Jody Culham
The University of Western Ontario
Graduate Program in Neuroscience
A thesis submitted in partial fulfillment of the requirements for the degree in Doctor of Philosophy
© Jason P. Gallivan 2011
Follow this and additional works at: https://ir.lib.uwo.ca/etd
Part of the Neurosciences Commons, Other Physiology Commons, and the Systems Neuroscience Commons
Recommended Citation Recommended Citation
Gallivan, Jason P., "Decoding motor intentions from human brain activity" (2011). Electronic Thesis and Dissertation Repository. 253.
https://ir.lib.uwo.ca/etd/253
This Dissertation/Thesis is brought to you for free and open access by Scholarship@Western. It has been accepted for inclusion in Electronic Thesis and Dissertation Repository by an authorized administrator of
(Spine title: Decoding motor intentions from human brain activity)
by
Jason P. Gallivan
Graduate Program in Neuroscience
Thesis Format: Integrated Article
A thesis submitted in partial fulfilment of the requirements for the degree of
Doctor of Philosophy
The School of Graduate and Postdoctoral Studies The University of Western Ontario
London, Ontario, Canada
ii
SCHOOL OF GRADUATE AND POSTDOCTORAL STUDIES
CERTIFICATE OF EXAMINATION
Supervisor
______________________________
Dr. Jody Culham
Supervisory Committee
______________________________
Dr. Paul Gribble
______________________________
Dr. Daniel Ansari
Examiners
______________________________
Dr. Melvyn Goodale
______________________________
Dr. Tutis Vilis
______________________________
Dr. Roy Eagleson
______________________________
Dr. Larry Snyder
The thesis by
Jason P. Gallivan
entitled:
Decoding motor intentions from human brain activity
is accepted in partial fulfilment of the
requirements for the degree of
Doctor of Philosophy
iii
“You read my mind.” Although this simple everyday expression implies ‘knowledge or understanding’ of another’s thinking, true ‘mind-reading’ capabilities implicitly seem constrained to the domains of Hollywood and science-fiction. In the field of sensorimotor neuroscience, however, significant progress in this area has come from mapping
characteristic changes in brain activity that occur prior to an action being initiated. For instance, invasive neural recordings in non-human primates have significantly increased our understanding of how highly cognitive and abstract processes like intentions and decisions are represented in the brain by showing that it is possible to decode or ‘predict’ upcoming sensorimotor behaviors (e.g., movements of the arm/eyes) based on preceding changes in the neuronal output of parieto-frontal cortex, a network of areas critical for
motor planning. In the human brain, however, a successful counterpart for this predictive ability and a similar detailed understanding of intention-related signals in parieto-frontal cortex have remained largely unattainable due to the limitations of non-invasive brain mapping techniques like functional magnetic resonance imaging (fMRI). Knowing how and where in the human brain intentions or plans for action are coded is not only
important for understanding the neuroanatomical organization and cortical mechanisms that govern goal-directed behaviours like reaching, grasping and looking – movements critical to our interactions with the world – but also for understanding homologies between human and non-human primate brain areas, allowing the transfer of neural findings between species.
In the current thesis, I employed multi-voxel pattern analysis (MVPA), a new fMRI technique that has made it possible to examine the coding of neural information at a more fine-grained level than that previously available. I used fMRI MVPA to examine how and where movement intentions are coded in human parieto-frontal cortex and specifically asked the question: What types of predictive information about a subject's upcoming movement can be decoded from preceding changes in neural activity?
effector-iv
could also be decoded prior to movement. Lastly, Project 3 examined exactly where in the human brain higher-level movement goals were represented independently from how those goals were to be implemented. To this aim, Project 3 had subjects either grasp or reach toward an object (two different motor goals) using either their hand or a novel tool (with kinematics opposite to those of the hand). In this way, the goal of the action
(grasping vs. reaching) could be maintained across actions, but the way in which those actions were kinematically achieved changed in accordance with the effector (hand or tool). All three projects employed a similar event-related delayed-movement fMRI paradigm that separated in time planning and execution neural responses, allowing us to isolate the preparatory patterns of brain activity that form prior to movement.
Project 1 found that the plan-related activity patterns in several parieto-frontal brain regions were predictive of different upcoming hand movements (grasps vs. reaches). Moreover, we found that several parieto-frontal brain regions, similar to that only previously demonstrated in non-human primates, could actually be characterized according to the types of movements they can decode. Project 2 found a variety of functional subdivisions: some parieto-frontal areas discriminated movement plans for the different reach directions, some for the different eye movement directions, and a few areas accurately predicted upcoming directional movements for both the hand and eye. This latter finding demonstrates -- similar to that shown previously in non-human primates -- that some brain areas code for the end motor goal (i.e., target location) independent of effector used. Project 3 identified regions that decoded upcoming hand actions only, upcoming tool actions only, and rather interestingly, areas that predicted actions with both effectors (hand and tool). Notably, some of these latter areas were found to represent the higher-level goals of the movement (grasping vs. reaching) instead of the specific lower-level kinematics (hand vs. tool) necessary to implement those goals.
v
vi
All contents of the current thesis were carried out in collaboration with my advisor, Dr. Jody C. Culham. The research and writing were supervised by Dr. Culham, who
contributed to experimental design, interpretation, and manuscript editing. Projects 1, 2 and 3 (Chapters 3, 4 and 5) were in additional collaboration with Adam McLean, who assisted with experimental design, data collection, analysis, and provided feedback on the written manuscripts. Adam McLean also helped with programming stimuli for
presentation in the MR unit and operated the scanner. Kenneth Valyear assisted with the experiment design of Project 1 and provided feedback on the written manuscript. In addition, Charles Pettypiece assisted with the data collection of Project 1 and also provided feedback on the written manuscript. Fraser Smith assisted with data analysis,
vii
First and foremost, I would like to thank my PhD advisor, Dr. Jody Culham. Without her steadfast support and constant encouragement throughout the years, much of the
presented work would simply not be possible. Jody is all things that a good advisor needs to be: brilliant, innovative, inspiring, patient, understanding and a great teacher. She provided me with the freedom and confidence to pursue many of my own research ideas and directions and when the times required, offered the advice and feedback that allowed me to stand back and re-evaluate my approach. Undoubtedly, I owe my progression as a scientist and researcher to her expert mentorship. I will be forever grateful for the
knowledge and many opportunities that Jody has afforded me and immensely treasure my years working under her guidance. It is a testament to her teaching and our relationship
that I hope that this current work and my future endeavours make her proud.
Next, I would like to thank my friends and co-authors, Adam McLean, Kenneth Valyear,
Charles Pettypiece and Fraser Smith. I have been good friends and colleagues with these individuals for many years now, and they have each contributed a great deal to the work presented here. We have shared many engaging discussions and debates (often involving a white-board), surpassed many hurdles and difficulties together, and most importantly, have developed great long-lasting friendships that extend well beyond the lab. Any scientist will tell you that perhaps the most important recipe for intellectual growth is to surround yourself with the best and the brightest and each of these individuals are exactly that. I should acknowledge a particular indebtedness to the hardwork, tireless dedication and friendship of Adam McLean. Indeed, if not for his support and expertise this work would have taken nearly two to three times the amount of time to complete and I am sincerely grateful for the opportunity to have worked alongside such a gifted individual. I look forward to much collaboration with all of these individuals in the future.
viii
Quinlan, Mark Daley, and Haitao Yang for all of their assistance, feedback and insights over the years. I would also like to offer a special thanks to Craig Chapman, a frequent collaborator and great friend, who through numerous discussions and debates has helped me think outside the box and become a better, more thoughtful researcher. Although not a co-author on this specific set of projects, Craig’s influence can be found throughout the following pages and I cherish the time we spent learning from one another.
I would like to give a special acknowledgment to Dr. Melvyn Goodale. He has been particularly influential to my development as a scientist and has often provided me with an encyclopaedic source of knowledge, wisdom and insight. He has been remarkably generous to me with his time, despite his busy schedule, serving for my entire graduate
career on my Advisory Committee and also as a supervisor for my Comprehensive exams. Furthermore, Mel has also generously agreed to serve as an Examiner for my thesis. His door has always been open to me and he has been continuously supportive of my research efforts. I am enormously appreciative to him for sharing his brilliance, guidance and encouragement throughout the years.
The remaining two members of my Advisory Committe, Drs. Daniel Ansari and Paul Gribble, also deserve special thanks. I have gotten to know Daniel quite well during my PhD, having collaborated with him on several side projects, and he never fails to astound me with his his ideas and insights. He has served as an inspiration for me in several aspects of my work and I am truly thankful for all his input and guidance over our collaborations. Paul has been a continuous source of advice over the years; an expert in all things statistical and mathematical and someone with an exceptional grasp of motor control. He also served as a supervisor for my Comprehensive exams, an experience that has guided much of my current thinking and approach in research. Without fail, Paul always asks the tough questions, and in doing so he has made me a more critical, thoughtful scientist and has prepared me well for a future in research. I also thank both Daniel and Paul for their comments and feedback on an earlier draft of this thesis.
ix
making that a possibility by sharing their brilliance and insights with me.
Thank you to my thesis Examining Committee, Drs. Melvyn Goodale, Tutis Vilis, Roy Eagleson and Larry Snyder.
x
Contents
CERTIFICATE OF EXAMINATION ... ii
Abstract ... iii
Co-Authorship... vi
Acknowledgments... vii
Table of Contents ... x
List of Tables ... xiii
List of Figures ... xiv
List of Appendices ... xxv
List of Abbreviations ... xxvi
Chapter 1... 1
1. General Introduction ... 1
1.1 Movement and the Brain ... 1
1.2 Human and Monkey Brain areas important for the control of action... 3
1.2.1 Movement-related areas in premotor cortex ... 6
1.2.2 Movement-related areas in PPC... 10
1.2.3 Parallel parieto-frontal pathways for reaching and grasping ... 17
1.2.4 Decoding intentions in the monkey brain ... 21
1.3 From the monkey to the human... 22
1.4 Decoding intentions from fMRI spatial activity patterns ... 31
1.5 Current projects ... 35
1.6 References ... 38
Chapter 2... 47
2. General Materials and Methods for the three projects ... 47
2.1 Preamble ... 47
2.2 Subjects... 47
2.3 Setup and Apparatus ... 47
2.4 Experiment Design and Timing... 50
2.5 MRI acquisition and preprocessing ... 51
2.6 Regions of Interest (ROI) ... 52
2.7 Multi-voxel pattern analysis (MVPA) ... 53
2.7.1 Support Vector Machine Classifiers ... 54
2.7.2 Voxel Pattern Preparation ... 54
2.7.3 Pair-wise Discriminations... 57
2.7.4 Single-Trial classification ... 57
2.7.5 Permutation Tests... 58
2.7.6 Within-Trial tests (only applied in Project 1) ... 59
2.7.7 Cross-trial-type decoding (only applied in Projects 2 and 3) ... 59
2.8 References ... 61
Chapter 3... 63
3. Decoding action intentions from preparatory brain activity in human parieto-frontal networks ... 63
3.1 Introduction ... 63
3.2 Materials and Methods: ... 64
xi
3.2.3 Experiment Design and Timing ... 69
3.2.4 MRI acquisition and preprocessing ... 69
3.2.5 Regions of Interest (ROI)... 69
3.2.6 ROI selection ... 70
3.2.7 Multivariate pattern classification analysis (MVPA) ... 76
3.2.7.1 Voxel pattern preparation ... 76
3.2.7.2 Single-Trial classification ... 76
3.3 Results ... 79
3.3.1 Decoding Analyses ... 79
3.3.2 Additional Univariate Analyses ... 86
3.4 Discussion... 89
3.4.1 Decoding in Parietal cortex... 89
3.4.2 Decoding in Motor and Premotor cortex ... 90
3.4.3 Implications... 92
3.5 References ... 93
Chapter 4... 96
4. Decoding effector-dependent and effector-independent movement intentions from human parieto-frontal brain activity... 96
4.1 Introduction: ... 96
4.2 Materials and Methods: ... 100
4.2.1 Subjects ... 102
4.2.2 Setup and Apparatus ... 102
4.2.3 Experiment Design and Timing ... 103
4.2.4 MRI acquisition and preprocessing ... 103
4.2.5 Regions of Interest (ROI)... 107
4.2.6 ROI selection: ... 107
4.2.7 Multi-voxel pattern analysis (MVPA) ... 110
4.2.7.1 Voxel Pattern Preparation ... 110
4.2.7.2 Single-Trial classification ... 110
4.4 Discussion:... 126
4.4.1 Posterior Parietal Cortex (PPC) Decoding... 127
4.4.2 Premotor Cortex Decoding ... 128
4.4.3 Implications: ... 129
4.5 References ... 130
Chapter 5... 134
5. How the brain uses tools: Separate and shared movement plans for the hand and tool in human parieto-frontal cortex... 134
5.1 Introduction ... 134
5.2 Material and Methods ... 136
5.2.1 Subjects ... 139
5.2.2 Setup and Apparatus ... 139
5.2.3 Experiment Design and Timing ... 141
5.2.4 MRI acquisition and preprocessing ... 142
5.2.5 Regions of Interest (ROI)... 142
xii
5.2.7.1 Voxel Pattern Preparation ... 147
5.2.7.2 Single-Trial classification ... 147
5.3 Results ... 148
5.3.1 Movement plan decoding... 148
5.3.2 Separate and shared representations ... 153
5.3.3 Time-Resolved Decoding ... 156
5.4 Discussion... 162
5.4.1 Representation of the motor hierarchy across parieto-frontal cortex... 164
5.5 References ... 168
Chapter 6... 174
6. General Discussion... 174
6.1 What do these spatial activity patterns mean?... 178
6.1.1 What is the neural basis of the local spatial patterns? ... 178
6.1.2 What is the information contained in the local spatial patterns? ... 181
6.1.2.1 Higher-level goal representations in parieto-frontal cortex ... 183
6.1.2.2 Lower-level kinematic representations in parieto-frontal cortex... 187
6.1.3 Intention vs. Attention ... 190
6.2 Methodological and minor theoretical considerations... 193
6.2.1 Planning- vs. Execution-related activity: ... 193
6.2.2 Caveats to interpretations from standard decoding analyses ... 194
6.2.3 Caveats to interpretations from cross-trial-type decoding analyses (emphasis on Project 3 findings)... 195
6.2.4 Corrections for multiple comparisons?... 196
6.3 Future Directions ... 198
6.3.1 Does early visual cortex provide a ‘read-out’ of a subject’s intentions?... 199
6.3.2 Do object-processing perceptual regions provide a ‘read-out’ of a subject’s intentions? ... 206
6.3.3 Other future directions: Examining ecologically-relevant behavior... 209
6.4 Concluding remarks... 209
6.5 References ... 212
Appendix A... 219
Appendix B ... 222
xiii
Table 3.1 ROIs with corresponding Talairach coordinates (mean x, y, and z centre of mass and std). Mean ROI sizes across subjects from AC-PC data (in mm3 and functional voxels)...………75
Table 4.1 ROIs with corresponding Talairach coordinates (mean x, y, and z centre of mass and std). Mean ROI sizes across subjects from AC-PC data (in mm3 and functional voxels).……...………106
xiv
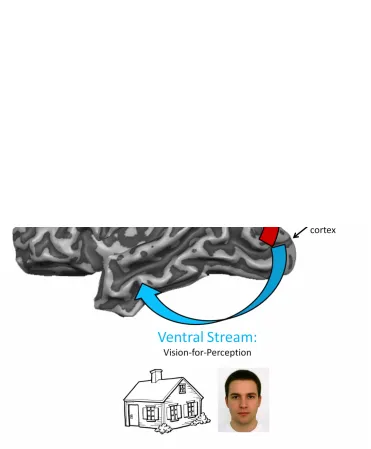
Figure 1.1 Dual visual streams hypothesis (Goodale and Milner, 1992). Vision is first processed in early visual cortex (V1) and then projects into two separate but interacting streams. The dorsal stream, shown with the red arrow, ascends from occipital to posterior parietal cortex (PPC) and extracts visual features relevant for the control of action (like the spatial location of a baseball for hitting or the orientation of a cup for grasping). The ventral stream, shown in the blue arrow, projects from occipital to ventral-temporal cortex and extracts visual features relevant for perception and object recognition (like whether the individual is looking at a house or face)……….…5
Figure 1.2 Action-related areas of frontal cortex shown on the cortical surface of a macaque monkey (A) and human (B) brain. The cortical surfaces were defined at the gray-white matter boundary and have been partially inflated to reveal regions within the sulci while preserving a sense of curvature. Brain areas are color-coded according to the current consensus on the ascribed function of each area based on neurophysiological
recordings in monkeys (A) and fMRI in humans (B). Areas coded with similar color suggest possible functional homologies between humans and monkeys. PMd = premotor dorsal cortex, PMv = premotor ventral cortex. FEF = frontal eye fields. PMd and FEF are similarly color-coded in the human due to the difficulty in separating their activations with fMRI. Modified with permissions from Culham and Valyear (2006)….……….8
Figure 1.3 Action-related areas of parietal cortex shown on the cortical surface of a macaque monkey (A) and human (B) brain. The cortical surfaces were defined at the gray-white matter boundary and have been partially inflated to reveal regions within the sulci while preserving a sense of curvature. Brain areas are color-coded according to the current consensus on the ascribed function of each area based on neurophysiological
recordings in monkeys (A) and fMRI in humans (B). Areas coded with similar color suggest possible functional homologies between humans and monkeys. Monkey areas: V6 = visual area 6, V6A = visual area 6A, MIP = medial intraparietal area, cIPS = caudal intraparietal sulcus, LIP = lateral intraprietal area, AIP = anterior intraparietal area. Human areas: SPOC = superior parieto-occipital cortex, mIPS = middle IPS, pIPS = posterior intraparietal sulcus, PEF = parietal eye field, aIPS = anterior intraparietal sulcus. Modified with permissions from Culham and Valyear
(2006)………..14
Figure 1.4 Suggested parallel visual-motor pathways for reaching and grasping in the macaque monkey. (Left) The cortical surface of a macaque
xv
related information in a dorso-medial circuit (in red) and grasp-related information in a dorso-lateral circuit (in green). Both parallel pathways begin with object-related visual processing in early visual cortex (V1) and then undergo sensorimotor transformations for movement in parietal and premotor cortex. (Right) Schematic representation of the brain areas involved in each pathway, with arrows denoting the direction of
information processing. At the end stages of movement preparation, it is thought that both PMd and PMv then inform M1 of the desired motor acts. V6 = visual area 6, V6A = visual area 6A, MIP = medial intraparietal area, PRR = parietal reach region, PMd = premotor dorsal cortex, cIPS = caudal intraparietal sulcus, AIP = anterior intraparietal area, PMv = premotor ventral cortex………...…….20
Figure 1.5 Intention-related activity in parietal cortex reflects a monkey’s upcoming reach movement direction. Neural activity is recorded from the parietal reach region (PRR) while a monkey performs a delayed-movement task. In this task (Top), the monkey fixates centrally (on red square) and places their hand at the starting point (green triangle). A peripheral reach target is briefly flashed (green circle) and the monkey then plans a reach to the cued location but importantly does not move until the green triangle is extinguished. (Bottom) The spiking-related activity of a single PRR neuron during the delayed movement task. When the cued reach target location coincides with the preferred direction of the PRR neuron, there is an increased rate of spiking during the delay period (black trace; compared to a non-preferred direction, gray trace). It is critical to note, that the elevated and persistent rate of neuron firing during the delay period is related to the monkey’s intention to make an arm movement, as no sensory stimulus or movement is initiated during that time phase. Reprinted with permission from Andersen et al., 2010..……….24
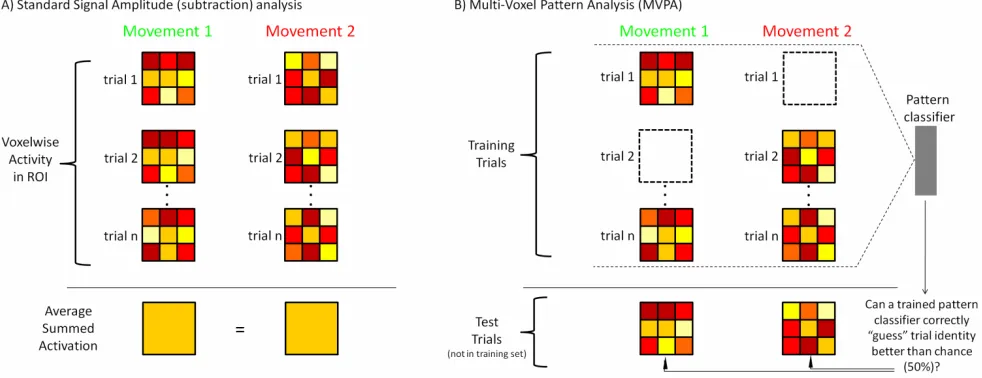
Figure 1.6 The difficulty of examining intention-related brain activity in humans with standard fMRI analyses and a possible solution that side-steps this problem. Similar to the approach taken in macaque monkeys, in order to effectively examine movement planning processes in humans, intention-related activity needs to be isolated from the sensory and motor events of the task. This is also accomplished with a variant of the delayed-movement paradigm. In such a task (A), a target object is first visually presented to a participant (Preview phase). Moments later, the subject is then instructed via headphones on how to act upon that target object -- in the example here, “Movement 1” or “Movement 2” (this audio cue initiates the beginning of the Plan phase). It is important to note that no visual information changes between object presentation and movement instruction. Following a delay period, the subject is then given the Go cue (“Beep”) and then performs the cued action upon the target object.
xvi
movement-related region-of-interest (ROI; in the case here, parietal cortex) corresponding to the task (B), we typically find a
distinct……….29
Figure 1.7 Schematic comparison of Conventional/Standard Signal Amplitude analysis vs. Multi-Voxel Pattern Analysis (MVPA) techniques in fMRI. A) Overview of how conventional voxel-wise fMRI analyses are typically performed. In this approach, individual fMRI trials within an ROI (depicted here as spatial activity patterns, as done in Figure 1.6C) are averaged together to produce average signal amplitude responses (this can be done both with raw % signal change activation or beta weights, with the latter based on how well the height of the % signal change activation fits a pre-described hemodynamic response model). The average beta weights for different conditions can then be statistically compared within each voxel across the whole brain (e.g., by subtracting the response of Movement 2 from that of Movement 1) and we can then use these fMRI activation differences to localize brain areas specifying a particular effect (i.e., directed-search or voxel-wise analyses). In the...……...…32
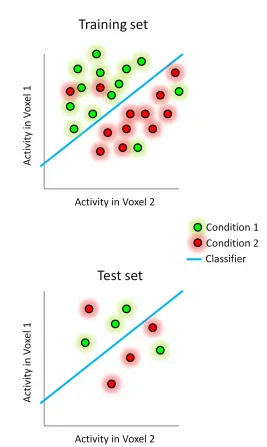
Figure 1.8 How spatial voxel patterns are compared and classified using Support Vector Machines (SVMs). In short, MVPA with an SVM classifier requires a model to be ‘trained’ with a subset of the data (top plot), and then ‘tested’ with an independent subset (bottom plot). Conceptually, the training of a SVM classifier requires the Train set to be plotted in voxel space such that the projection of any point (trial) onto the Nth dimensional axis is the response amplitude for that trial in voxel N. The simplest of these cases is depicted here, with a two voxel spatial pattern
(understandably, it is impossible to visually represent this multidimensional voxel space beyond 3 voxels). Since the
multidimensional voxel landscape contains two sets of trials (for instance, conditions 1 and 2), the goal of the classifier, knowing both trial identities, is to define a hyperplane that best separates these sets into two classes. For example, if a trial falls on one side of the hyperplane then it belongs to Class A and…………...………..….33
xvii
Figure 2.2 Time-dependent decoding approach used in the three experiments. To examine how action decoding evolved across the length of a trial, MVPA was performed on single fMRI trials and based on the windowed average of the % signal change corresponding to the three different time-points denoted by each of the gray shaded bars (top plot). Each averaged time point corresponded to the activity elicited from a distinct phase of the trial: Preview, Plan and Execute (from left to right). We reasoned that if we would be able to predict a subject’s upcoming movement from brain activity, that these intention-related signals should be present in the few seconds prior to the subject performing an action (Plan phase gray bar). Decoding during the Preview phase was used as a type I error control, given the rather obvious fact that as a proof-of-principle, we should not be able to decode the intentions of an action prior to the subject being
instructed of which movement to perform. Decoding during...….56
Figure 3.1 Experiment setup, conditions, timing and trial-related brain activity. A) Setup from side view. The participant’s head is tilted to permit direct viewing of objects on the platform. B) Experimental apparatus and graspable object shown from the participant’s point of view. The same object (consisting of a smaller cube attached atop a larger cube) was always presented at the same location on the platform for every trial. Green star with dark shadow represents the fixation LED and its location in depth. Hand is positioned at its starting location. (Right) The three different hand movements. C) Timing of one event-related trial. Trials began with the 3D graspable object being illuminated while the subject maintained fixation (Preview phase; 6 s). Subjects were then instructed via headphones to perform one of three hand actions: Grasp the top cube (“Top”), Grasp the bottom cube (“Bottom”), or touch both cubes with their knuckles (“Touch”). This cue initiated the Plan phase...…...…68
Figure 3.2 Decoding of object-directed movement intentions across the parieto-frontal network. Cortical areas that exhibited larger responses during movement planning than the preceding visual phase (Plan > Preview) are shown in orange/yellow activation. Results calculated across all subjects (Random Effects GLM) are displayed on one representative subject’s inflated hemispheres. The general locations of the selected ROIs are outlined in circles (actual ROIs were anatomically defined separately in each subject). Each ROI is colour-coded according to the pair-wise discriminations they can decode during the Plan phase (found in Figure 3.4); see colour legend at top for classification profiles. Colours denote significant decoding accuracies for upcoming...74
xviii
frontal network areas. Vertical dashed lines correspond to the onset of the Preview, Plan and Execute phases of each trial (from left to right). Shaded gray bars highlight the 2-volume (4 s) windows that were averaged and extracted for pattern classification analysis. Note that time corresponds to imaging volumes (TR=2), and not seconds...……..77
Figure 3.4 Classifier decoding accuracies for each ROI for the three trial phases
(Preview, Plan and Execute; the middle three bars correspond to accuracies elicited during the Plan Phase). Errors bars represent SEM across subjects. Solid black lines are chance accuracy level (50%). Black asterisks assess statistical significance with 2-tailed t-tests across subjects with respect to 50%. Note that no above chance decoding is shown during the Preview phase, when subjects were unaware which movement they were going to perform. Red asterisks denote statistical significance with paired 2-tailed t-tests for decoding accuracies across subjects for Plan and Execute phases with respect to within-trial decoding accuracies found during the preceding Preview phase (i.e. assessing where accuracies are………...….…80
Figure 3.5 No fMRI signal amplitude differences found within the parieto-frontal regions used for pattern classification. Responses are averaged across voxels within each ROI and across subjects (2-volume averaged windows corresponding to Preview, Plan and Execute phases). Note that only one significant univariate difference is observed in R-SPOC, a non-decoding region. Errors bars represent SEM across subhects...…………..83
Figure 3.6 Classifier decoding accuracies in non-brain control regions.A) Non-brain control ROIs defined in each subject (denoted in green; example subject shown). B) Classifier accuracies for the 3 trial phases for the right ventricle (left) and outside the brain ROI (right). Error bars represent SEM across subjects. Solid lines show chance classification accuracy (50%). Importantly, no significant differences were found with t-tests across subjects with...88
xix
exhibited larger responses during movement generation than the preceding visual phase [(Plan + Execute) > 2*(Preview)] are shown in orange/yellow activation. Results calculated across all subjects (Random Effects GLM) are displayed on one representative subject’s inflated hemispheres. The general locations of the selected ROIs are outlined in circles (actual ROIs were anatomically defined separately in each subject). L = Left, R = Right (ROI acronyms are spelled out in main text). Sulcal landmarks are denoted by white lines (stylized according to the corresponding legend). LH = Left-hemisphere, RH = Right-hemisphere...104
Figure 4.3 Trial-related percent signal change neural activity in the parieto-frontal regions used for MVPA. Activity in each plot is averaged across voxels within each ROI and across subjects. Vertical dashed lines
correspond to the onset of the Preview, Plan and Execute phases of each trial (from left to right). Shaded gray bars highlight the 2-volume (4 s) windows that were averaged and extracted for MVPA (a conventional univariate analysis of signal amplitude differences within these same time-windows is provided in Figure 4.6). Note that time corresponds to imaging volumes (TR=2), and not seconds………....….……….109
Figure 4.4 Decoding movement intentions across the parieto-frontal network.
Decoding accuracies are shown for each time phase (Preview, Plan, and Execute) in each ROI.Classifier training was done on single trials and tested on the average activity patterns of the single trials for each condition in the independent test data set. Importantly, accurate classification can only be attributed to the spatial response patterns of different planned movement types, and not the overall signal amplitudes within each ROI (see Figure 4.6). Note that decoding accuracies are colour-coded according to pair-wise discriminations and not trial types. Error bars represent standard error of the mean (SEM) across subjects. Solid black lines are chance accuracy level (50%). Asterisks assess statistical significance with t-tests across subjects with respect to
50%...111
Figure 4.5 Cross-trial-type decoding accuracies examining the degree of effector-specificity and spatial-effector-specificity of the intended movements. Decoding accuracies are shown for each time phase (Preview, Plan, and Execute) in each ROI. Effector-across-space accuracies were computed from training classifiers on HandL vs. EyeL trials and testing on HandR vs. EyeR trials and then averaging these values with the opposite train-and-test ordering, within each subject. Space-across-effector accuracies were computed from training classifiers on EyeL vs. EyeR trials and testing on HandL vs. HandR trials (again, averaging these values with the opposite train-and-test ordering, within each subject). Error bars represent...113
xx
averaged windows corresponding to Preview, Plan and Execute phases. Note that very few statistically significant univariate differences are found throughout the parieto-frontal network. Errors bars represent SEM across subjects…………...……..…...115
Figure 4.7 Classifier decoding accuracies in non-brain control regions.A) Non-brain control ROIs defined in each subject (denoted in light orange; example subject shown). B) Classifier accuracies for the right ventricle (left) and outside the brain ROI (right). Error bars represent SEM across subjects. Solid lines show chance classification accuracy (50%). Note that no significant differences were found with t-tests across subjects with respect to 50% chance. C) Percent signal change activity from each selected region, averaged across subjects...117
Figure 4.8 Activation topography of effector-selectivity (eye vs. hand) during movement planning and execution with conventional subtraction analyses. (Left) Brain areas that showed significant activation (RFX GLM, t(7)=3, p<0.01, cluster threshold corrected) during movement planning for the eye or hand independent of the spatial target location [Plan(EyeL + EyeR) > Preview(EyeL + EyeR)] in yellow; [Plan(HandL + HandR) > Preview(HandL + HandR)] in red. (Right) Brain areas that showed significant activation (at the same statistical threshold) for movement execution of the eye or hand [Execute(EyeL + EyeR) > Preview(EyeL + EyeR)] in yellow; [Execute(HandL + HandR) >
Preview(HandL + HandR)] in red. The overlap of eye and hand movement planning or execution is shown in orange...120
Figure 4.9 Activation topography of spatial-selectivity (left vs. right targets) for reach planning and execution with conventional subtraction analyses.
(Left) Brain areas that showed significant activation (RFX GLM, t(7)=3, p<0.01, cluster threshold corrected) during reach planning depending on the spatial target location [Plan(HandL) > Preview(HandL)] in yellow; [Plan(HandR) > Preview(HandR)] in red. (Right) Brain areas that showed significant activation (at the same statistical threshold) for reach execution [Execute(HandL) > Preview(HandL)] in yellow; [Execute(HandR) > Preview(HandR)] in red. The overlap of left and right reach planning or execution...122
xxi
execution is shown in orange...125
Figure 5.1 Experimental methods and evoked neural activity. A) Subject setup shown from side view. B) (Left)Experimental apparatus and target object shown from the subject’s point of view for experimental runs where either the hand (top) or reverse tool (bottom) were used. The location of the target object (white block) was switched between run types but did not change its position from trial-to-trial within a given run. Dashed line represents the arc of reachability for each run type with respect to the participant. The hand is shown at its starting location. Green star with dark shadow represents the fixation LED and its location in depth. (Right) Hand and tool movements performed by the subject. C) Timing of each event-related trial. Trials began with the 3D object being illuminated while the subject maintained fixation (Preview phase; 6 s). Subjects were then instructed via headphones to perform one of two movements: Grasp the object (“Grasp”) or Touch the object (“Touch”), initiating the Plan phase portion of the trial. Following a fixed delay interval (12 s), subjects were cued (‘beep’)………...…137
Figure 5.2 Parieto-frontal brain areas selected for movement plan decoding.
Cortical areas that exhibited larger responses during movement generation than the preceding visual phase [(Plan + Execute) > 2*(Preview)] are shown in orange/yellow activation. Results calculated across all subjects (Random Effects GLM) are displayed on one representative subject’s inflated hemispheres. The general locations of the selected ROIs are outlined in circles (actual ROIs were anatomically defined separately in each subject). Linked to each ROI is the corresponding percent (%) signal change BOLD activity averaged across voxels within each ROI and across subjects and plotted according to trial length (note that time is in imaging volumes, each volume = 2 s). Vertical dashed lines correspond to the onset of the Plan………...………….145
Figure 5.3 Movement plans for the hand or tool decoded from parietal cortex.
Decoding accuracies are shown for the Plan phase only (epoch-related decoding; left column) or for each time point in the trial (time-resolved decoding; right column). The epoch-related decoding plots are based on a windowed average of the spatial activity patterns denoted by the gray shaded bars in the time-resolved decoding plots. In the time-resolved decoding plots, vertical dashed lines correspond to the onset of the Plan and Execute phases of the trial (from left to right). For decoding
xxii
within………...…...149
Figure 5.4 Separate movement plans for the hand and tool decoded in anterior parietal and motor cortex. Decoding accuracies are shown for the Plan phase only (epoch-related decoding; left column) or for each time point in the trial (time-resolved decoding; right column). All accuracies are
computed the same as in Figure 5.3. Error bars represent standard error of the mean (SEM) across subjects. Solid black lines are chance accuracy level (50%). Asterisks assess statistical significance with 2-tailed t-tests across subjects with respect to 50% (*=p<0.05; **=p<0.01; ***=p<0.005; ****=p<0.001). Note that to minimize the number of asterisks presented for time-resolved decoding (plots in right column), statistical significance is shown only at p<0.05 (note also that the color of each asterisk denotes which pair-wise discrimination………..……151
Figure 5.5 Shared movement plans for the hand and tool decoded in posterior parietal and premotor cortex. Decoding accuracies are shown for the Plan phase only (epoch-related decoding; left column) or for each time point in the trial (time-resolved decoding; right column). All accuracies are computed the same as in Figure 5.3. Significant decoding for the cross-trial-type (across-effector) approach shows that the movement goal (Grasp vs. Reach) is being represented independent of the effector (Hand vs. Tool) to be used in the action. Error bars represent standard error of the mean (SEM) across subjects. Solid black lines are chance accuracy level (50%). Asterisks assess statistical significance with 2-tailed t-tests across subjects with respect to 50% (*=p<0.05; **=p<0.01; ***=p<0.005; ****=p<0.001). Note that to minimize the number...154
Figure 5.6 Movement plans for the hand and tool decoded from parieto-frontal cortex. Decoding accuracies are shown for each trial time phase (Preview, Plan, and Execute) for the parietal ROIs (A) and frontal ROIs (B).
Classifier training was done on single trials and tested on the average activity patterns of the single trials for each condition in the independent test data set. Note that only standard pattern classification is shown here; cross-trial-type decoding between the hand and tool for each trial time phase is shown in Figure 5.7. Error bars represent standard error of the mean (SEM) across subjects. Solid black lines are chance accuracy level (50%). Asterisks assess statistical significance with 2-tailed t-tests across subjects with respect to 50% (*=p<0.05; **=p<0.01; ***=p<0.005; ****=p<0.001)……….……….157
Figure 5.7 Cross-trial-type decoding reveals shared movement plans for the hand and tool in parieto-frontal cortex. Cross-trial-type decoding accuracies are shown for each trial time phase (Preview, Plan, and Execute) for the parietal ROIs (A) and frontal ROIs (B). Across-effector decoding
xxiii
with significant decoding for this cross-trial-type approach show where the movement goal (Grasp vs. Reach) is being encoded independent of the effector (Hand vs. Tool) used. Error bars………...…….159
Figure 5.8 Classifier decoding accuracies in non-brain control regions.A) Non-brain control ROIs defined in each subject (denoted in light yellow; example subject shown). B) Classifier accuracies for the right ventricle (left) and outside the brain ROI (right) for each of the trial epochs. Error bars represent SEM across subjects. Solid lines show chance classification accuracy (50%). Note that no significant differences were found with 2-tailed t-tests across subjects with respect to 50% chance. C) Percent signal change activity from each selected region, averaged across voxels and subjects...161
Figure 6.1 Figure 6.1: Summary of findings from the three projects. Linked to each parieto-frontal brain area is a brief description of the intention-related decoding profiles discovered in that particular region across the three projects (P1, P2, and P3, where applicable...…...………..…177
Figure 6.2 Upcoming grasp and reach movements predicted from early visual cortex activity based on a re-analysis of Project 1 data. Non-foveal early visual cortex activity shown in the brain of one representative
subject (A) corresponding to the approximate lower visual field location of the centrally-located object (B). Visual cortex activity in A was localized by the contrast of Preview > Baseline. C) Classifier decoding accuracies (left) correspond to the visual cortex activity in A for the three trial phases examined in Project 1 (Preview, Plan and Execute) according to the three possible pair-wise comparisons (right). Errors bars represent SEM across subjects. Solid black lines………...……..…202
Figure 6.3 Upcoming reach and eye movements predicted from early visual cortex activity based on a re-analysis of Project 2 data. Non-foveal visual cortex activity shown in the brain of one representative subject (A)
corresponding to the approximate lower visual field locations of both the left- (in orange) and right- (in turquoise) positioned objects (B). In B, objects are shown from subject point of view. Visual cortex activity in A
was localized by the contrast of Preview > Baseline. C) Classifier
decoding accuracies (left) correspond to the visual cortex activity in A for the three trial phases examined in Project 2 (Preview, Plan and Execute) according to four pair-wise comparisons (right). Note that color-coded borders around each set of decoding accuracies in C correspond to the visual cortex activity from one hemisphere. Interestingly, also note that in both early visual areas ...………..204
xxiv
B) Experimental setup shown from subject point of view. C) Classifier decoding accuracies (left) correspond to the left and right LOC activity in
xxv
List of Appendices
APPENDIX A: Documentation of ethics approval ………....219
xxvi
3D: three dimensional
AC-PC: anterior commissure-posterior commissure
AIP: anterior intraparietal area
aIPS:anterior intraparietal sulcus
BMI: brain machine interface
BOLD: blood oxygenation level dependent
EPI: echo-planar image
FA: flip angle
fMRI: functional magnetic resonance imaging
GABA: gamma-aminobutyric acid
GLM: general linear model
IPS: intraparietal sulcus
ITI: intertrial interval
LED: light-emitting diode
LIP: lateral intraparietal area
LOC: lateral occipital complex
M1: primary motor area
MIP: medial intraparietal area
midIPS: middle intraparietal sulcus
MRI: magnetic resonance imaging
MVPA: multi-voxel pattern analysis
pIPS: posterior intraparietal sulcus
PMd: dorsal premotor area
PMv: ventral premotor area
POS: parieto-occipital sulcus
Post. aIPS: posterior anterior intraparietal sulcus
PPC: posterior parietal cortex
Pre-SMA: presupplementary motor area
RFX: random effects analysis
ROI: region of interest
s: seconds
SEM: standard error of the mean
SMA: supplementary motor area
SMG: supramarginal gyrus
SPOC: superior pareito-occipital sulcus
SS cortex: somatosensory cortex
SVM: support vector machine
T1: anatomical magnetic resonance image
T2*: functional magnetic resonance image
TE: time to echo
TMS: transcranial magnetic stimulation
V1: primary visual area
V2: secondary visual area
xxvii
Chapter 1
1. General Introduction
1.1 Movement and the Brain
How does the human brain plan movements of the body? Understanding the intimate links
between the processes of the brain and body has been a problem that has captivated philosophers, economists, psychologists, physiologists, neuroscientists, medical doctors, and robotics
researchers alike for decades, and in some cases, centuries. The importance of understanding this relationship is by no means trivial: Movement of the body is the only meaningful way we have of interacting with our surrounding environment. Action provides us with the ability to
communicate ideas with others (e.g., speech, hand gestures), to change and adapt our
surroundings through the manipulation of objects (e.g., relocating items of interest), and to travel from point A to point B (e.g., walking, running, driving). It also gives us -- in the hands of the most skilled speakers, artists, writers, and musicians -- the ability to captivate imagination, stir emotions, unite and divide peoples, and fascinate much of the world. To be sure, the significance of being able to control movement in our everyday lives becomes all too clear in the many cases of individuals suffering from neurological disease, injury or limb loss. Thus, understanding the tight linkage between the brain and body and more specifically, the cortical basis of movement planning and control, is not just an abstract exercise but an important endeavor if we are to understand the many cases of sensorimotor dysfunction and provide rehabilitative programs and recovery-of-function options for individuals and patients.
A basic premise embedded in the question posed at the beginning of this thesis is of course, that it is in fact the brain that is responsible for controlling actions of the body. Based on a rather considerable and august literature, we know this fact to be only partially true. For instance, at the lowest-levels of motor control, movements of the body are in effect initiated by spinal motor
neurons, whose activity then leads to the contraction or relaxation of different muscle groups, which themselves subsequently cause movements of the skeletal components to which they are
spinal motor neurons and muscle fibres in order to drive large systematic changes that can be observed at the behavioral level (e.g., moving a limb or finger). The focus of the present thesis, however, is not concerned with understanding motor control at these lower kinematic and mechanical levels (already well described in detail elsewhere) but rather at elucidating the
higher-level cognitive processes in the brain that lead to voluntary movement.
In nature, goal-directed purposeful movements in primates largely result as a consequence of a complex interplay between several specialized subregions within the brain (Wise, 1985; Schall and Thompson, 1999; Kandel et al., 2000, pp 653-867; Rizzolatti and Luppino, 2001; Andersen and Buneo, 2002; Cisek and Kalaska, 2010; Filimon, 2010) that together, through their
coordination, instruct the spinal cord on which specific movements to implement. The specific aim of the current work was to understand both how and where in the human brain high-level goal-directed action plans for movement are coded. In particular, the first objective of these projects was to determine whether we could actually ‘decode’ the content of a subject’s movement decision from the preparatory brain activity patterns that form prior to movement onset, and thus in doing so, accurately predict their upcoming actions and behavior – as I will outline in the pages below, this feat of ‘mind-reading’ or ‘decoding’ motor intentions was in itself a significant technical hurdle. The second and more overarching goal of these projects was to determine whether different regions of the human brain could be characterized and
differentiated based on the types of movements they can predict. This second goal relates to the notion that the primate brain contains several specialized subpopulations of neurons and signals that reflect different motor intentions of the individual (e.g., to move the eyes vs. arm, to move to the left vs. right) and has served as a recurring theme in non-human primate neural recording studies (Andersen et al., 1997; Andersen and Buneo, 2002; Fecteau and Munoz, 2003; Cisek and Kalaska, 2010). To date, however, a similar understanding of the human brain signals and neural
organization that guide high-level processes like action planning has remained elusive. By using these two main experimental objectives to focus the types of questions asked in the current
research projects, I hypothesized that some of our findings might provide critical insights into the underlying neural mechanisms that govern the planning of human hand and eye movements and perhaps also, based on previous observations of intention-related activity in the monkey, inform inferences about potential homologies between human and monkey brain areas.
individual, and in effect, predict upcoming behaviors. Project 2 then sought to map-out the planning-related cortical processes that govern eye and hand movements in humans and in doing so, offer more substantive comparisons with the same types of neural processes well
characterized in monkeys. In the third and final project we asked whether the planning of
different tool-related movements could be decoded from human brain activity and if so, how these intention-related activity patterns compared to the activity patterns elicited when the same types of movements were planned with the hand alone. In many ways, it was actually in this last project that we were able to address largely new types of experimental questions related to action planning that had not already been previously answered within the domain of non-human
primate neurophysiology.
Rather than overwhelming the reader with an exhaustive and historical review of the previous motor control and action-related literature – which is quite substantial (Andersen et al., 1997; Wise et al., 1997; Andersen and Buneo, 2002; Goodale and Milner, 2004; Castiello, 2005; Castiello and Begliomini, 2008) -- the goal of this introduction will be instead to provide a more concise and focused overview of the current state of the field, with a level of detail appropriate for understanding the overall scope and aims of the proposed research. As such, I intend to delineate the boundaries of our current understanding of movement planning processes in
primates and, as a useful springboard for the experiments provided here, highlight in a few cases what remains largely uncharted territory in humans.
1.2 Human and Monkey Brain areas important for the control of action
Nearly all aspects of normal, everyday visually-guided object-directed behavior (e.g., reaching out to pick up an object) first begins with a simple retinal representation of the target object to be acted upon. Visual processing of this retinal information is then carried out by a successive chain
of early visual cortical areas (e.g., V1, V2, V3, etc.) with each extracting increasingly complex features of the target stimulus (e.g., lines, orientation, colour, etc.)(Livingstone and Hubel,
perceptual processing, the visual features directly relevant for movement planning (e.g., location, distance, etc.) are extracted and processed (Andersen and Buneo, 2002; Goodale and Milner, 2004). It is here, in these highly interconnected parieto-frontal brain regions, that higher-level cognitive aspects of movement like intention and decision are coded (Andersen and Buneo,
1.2.1 Movement-related areas in premotor cortex
The critical role that several frontal cortical areas play in movement generation has been well documented for more than a century (Fritsch and Hitzig, 1870; Ferrier, 1876, 1890; Sherrington,
1906; Penfield and Boldrey, 1937; Graziano, 2009 for a detailed review). Perhaps the best described of these frontal action-related areas is primary motor cortex (M1), which provides the primary source of descending motor commands to the spinal cord (Murray and Coulter, 1981; Toyoshima and Sakai, 1982; Porter and Lemon, 1993; Dum and Strick, 2002; Chouinard and Paus, 2006). Consistent with these outputs, much of the neural activity in M1 can be described in lower-level muscle control terms like force, direction, and speed (Evarts and Thach, 1969; Schwartz, 1994; Todorov, 2000; Kalaska, 2009, although see Graziano, 2006). In addition to these intrinsic factors, some lines of evidence also point to M1 as playing a role in coding for extrinsic factors, like movement direction or limb trajectory (Georgopoulos et al., 1986; Georgopoulos et al., 1988; although see Scott et al., 2001). Lesions to the area produce several movement-related deficits like inappropriate force scaling for objects and an impairment in individual finger movements (e.g., Porter and Lemon, 1993; Schieber and Poliakov, 1998; Fogassi et al., 2001; Murata et al., 2008). Regions anterior to M1 in the frontal lobe appear to be involved in higher-level aspects of action planning and decision-related processes (Wise, 1985; Miller and Cohen, 2001; Rizzolatti and Luppino, 2001). These anterior premotor areas have far fewer direct spinal connections but are highly interconnected with each other and M1 (Murray and Coulter, 1981; Toyoshima and Sakai, 1982; Dum and Strick, 1991, 2002; Chouinard and Paus, 2006; Boudrias et al., 2009) and several of these areas can be subdivided based on their activation preferences. For instance, the activity in some premotor areas appears to be linked to the effector to be used in an upcoming movement (arm vs. eyes) and/or the type of hand
movement to be performed (reach vs. grasp actions). Although premotor cortex can be
Figure 1.2: Action-related areas of frontal cortex shown on the cortical surface of a macaque monkey (A) and human (B) brain. The cortical surfaces were defined at the gray-white matter boundary and have been partially inflated to reveal regions within the sulci while preserving a sense of curvature. Brain areas are color-coded according to the current consensus on the ascribed function of each area based on neurophysiological recordings in monkeys (A) and fMRI in humans (B). Areas coded with similar color suggest possible functional homologies between humans and monkeys. PMd = premotor dorsal cortex, PMv = premotor ventral cortex. FEF = frontal eye fields. PMd and FEF are similarly color-coded in the human due to the
One area that appears integral to reach planning is dorsal premotor (PMd) cortex, an area located near the junction of the arcuate and principal sulci and lying on the posterior bank of the arcuate sulcus in monkeys (Rizzolatti and Luppino, 2001) and at the junction of the precentral and superior frontal sulci in humans (Chouinard and Paus, 2006, see Figure 1.2). PMd contains
neurons responsive to arm movements (Weinrich and Wise, 1982; Weinrich et al., 1984;
Caminiti et al., 1990; Beurze et al., 2007), shows activity specific for reach direction (Pesaran et al., 2006; Batista et al., 2007; Andersen and Cui, 2009) and encodes the target and arm to be used in an upcoming reach in both humans and monkeys (Boussaoud and Wise, 1993; Hoshi and Tanji, 2006; Beurze et al., 2010). Congruent with these observations, microstimulation of PMd in monkeys also induces a complex array of ecologically-relevant movements like reaching and grasping (Graziano et al., 2002; Graziano, 2006; Graziano and Aflalo, 2007). Beyond this critical role in hand movement planning, however, it remains to be determined what other functions PMd might play in goal-directed behavior.
Another important action-related region in premotor cortex is the frontal eye fields (FEF), located on the anterior bank of the arcuate sulcus near the junction of the arcuate and principal sulci in monkeys (Schall and Thompson, 1999; Rizzolatti and Luppino, 2001, see Figure 1.2A). As its name implies, the area is predominantly involved in the planning and execution of eye movements and is the main oculomotor control center in frontal cortex (Bruce and Goldberg, 1985; Bruce et al., 1985; Schlag and Schlag-Rey, 1987; Goldberg and Bruce, 1990; Schall and Thompson, 1999; Fecteau and Munoz, 2003). Commensurate with this, FEF neurons send prominent projections to the superior colliculus located in the midbrain, one of the final command centers for initiating eye movements. In the human, however, given the close anatomical proximity of both FEF and PMd combined with the comparatively poorer spatial resolution of fMRI (see Figure 1.2A), their activations substantially overlap, making it difficult
to dissociate their processes (e.g., Connolly et al., 2007; Filimon, 2010, this is meant to be reflected in Figure 1.2B).
for hand shaping (Rizzolatti and Luppino, 2001). For instance, PMv contains neurons that in addition to coding for certain types of hand actions -- like whole-hand prehension, precision grasping and individuated finger movements (Rizzolatti et al., 1998; Raos et al., 2006) – show selectivity for certain object properties like size, shape and orientation (Murata et al., 2000; Fluet
et al., 2010). These neurons can be activated by the mere visual presentation of a graspable object and are thought to play an facilitatory role in the visual-motor transformations necessary for object grasping (Rizzolatti and Luppino, 2001) -- a suggestion reinforced by the observation that the visual specificity of a neuron closely matches its motor specificity (Murata et al., 2000; Fluet et al., 2010). Furthermore, muscimol (GABA-agonist) inactivation of PMv markedly impairs both hand preshaping and posture for object-directed grasping (Fogassi et al., 2001). Several of these findings in monkeys have been confirmed in humans. Transcranial magnetic stimulation (TMS) applied to human PMv, which interferes with the neural processing within a region, will disrupt the grasping phase of grasp-to-lift task (Davare et al., 2006) and fMRI
activity in PMv is readily observed during any grasping task (e.g., Cavina-Pratesi et al., 2010). In addition, human PMv also encodes 3D object properties in the context of object grasping (e.g., Joly et al., 2009), commensurate with an integral role in computing the sensorimotor
transformations for grasping in humans as well.
It is important at this point to note that the aforementioned specialized subdivisions of premotor cortex do not appear to be simply organized at random. Rather, these specializations seemingly reflect their distinct patterns of interconnectivity with similarly specialized subregions in PPC (Johnson et al., 1996; Matelli and Luppino, 2000; Andersen and Buneo, 2002; Tanne-Gariepy et al., 2002). In fact, beyond premotor regions sending projections to M1 and their immediate interconnections with each other, a predominant source of its incoming signals and a main recipient of its outgoing signals is the PPC (Matelli and Luppino, 2000; Tanne-Gariepy et al.,
2002). This of course, raises the question, what then is being coded in the PPC? I will now briefly turn to describe some of its important functional properties.
1.2.2 Movement-related areas in PPC
cortex responds to somatosensory stimulation (Mountcastle, 1957) whereas the posterior aspect shows a variety of neural properties related to spatial attention and awareness (Critchley, 1953; Ungerleider and Mishkin, 1982; Colby and Goldberg, 1999). Perhaps, most notably, damage to the PPC and surrounding structures can often cause a lack of awareness or ‘neglect’ to the
contralesional side of space (Critchley, 1953; Goodale and Milner, 2004; Husain and Nachev, 2007). More recently, however, there has been an explosion of neural findings that also implicate the PPC in cognitive processes related to movement planning (Mountcastle et al., 1975;
Andersen et al., 1997; Snyder et al., 1997; Andersen and Buneo, 2002; Cisek and Kalaska, 2010) – a fact that again is perhaps not surprising, given that its anatomical position would allow it to serve as an useful interface between sensory and motor systems. Consistent with a role in sensorimotor transformations and intention- and decision-related processes, neural recording studies in monkeys and fMRI studies in humans have found a diverse range of sensory, cognitive and motor-related properties in the PPC (Culham and Valyear, 2006; Gold and Shadlen, 2007; Cisek and Kalaska, 2010). Commensurate with this prominent sensorimotor role, patients with PPC lesions can also suffer from a variety of deficits related to movement - deficits that are neither exclusively motor nor sensory in nature. For instance, damage to the PPC can cause optic ataxia -- a disorder characterized by the patient having difficulty in localizing periperhal target locations for reaches (Perenin and Vighetto, 1988) -- and/or one of the apraxias -- disorders most often characterized by a difficulty in planning goal-directed movements (Haaland et al., 1999, 2000). As an aside, it should be noted that this fairly inclusive description of the PPC as a sensorimotor interface might also be overly simplistic: The PPC has been implicated in
subserving a dizzying array of high-level sensorimotor and cognitive functions, including action planning and coordinate transformations (Andersen and Buneo, 2002), decision-making and value-estimation (Gold and Shadlen, 2007), forward state estimation and prediction (Wolpert et
Similar to the organization found in frontal cortex, the PPC also contains a mosaic of specialized subregions used for controlling the movement of different body parts (e.g., arm, hand, eyes) and producing desired motor acts and goals (Blatt et al., 1990; Andersen and Buneo, 2002; Culham et al., 2006, see Figure 1.3). Consistent with these subdivisions, microstimulation of different parts
An important brain area involved in reaching in human PPC is the superior parieto-occipital cortex (SPOC), a putative human homologue of area V6A in the monkey (Pitzalis et al., 2006, see Figure 1.3), located slightly anterior to the parieto-occipital sulcus. Neurons in monkey V6A show sensitivity to reach direction and encode targets for reaching (Galletti et al., 1997; Galletti
et al., 2003) and damage to the area leads to misreaching errors (Battaglini et al., 2002). In humans, TMS disruption (Vesia et al., 2010) or cortical damage (Karnath and Perenin, 2005) to SPOC can produce errant reach trajectories and fMRI evidence points to its direct involvement in reach execution (Prado et al., 2005; Bernier and Grafton, 2010; Cavina-Pratesi et al., 2010) but to date, its precise role in reach planning has yet to be well demonstrated. Just anterior to SPOC is the Precuneus, an area also implicated in reaching actions (Filimon et al., 2009; Bernier and Grafton, 2010). In addition, this region shows selectivity for pointing actions (Connolly et al., 2003; Fernandez-Ruiz et al., 2007) as well as for both observed and imagined reaching (Filimon et al., 2007). Although SPOC and the Precuneus are often co-activated in a variety of reach tasks, they may in fact be functionally distinct (e.g., Filimon et al., 2009; Bernier and Grafton, 2010) -- a notion supported by differences in the underlying cytoarchitecture (Scheperjans et al., 2008b; Scheperjans et al., 2008a). Nevertheless, both of these areas appear functionally interconnected with a more anterior region in the middle IPS (midIPS, Matelli and Luppino, 2000) -- also heavily implicated in reach planning and execution (e.g., Snyder et al., 1997) – and with the reach-related PMd located in frontal cortex.
While exact functional homologies between midIPS in the human and monkey remain unclear, the general anatomical region in monkeys codes for both eye and arm movements. For instance, the lateral intraparietal (LIP) area, located on the lateral bank of the middle IPS in monkeys (Figure 1.3) contains neurons more selective for eye movements than reaching movements (Snyder et al., 1997; Cui and Andersen, 2007) and it is anatomically interconnected with FEF in
frontal cortex (Andersen et al., 1985a; Andersen et al., 1990; Anderson et al., 2011). Consistent with this, LIP activity represents upcoming decisions related to eye movements (Gold and
movements (Batista et al., 1999) and sends prominent projections to PMd in frontal cortex (Tanne-Gariepy et al., 2002).
In contrast to the monkey, it has been much more difficult to isolate and dissociate arm and eye
movement-related activity from human midIPS. This difficulty may be due to several different non-mutually exclusive factors: 1) The neuroanatomical locations of LIP and MIP lie directly adjacent to eachother in the monkey brain and in comparison to single neuron recordings, fMRI has far poorer spatial resolution to allow for similar levels of detection, 2) there may actually be less effector-specificity in human compared to monkey cortex (Heed et al., 2011), 3) despite similarities in neuroanatomical position, human midIPS may not house the functional
homologues of LIP and MIP in the monkey and 4) the signals being measured by fMRI do not reflect a one-to-one relationship with the action potentials recorded from neural electrodes in monkeys (Logothetis et al., 2001)(many of these important issues will receive further discussion in the pages that follow). What we do know for certain is that the degree of fMRI activation overlap for reaching and saccades in the IPS is generally quite high and varies across studies (Astafiev et al., 2003; Connolly et al., 2003; Culham et al., 2006; Beurze et al., 2007; Hagler et al., 2007; Levy et al., 2007; Filimon, 2010), and this issue is unquestionably further compounded by the fact that neurons showing arm-specificity can be found on both the lateral and medial banks of the midIPS (Snyder et al., 1997; Calton et al., 2002; Chang and Snyder, 2010). No doubt this dense intermingling and multiplexed organization of arm- and eye-related neurons in the IPS facilitates the coupling of both effectors and their coordination (Andersen and Buneo, 2002; Andersen and Cui, 2009), as is likely the case for PMd and FEF in premotor cortex. Nevertheless, for significant advances to be made in our understanding of these same neural populations in humans an fMRI technique able to differentiate these highly distributed and overlapping neural activations would seem critical.
Caudal to the midIPS is another functional subdivision, the posterior IPS (pIPS), implicated in a
wide assortment of cognitive- and visual-motor-related functions in humans (Figure 1.3). For instance, human pIPS is activated in experimental tasks requiring visual selection and attention (Wojciulik and Kanwisher, 1999; Szczepanski et al., 2010) and it encodes both target- and effector-related information for movement (Beurze et al., 2007, 2009). Neural evidence from monkeys also suggests that the caudal IPS also encodes 3D object features relevant for