© 2015, IJCSMC All Rights Reserved 246
Available Online atwww.ijcsmc.com
International Journal of Computer Science and Mobile Computing
A Monthly Journal of Computer Science and Information Technology
ISSN 2320–088X
IJCSMC, Vol. 4, Issue. 10, October 2015, pg.246 – 258
RESEARCH ARTICLE
Binary Sequences Randomness
Test Using Neural Networks
Kadhim M. Hashim
1, Wijdan R. Abdulhussien
21
College of Education for Pure Science, 2College of Computer and Mathematical Science
Computer Science Dept. , Thi-Qar University
Abstract
It is impossible to give a mathematical proof that a generator of sequences of random numbers which is a necessity by many practical applications is indeed a random generator .In this paper we discuss the problem of randomness test and propose a new approach for testing by using Multilayer Backpropagation Neural Networks .The proposed method is focused on take fixed length of binary sequences (Random or not) by testing using randomness tests as data for training and designing neural network for training ,then using it for testing any entering sequence for determining its randomness.
The network has been training on numbers of binary sequences by using various structures (various hidden layers and neuron at each one). The best results have been obtained using three hidden layers and seven neurons at each ones with an error (0.0008) .Testing the network on another number of binary sequences, the network was very good to determining the entire sequence if it is random or not, because the network has the property to distinguish very important characteristics that must be found in random sequences. Hence this approach may be used to test the randomness of any input sequence before used as a key bits in cryptographic systems. The main strength of the proposed approach that it combines the properties of random sequences because the neural network trained once and used many times to identify the randomness of entering sequences at very fast time and high accuracy.
© 2015, IJCSMC All Rights Reserved 247
1. Introduction
The necessity of testing the randomness of bit sequence arises in many fields, such as modeling, simulations and cryptography. For example, the security of many cryptographic systems depends on the generation of unpredictable values to be used as keys, passwords, challenges or unique identifiers [1].In other words, the quality of such applications depends on generating unpredictable (random) sequence of quantities. From the practical point of view, such sequence must be of sufficiently large size in the sense that the probability of any particular value being selected must be sufficiently small in order to prevent an adversary from optimizing a search scheme based on such probability[2].
Randomness may be tested either by theoretical analysis or by statistical tests. Both methods are equally valid in the sense that a particular defect may be detected by either method. Some defects are most easily detected by theoretical analysis; other defects are easier to detect experimentally. Thus, it is recommended that a generator be subjected to both types of testing. The discipline of designing random number generators has reached a state where good generators pass all experimental tests [3].
It is impossible to give a mathematical proof that a generator is indeed a random bit generator. Each test determines whether a sample sequence verifies a probability property that a truly random sequence would have, so they help detect certain kinds of weaknesses the generator may have [4].
2. Randomness
A data set appears random if past values contain no apparent information about future values. However, we can find a transformation, that clearly improves prediction accuracy, then the data is not random. As in the cryptography example, the amount of information in a data set may appear negligible. It's the ability to find the transformation, that will determine how accurately the future can be predicted [5].
2.1 Randomness tests
Randomness tests are used to analyze the distribution pattern of a set of data. In stochastic modeling, as in some computer simulations, the expected random input data can be verified, by a formal test for randomness, to show that the simulation runs
were performed using randomized data.
There are many practical measures of randomness for a binary sequence. These
include measures based on statistical tests,transforms, and complexity or a mixture of
these.
These practical tests make it possible to compare and contrast the randomness of strings. On probabilistic grounds, all strings, say of length 64, have the same randomness. However, consider the following two strings:
String 1:
© 2015, IJCSMC All Rights Reserved 248
String 2:
1100100001100001110111101110110011111010010000100101011110010110
The first string admits a short linguistic description, namely "32 repetitions of '01'", which consists of 20 characters, and it can be efficiently constructed out of some basis sequences. The second one has no obvious simple description other than writing down the string itself, which has 64 characters, and it has no comparably efficient basis function representation. The first of these sequences will be found to be of much less randomness than the second one, which agrees with intuition [6].
2.1.1 Statistical Tests
There are many techniques described in the literature for generating random and pseudorandom bits and numbers. In order to make sure that such generators are secure enough, they should be subjected to a variety of statistical tests designed to
detect the specific characteristics expected of random sequences[2].
Randomness is a probabilistic property; that is, the properties of a random sequence can be characterized and described in terms of probability .There are number of possible statistical tests, each assessing the presence or absence of a “pattern” which, if detected, would indicate that the sequence is nonrandom [7].
Some tests are decomposable into a variety of subtests, some of the statistical tests are:
1. The Frequency (Monobit) Test,
2. Frequency Test within a Block,
3. The Runs Test,
4. Test for the Longest-Run-of-Ones in a Block,
5. The Binary Matrix Rank Test,
6. The Discrete Fourier Transform (Spectral) Test,
7. The Non-overlapping Template Matching Test,
8. The Overlapping Template Matching Test,
9. Maurer's "Universal Statistical" Test,
10. The Linear Complexity Test,
11. The Serial Test,
12. The Approximate Entropy Test,
13.The Cumulative Sums (Cusums) Test,
14. The Random Excursions Test, and
© 2015, IJCSMC All Rights Reserved 249
Here, explanation of some of these tests:-
2.1.1.1 Runs Test
The purpose of the runs test is to determine whether the number of runs of ones and zeros of various lengths is as expected for a random sequence. In particular, this test determines whether the oscillation between such zeros and ones is too fast or too slow.
This test can be described as follows:-
(1) Compute the pre-test proportion p of ones in the input sequence: ∑
For example, if e = 1001101011 , then n=10 and = 3/5.
(2) Determine if the prerequisite Frequency test is passed: If it can be shown that
| ⁄ | then the Runs test need not be performed (i.e., the test should not have been run because of a failure to pass test 1, the Frequency (Monobit) test). If the test
is not applicable, then the P-value is set to 0.0000. Note that for this test
√ , has
been pre-defined in the test code [7].
For the example in this section, since
√ , then | ⁄ |
| ⁄ ⁄ | , and the test is not run.
Since the observed value is within the selected bounds, the runs test is applicable.
(3) Compute the test statistic ( ) ∑ ( ) , where ( ) if
, and otherwise.Since , then ( )
( )
(4) Compute P-value [| ( ) ( )| √ ( ) ] .
For the example, P-value [| ( )|
√ ( )]
. The decision Rule (at the 1 % Level) depend on the p-value
If the computed P-value is < 0.01, then conclude that the sequence is non-random. Otherwise, conclude that the sequence is random.
. for example
(Input)
00001000110100110001001100011001100010100010111000
(input) n = 100
© 2015, IJCSMC All Rights Reserved 250
(processing) p = 0.42
(processing) Vn(obs) = 52
(output) P-value = 0.500798
(conclusion) Since P-value >= 0.01, accept the sequence as random.
2.1.1.2 Frequency Test
develops frequency distribution of individual samples, uses the chi-square test to compare the distribution of the set of numbers generated to a uniform distribution.
2.1.1.3 Serial Test
Develops frequency distribution of pairs of samples, Then we compare the actual distribution against this expected distribution, using the chi-square test.
In addition, the following tests have been described in [2].
2.1.1.4 Poker Test
Treats numbers grouped together as a poker’s hand. Then the hands obtained are compared to what is expected using the chi-square test.
2.1.1.5 Autocorrelation Test
Tests the correlation between numbers and compares the sample correlation to the expected correlation of zero.
2.1.1.6 The Gap test
is used to examine the length of “gaps” between occurrences of samples in a certain range. It determines the length of consecutive subsequences with samples not in a specific range.
3. Artificial Neural Networks (ANNs)
The Artificial Neural network (ANN) is an abstract computer model of human brain. It consists of a set of nodes, usually organized into layers, and connected through weight elements called synapses. At each node, the weighted inputs are summed (aggregated), threshold, and subjected to an activation function in order to generate the output of that node [8, 9]. These operations are shown in Figure (1) and the output is generated according to
© 2015, IJCSMC All Rights Reserved 251
where are neuron inputs, are the synaptic weights, and f [.] is the activation
function.
Figure 1 the operations at a node of a neural network [10]
Artificial neural networks (ANNs) learn from experience and generalize from previous examples. They modify their behavior in response to the environment, and offer certain advantages: the generalization capability, parallelism, and learning [11].
Trainingis the algorithmic procedure whereby the parameters of the neurons of the
network are estimated, in order to make the neural network fulfill, as accurately as possible, the task it has been assigned to .The three well-known and most often used learning mechanisms are the supervised, the unsupervised (or self-organized) and the reinforced ,and there are two main classes of neural networks known as feedforward networks (or static networks) and feedback networks (or recurrent networks) [8,12].
4. Experimental Results
It is necessary to subject the generated sequence to all possible statistical tests before accepting it in important applications such as cryptographic applications and the randomness is related to the unpredictable property; therefore we have been designed and trained a Multilayer Backpropagation Neural Networks to determine the randomness of binary sequences because the quality should be measured by means of
different statistical tests, since any statistical defect can be used by an attacker to gain
information about the future output.
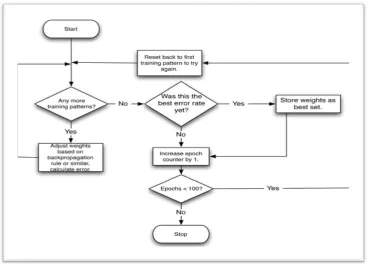
The flowchart for supervised training is explained in figure 2, where the objective is to minimize the error function for mean square error (MSE):
© 2015, IJCSMC All Rights Reserved 252
Where and : denote real and desired outputs, respectively, P : number of
training data.
Figure 2 the general flow chart for the supervised learning
by testing all the data set to determine which of it has the randomness property ,the desired output is (1) for random sequences (that success all tests) and (0) for non-random (that fails in two or more tests)),the data sets of various number of binary sequences (1000,1500,2000) that consist of random and nonrandom sequences have been used 80% for training and 20 % for testing ,this is described in table1,the length of every binary sequence is (30) bit.
Table (1) the data sets used for training and testing
Data sets Failed
(Non random)
Success
(random)
training testing
800 200 350 650
1200 300 600 900
1600 400 900 1100
© 2015, IJCSMC All Rights Reserved 253
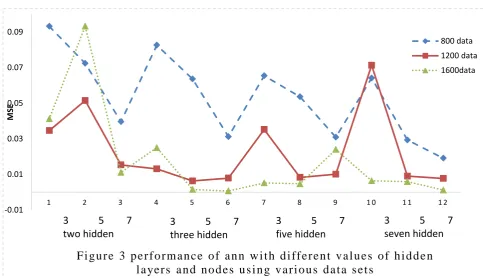
error for different number of neurons and hidden layers , table 2 illustrates their MES errors for 100 epochs .
Table (2) the best MSE error using different numbers of data, hidden layers and neurons
Data set MSE 1600 1200 800 No. neurons
No. hidden layer
0.0412 0.0346 0.0932 3 2 0.0933 0.0515 0.0724 5 0.0111 0.0153 0.0396 7 0.025 0.0131 0.0826 3 3 0.0015 0.0063 0.0636 5 0.0008 0.0079 0.0312 7 0.0.0052 0.0352 0.0654 3 5 0.0047 0.0083 0.0536 5 0.024 0.0101 0.0309 7 0.0064 0.0713 0.0641 3 7 0.0059 0.009 0.0293 5 0.0012 0.0077 0.0191 7
As notice from the results, that the best performance for these networks has been attained at (MSE=0.0008) with (training data =1600, hidden layers=3 and number of neuron=7 at each hidden layer). Figure 4 illustrate the structure for the best topology of Multilayer Backpropagation Network.
-0.01 0.01 0.03 0.05 0.07 0.09
1 2 3 4 5 6 7 8 9 1 0 1 1 1 2
M
SE
F i gu r e 3 p e r f o r m a n c e o f a n n w i t h d i ff e r e n t v a l u e s o f h i d d e n l a ye r s a n d n o d e s u s i n g v a r i o u s d a t a s e t s
800 data 1200 data 1600data
3 5 7 two hidden
3 5 7 three hidden
3 5 7 five hidden
© 2015, IJCSMC All Rights Reserved 254
Figure 4 the structure for the best topology of Multilayer Backpropagation Network
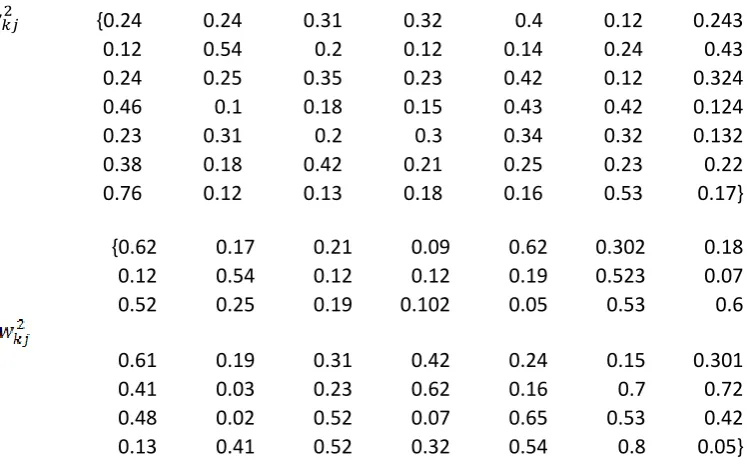
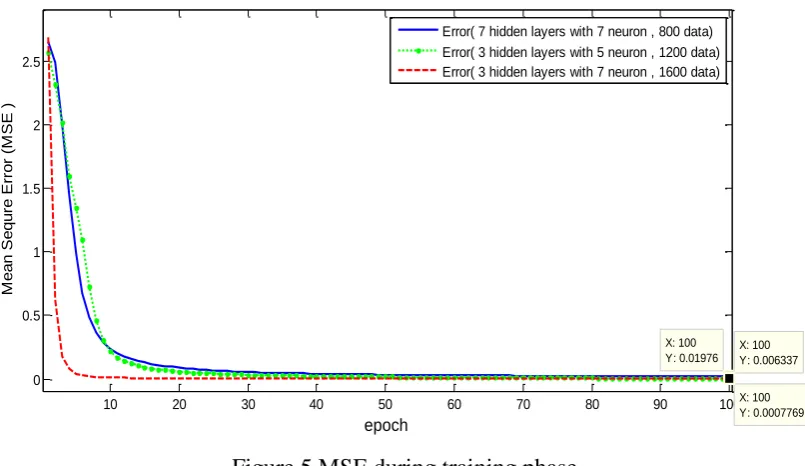
Figure 5 shows the mean square error during epochs for all training data set, using the
best one with 3 hidden layer and 7 neuron the well weights for hidden layer 2 and 3
are
{0.24 0.24 0.31 0.32 0.4 0.12 0.243
© 2015, IJCSMC All Rights Reserved 255
Figure 5 MSE during training phase
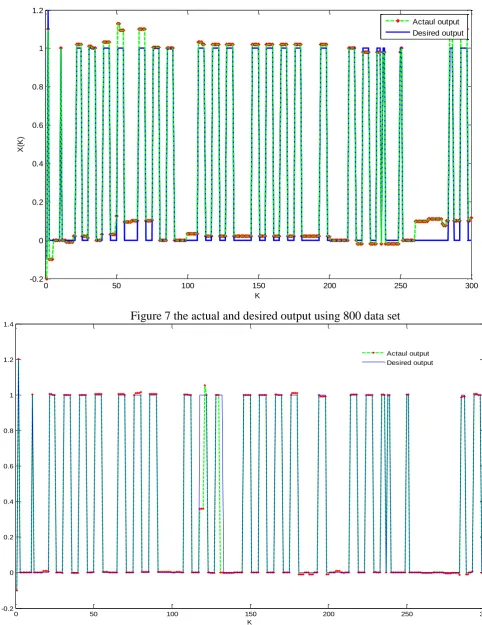
Figure 6 show the actual and desired output of the network using 800 data for
training and 200 for testing, as we see the difference cannot be distinguishable for all
data set as shown in figure 6, the following figures show the actual and desired output
for only 300 data sets using (800, 1200 and 1600) data set corresponding to the best
MSE for each one.
0 100 200 300 400 500 600 700 800 900 1000
0 0.2 0.4 0.6 0.8 1 1.2 1.4 K X (K ) actual output desired output
Training Testing
Figure 6 the actual and desired output using 1000 data set
10 20 30 40 50 60 70 80 90 100
0 0.5 1 1.5 2 2.5 X: 100 Y: 0.01976 epoch M e a n Se q u re Er ro r (M SE ) X: 100 Y: 0.006337 X: 100 Y: 0.0007769 Error( 7 hidden layers with 7 neuron , 800 data)
© 2015, IJCSMC All Rights Reserved 256
0 50 100 150 200 250 300
-0.2 0 0.2 0.4 0.6 0.8 1 1.2
K
X
(K
)
Actaul output Desired output
Figure 7 the actual and desired output using 800 data set
0 50 100 150 200 250 300
-0.2 0 0.2 0.4 0.6 0.8 1 1.2 1.4
K
X
(K
)
Actaul output Desired output
© 2015, IJCSMC All Rights Reserved 257
5. Conclusion
In this paper a multilayers neural networks are used to determine the randomness of binary sequences by using various numbers of hidden layers and neurons, we obtained the good results at 3 hidden layers and 7 neurons at each layer, hence this approach may be used to test the randomness of sequences before used it as keys at cryptography, another key must be generated if the test is fail.
Choosing the parameters for the networks such as number of membership function and the learning rates by trial and error can take time and effort, so in future works the genetic algorithm can be used to improve the performance by searching the best parameters.
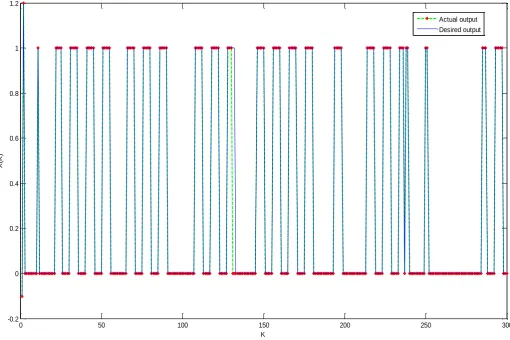
0 50 100 150 200 250 300
-0.2 0 0.2 0.4 0.6 0.8 1 1.2
K
X
(K
)
Actual output Desired output
© 2015, IJCSMC All Rights Reserved 258
References
[1] F. Koeune ,"Encyclopedia of Cryptography and Security. In: H.van Tilborg (ed.), Pseudo-Random Number Generator. Springer, Berlin, pp. 485–487, 2005.
[2] M.Wael, A.Ismail, M. Ehab "Testing randomness: Implementing poker approaches with hands of four numbers", Journal of Computer Science Vol.8 , No. 8, 1353-1357, 2012
[3] F.Agner," Chaotic Random Number Generators with Random Cycle Lengths", www.agner.org/random/theory, November 25, 2001.
[4] M. A. Pedro, I. Antonio, R. Maríad,"New Randomness Test for Bit Sequences",Informatica ,
Vilnius University , Vol. 24, No. 3, 339–356 ,2013.
[5] William .C “Prediction Theory For Control Systems", prediction systems, NC, November 20, 2014.
[6] http://en.wikipedia.org/w/index.php?title=Randomness_tests&oldid=638935347" Categories:
[7]R.SJuan,James.N,Miles.S,Elaine.B.Stefan.L,Mark.L,Mark.V,Daved.B,Alan.H,James.D,San.V, "A Statistical Test Suite For Random And Pseudorandom Number Generators For Cryptographic Applications", NIST Special Publication 800-22 Revised: April 2010. [8] F.O.Karray and C.D.Silva,“Soft Computing and Intelligent Systems Design, Theory, Tools
and Applications”, Pearson Education Limited 2004.
[9] T. Munakata, “Fundamentals of the New Artificial Intelligence Neural,Evolutionary, Fuzzy and More”, Second Edition,Springer-Verlag ,London Limited ,2008.
[10] R. A. Dilli and Y. Wang “Neural Network Forecasting of the Production Level of Chinese Construction Industry ”, journal of comparative international management, Vol. 6, No. 2 December 2003.
[11] L.C. Jain; N.M. Martin “Fusion of Neural Networks, Fuzzy Systems and Genetic Algorithms: Industrial Applications” CRC Press, 1998.
[12] G.Dreyfus, “Neural Networks Methodology and Applications”, Springer Berlin Heidelberg, New York, 2005.
![Figure 1 the operations at a node of a neural network [10]](https://thumb-us.123doks.com/thumbv2/123dok_us/1939029.1254858/6.595.129.460.128.290/figure-operations-node-neural-network.webp)