A
A
s
s
s
s
e
e
t
t
M
M
a
a
n
n
a
a
g
g
e
e
m
m
e
e
n
n
t
t
P
P
l
l
a
a
n
n
2
2
0
0
1
1
5
5
–
–
2
2
0
0
2
2
5
5
P
P
a
a
r
r
t
t
C
C
M
M
a
a
n
n
a
a
g
g
i
i
n
n
g
g
O
O
u
u
r
r
A
A
s
s
s
s
e
e
t
t
s
s
T
CONTENTS
PART C: MANAGING OUR ASSETS ... 3-1 3 SUMMARY ... 3-1 3.1 Activity Description ... 3-1 4 OVERVIEW OF THE ASSETS ... 4-1 4.1 Managing the Assets ... 4-1 4.1.1 How the network works ... 4-1 4.1.2 Contract Management, Scope and Terms of Major Contracts ... 4-1 4.1.3 Customer Service Requests and Complaints ... 4-1 4.1.4 Maintenance Decision Making Processes ... 4-4 4.1.5 Process for identifying the range of options to deliver levels of service including demand management ... 4-5 4.1.6 Selection Criteria for Asset Creation or Upgrading Projects ... 4-5 4.1.7 Asset Management Systems ... 4-6 4.1.8 Asset Management Data ... 4-7 4.1.9 New Zealand Transport Agency ... 4-8 4.2 The Services We Provide ... 4-10 4.2.1 Management of the Activity ... 4-10 4.1.2 Pavements ... 4-12 4.1.3 Waitangi Trust Road ... 4-19 4.1.4 Bridges and Large Culverts ... 4-19 4.1.5 Footpaths ... 4-22 4.1.6 Cycle Trail ... 4-24 4.1.7 Car Parks ... 4-25 4.1.8 Traffic Services ... 4-27 4.1.9 Street lighting ... 4-29 4.1.10 Drainage Facilities ... 4-31 10.1.11 Minor Structures ... 4-33 10.1.12 Quarries ... 4-35 10.1.13 Vehicular Ferry ... 4-37 10.1.14 Environmental Maintenance ... 4-38 10.1.15 Community Programmes ... 4-39 4.3 Activity Rationale ... 4-40 4.4 Key Service Drivers ... 4-40 4.4.1 Delivery of Transport Services ... 4-41 4.4.2 Policies, Strategies and Bylaws ... 4-41 4.5 Significant Negative Effects on the Activity ... 4-43 4.6 Significant Changes for the Activity ... 4-44 4.7 Strategic Goals ... 4-44 4.8 Statutory Requirements ... 4-45 4.8.1 National ... 4-45 4.8.2 Regional ... 4-46 4.8.3 District ... 4-48 4.8.4 Council’s Aim for Roads and Footpaths ... 4-48 4.8.5 Key Issues ... 4-49 4.9 Resource Consents ... 4-49 4.9.1 Consent Monitoring and Compliance ... 4-52 4.10 Potential Issues ... 4-52 4.10.1 Dust ... 4-52 4.10.2 Sediment Runoff ... 4-52
4.10.3 Noise ... 4-52 4.10.4 Landscape Values ... 4-53 4.10.5 Cultural Heritage ... 4-53 4.10.6 Landscape Values ... 4-53 4.10.7 Stormwater Discharges ... 4-53 4.11 Hazards ... 4-54 4.11.1 Coastal Erosion/Inundation ... 4-54 4.11.2 Flooding ... 4-54 4.11.3 Landslides ... 4-54 4.12 Future Requirements ... 4-55 5 LEVELS OF SERVICE ... 5-1 5.1 Existing Level of Service ... 5-1 5.2 Changes to Level of Service ... 5-2 5.3 Level of Service ... 5-4 5.3.1 Levels of Service, Performance Measures and Reporting ... 5-4 5.3.2 Risks to Delivery of the Levels of Service ... 5-10 5.3.3 Ten year plan measures and level of service ... 5-12 6 ASSET MANAGEMENT PLAN ASSUMPTIONS ... 6-1 6.1 Assumptions ... 6-1 6.2 Confidence Levels ... 6-1 7 IMPROVEMENT PLAN ... 7-1 7.1 Improvements to Asset Management Planning ... 7-1 7.2 2012 Asset Management Review... 7-4 7.1.1 Improvement Plan Status ... 7-4 7.1.2 2015/2016 – 2017/2018 Improvement Plan ... 7-4 7.1.3 Three Year Improvement Plan ... 7-5 7.1.4 GAP Analysis ... 7-8 8 FUTURE DEMAND ... 8-1 8.1 Planning for Growth ... 8-1 8.1.1 Overview of Key Demand Drivers ... 8-1 8.1.2 Population & Development Considerations ... 8-1 8.1.3 Residential & Commercial Development ... 8-1 8.1.4 Management Strategies ... 8-5 8.2 Demand Management Plan ... 8-8 8.2.1 Demand Management Strategies ... 8-9 9 SUSTAINABILITY ... 9-1 9.1 Provision for effects of failure ... 9-5 9.2 Business Continuity Plan ... 9-5 10 RISK MANAGEMENT ... 10-1 10.1 Risk Management Context ... 10-1 10.1.1 Overview ... 10-1 10.2 Risk Register ... 10-3 10.2.1 Risk Action Plan ... 10-10 10.2.2 Monitor, Measure, Report, Review Plan and Actions ... 10-10 11 ROUTINE MAINTENANCE PLAN ... 11-1 11.1 Pavements ... 11-1 11.1.1 Maintenance Planning ... 11-1 11.1.2 Future Maintenance Costs ... 11-4 11.2 Waitangi Trust Road – Special Purpose Road ... 11-5 11.2.1 Maintenance Planning ... 11-5 11.2.2 Future Maintenance Costs ... 11-5
11.3 Bridges and Large Culverts ... 11-6 11.3.1 Maintenance Planning ... 11-6 11.3.2 Future Maintenance Costs ... 11-7 11.4 Footpaths ... 11-8 11.4.1 Maintenance Planning ... 11-8 11.4.2 Future Maintenance Costs ... 11-8 11.5 Twin Coast Cycle Trail ... 11-9 11.5.1 Maintenance Planning ... 11-9 11.5.2 Future Maintenance Costs ... 11-9 11.6 Car Parks ... 11-10 11.6.1 Maintenance Planning ... 11-10 11.6.2 Future Maintenance Costs ... 11-11 11.7 Traffic Services ... 11-11 11.7.1 Maintenance Planning ... 11-11 11.7.2 Future Maintenance Costs ... 11-13 11.8 Street Lighting ... 11-13 11.8.1 Maintenance Planning ... 11-13 11.8.2 Future Maintenance Costs ... 11-14 11.9 Drainage Facilities ... 11-14 11.9.1 Maintenance Planning ... 11-14 11.9.2 Future Maintenance Costs ... 11-16 11.10 Minor Structures ... 11-16 11.10.1 Maintenance Planning ... 11-16 11.10.2 Future Maintenance Costs ... 11-17 11.11 Quarries ... 11-17 11.11.1 Maintenance Planning ... 11-17 11.11.2 Future Maintenance Costs ... 11-18 11.12 Vehicular Ferry ... 11-18 11.12.1 Maintenance Planning ... 11-18 11.12.2 Future Maintenance Costs ... 11-18 11.13 Environmental Maintenance ... 11-19 11.13.1 Maintenance Planning ... 11-19 11.13.2 Future Maintenance Costs ... 11-20 12 RENEWAL/REPLACEMENT PLAN ... 12-1 12.1 Pavements ... 12-1 12.1.1 Renewal Plan ... 12-1 12.1.2 Renewal Standards ... 12-5 12.1.3 Future Renewal Costs ... 12-5 12.2 Waitangi Trust Road – Special Purpose Road ... 12-6 12.2.1 Renewal Plan ... 12-6 12.2.2 Future Renewal Costs ... 12-6 12.3 Bridges and Large Culverts (>3.4 m²) ... 12-7 12.3.1 Renewal Plan ... 12-7 12.3.2 Renewal Standards ... 12-7 12.3.3 Future Renewal Costs ... 12-7 12.4 Footpaths ... 12-9 12.4.1 Renewal Plan ... 12-9 12.4.2 Renewal Standards ... 12-9 12.4.3 Future Renewal Costs ... 12-10 12.5 Cycle Trail ... 12-10 12.5.1 Renewal Plan ... 12-10
12.5.2 Renewal Standards ... 12-10 12.5.3 Future Renewal Costs ... 12-10 12.6 Car Parks ... 12-10 12.6.1 Renewal Plan ... 12-10 12.6.2 Renewal Standards ... 12-11 12.7 Traffic Services ... 12-11 12.7.1 Renewal Plan ... 12-11 12.7.2 Renewal Standards ... 12-11 12.8 Street Lighting ... 12-12 12.8.1 Renewal Plan ... 12-12 12.8.2 Renewal Standards ... 12-12 12.8.3 Future Renewal Costs ... 12-12 12.9 Drainage Facilities ... 12-12 12.9.1 Renewal Plan ... 12-12 12.9.2 Renewal Standards ... 12-13 12.9.3 Future Renewal Costs ... 12-13 12.10 Minor Structures ... 12-13 12.10.1 Renewal Plan ... 12-13 12.10.2 Renewal Standards ... 12-13 12.10.3 Future Renewal Costs ... 12-13 12.11 Quarries ... 12-14 12.12 Vehicular Ferry ... 12-14 12.12.1 Renewal Plan ... 12-14 12.12.2 Renewal Standards ... 12-14 12.12.3 Future Renewal Costs ... 12-14 13 NEW WORKS PLAN ... 13-1 13.1 Pavements ... 13-1 13.1.1 New Works ... 13-1 13.1.2 Summary of Future Costs ... 13-3 13.2 Bridges and Large Culverts ... 13-3 13.2.1 New Works ... 13-3 13.2.2 Summary of Future Costs ... 13-3 13.3 Footpaths ... 13-4 13.3.1 New Works ... 13-4 13.3.2 Summary of Future Costs ... 13-4 13.4 Cycle Trail ... 13-4 13.4.1 New Works ... 13-4 13.4.2 Summary of Future Costs ... 13-4 13.5 Car Parks ... 13-5 13.5.1 New Works ... 13-5 13.5.2 Summary of Future Costs ... 13-5 13.6 Traffic Services ... 13-5 13.6.1 New Works ... 13-5 13.6.2 Summary of Future Costs ... 13-5 13.7 Street lighting ... 13-5 13.7.1 New Works ... 13-5 13.7.2 Summary of Future Costs ... 13-5 13.8 Drainage Facilities ... 13-6 13.8.1 New Works ... 13-6 13.8.2 Summary of Future Costs ... 13-6 13.9 Minor Structures ... 13-6
13.9.1 New Works ... 13-6 13.9.2 Summary of Future Costs ... 13-6 13.10 Quarries ... 13-6 13.10.1 New Works ... 13-6 13.11 Emergency Works ... 13-6 13.11.1 New Works ... 13-6 13.11.2 Summary of Future Costs ... 13-7 14 DISPOSAL PLAN ... 14-1 15 FINANCIAL PROJECTIONS ... 15-1 15.1 Financial Statements and Projections ... 15-1 15.1.1 Operating Expenditure ... 15-1 15.1.2 Renewals Works (Rehabilitation and Replacement) ... 15-1 15.1.3 Capital Works (New Works) ... 15-1 15.1.4 Valuation Forecasts ... 15-28 16 ACRONYMS ... 16-1 17 GLOSSARY ... 17-1 18 APPENDIX A – NZTA TECHNICAL AND PROCEDURAL REPORTS ... 18-1 19 APPENDIX B – PAVEMENT RENEWAL STRATEGY ... 19-1 20 APPENDIX C – 2013 AND 2014 ROADING AND FERRY VALUATIONS ... 20-1 21 APPENDIX D – 30-YEAR STRATEGY REPORT ... 21-1 22 APPENDIX E – BRIDGE ASSET MANAGEMENT STRATEGY... 22-1
Document and Version Control
This is a controlled document. Copies are numbered and issued to specified individuals.
Distribution List
The following person(s) shall receive a copy of this document on release:
Name Title Organisation
Version Control
Version Revision
Date Details of Revision
Authorised Name/Position Signature
PART C: MANAGING OUR ASSETS
3
SUMMARY
3.1
Activity Description
The Far North transportation network is the third largest roading network in New Zealand. There are approximately 3,000 km of maintained roads in the district, for which Far North District Council (Council or FNDC) is responsible for 2,543.4 kms. The balance is State Highway roading under the control of the New Zealand Transport Agency (NZTA).
Transportation is Council's largest asset group. The roading, footpaths and car park assets account for 76% of Council's total fixed assets of $1.125 billion. 35% of the roading network is sealed.
The network is well established. However, a combination of increased heavy traffic loadings and some low cost seal extensions in the early to mid-1990’s may potentially create an escalating level of deterioration over the next 20 years. Increased expenditure is likely to be the consequence, in order to cost-effectively maintain and rehabilitate the road network assets over the life of this Asset Management Plan.
Table 1: Overview of the Transport Activity
Asset SubGroup Unit Quantities ORC ODRC
Annual Depn
Pavement Formation m3 13,012,631 424,211,756 424,211,756 0 SubBase m3 3,119,124 214,452,883 141,768,299 466,452 Basecourse m3 2,003,032 157,595,594 128,443,550 3,438,108 Surfaces m2 14,553,823 85,837,940 44,217,992 6,566,546 Drainage Culverts m 252,998 78,450,425 50,405,103 859,672
Catchpits/Inlets/
Outlets/ Manholes no 3,534 6,575,745 4,514,191 74,522 Surface Water
Channels m 2,107,610 13,190,045 13,071,553 19,548 Kerb and Channel m 281,411 20,049,501 11,212,399 340,515 Dams no 2 86,004 86,004 0 Streetlights Poles no 1,229 1,267,410 714,578 17,293 Lanterns no 1,940 1,258,270 808,556 54,122 Brackets no 1,602 448,834 260,805 8,640 Bridges & Large
Culverts
Bridges & Large
Culverts no 716 150,136,921 75,151,066 1,726,176 Minor Structures Retaining/Seawalls no 637 42,365,046 28,604,124 891,103 Traffic Facilities Railings m 54,192 10,922,338 5,577,210 285,443 Edge Marker Posts no 11,889 359,765 200,321 37,121 Roadmarking 1,811,557 1,806,307 0 Traffic Islands m2 12,355 638,255 433,493 10,520 Signs & Posts Signs no 13,462 2,038,546 921,765 146,284 Posts no 9,713 1,578,377 870,106 100,531 Quarries incl Fences Quarries incl Fences no 6 1,101,427 1,101,427 0 Footpaths Footpaths m2 288,798 29,054,345 14,269,505 647,777 Car parks Car parks no 20 5,276,821 3,933,515 91,862 Ferry Ferry no 1 5,736,696 2,715,205 181,814
TOTAL 1,257,571,259 957,549,034 16,048,848
4
OVERVIEW OF THE ASSETS
The focus of this section is on the physical assets that deliver roading services to customers. It describes the assets, how they work and their condition. A critical look is taken at the key assumptions and confidence in the asset data. This detailed knowledge is needed to gain an understanding of how the roading system functions and how the required levels of service for customers are met in the most cost effective and affordable manner.
4.1
Managing the Assets
4.1.1
How the network works
The road network is a vital part of the district that enables safe and comfortable access for employment, personal/social activities and recreation, and the movement of goods and services. The transport network is essential to the functioning of the district's economy, benefiting residents and the district as a whole. Maintaining and improving roads are
regarded as two of the core functions of Council. The District also benefits from other users of the transport network such as visitors, tourists, emergency service vehicles, postal services, etc.
4.1.2
Contract Management, Scope and Terms of Major Contracts
The Far North District Council has numerous contracts covering different aspects of the road network. The main operative contracts are detailed below as at June 2014:
Physical Works Contracts:
Northern Area Road Maintenance Contract (Fulton Hogan Ltd)
Eastern Area Road Maintenance Contract (Transfield Services Ltd)
Western Area Road Maintenance Contract (Downers Ltd)
Vehicular Ferry Contract (Transfield Services Ltd)
4.1.3
Customer Service Requests and Complaints
Council uses a Pathway Customer Service Request system for its Request for Service (RFS) and Correspondence processes.
Fulton Hogan Ltd is the first point of call for all customers' for Roading and Drainage requests for service (RFS). The call redirects from the Council' system to Fulton Hogan who have experienced staff to answer the call and accurately determine the problem. They then
allocate the RFS either to themselves as the Northern Maintenance Contractor or to Transfield Services Ltd and Downers Ltd. Non related RFS are referred back to Council's Customer Services Officer.
The process for written correspondence is similar. The correspondence is scanned and logged by the mail clerk and emailed directly to the staff member responsible. The primary objective of the correspondence RFS system is to trace correspondence that requires a written
response.
RFS statistics are graphed and are shown in further detail under the Routine Maintenance Plan section of this AMP. The categories for customer requests are shown in the table below.
Table 2: RFS Categories for Transport
Categories Categories
Bridges (RBR) Dead Animals (RDA)
Emergency Roads (REM) Service Lanes (Hard Surfaces) (RLN) Rural Litter (RRL) Street lighting (RSL)
Signs, Markings, Barriers (RSN) Road Repairs (RRE)
Unformed Roads (RUF) Roads & Stormwater Correspondence (RDGC) Vegetation (RVG) Roading/Stormwater Surcharging Manhole Lid (RSM) 4.1.3.1 Versus Research Limited Communitrak Survey
The latest available data is from the 2014 Communitrak Survey. The survey provides Council with robust statistically valid data. The results in Figure 1 show a decrease of approximately 9% in the overall satisfaction rating for roading (42%) and an increase of approximately 8% in the overall satisfaction rating for footpaths (61%) from the previous survey 2013. The survey questions were developed to gain an understanding of levels of satisfaction around a number of core roading related areas.
Figure 1: Overall Roading and Footpath Satisfaction Results
Other consultation with residents and ratepayers has yielded similar results to the residents’ survey, i.e. dissatisfaction with the overall condition of the network and a strong desire to see a methodical approach and consistent progress towards sealing more roads. These views have been reinforced by submissions to Council’s Annual Plans in recent years.
4.1.3.2 Asset Condition and Monitoring
Council gains a better understanding of the remaining life of its assets or components through condition assessments. This understanding drives future expenditure patterns. By conducting regular condition and performance monitoring, maintenance strategies and/or rehabilitation strategies can be updated and refined, and ultimate replacement programmes can be determined more accurately.
It is critical to have clear knowledge of the condition of the assets and how they are performing. All management decisions regarding maintenance, rehabilitation and renewal revolve around these two aspects. Not knowing the current condition or performance level of an asset may lead to premature failure of the asset. Any unforeseen failure of an asset could have consequences that constitute a public liability or potential loss to the organisation. The development and continued use of condition assessment data allows preparation of verifiable predictive decay curves for particular asset types and consequently, the remaining life of the asset can be predicted. Economic influences will still need to be considered for the adopted life for the asset type.
Table 3 below reflects the reliability of asset data for the transportation assets. Table 3: Overall Confidence Data
Asset Type Highly Reliable Reliable Uncertain Very Uncertain
Road Pavements – Sealed
Road Pavements –Unsealed
Bridges and Large Culverts
Minor Structures
Traffic Facilities
Drainage
Street lighting
Quarries
Vehicular Ferry
Footpaths
Car parks
Table 4: Condition and Performance for Critical and Non Critical Assets
Asset Type Highly Reliable Reliable Uncertain Very Uncertain
Road Pavements – Sealed and Unsealed
Bridges and Large Culverts
Minor Structures
Traffic Facilities
Drainage
Street lighting
Quarries
Vehicular Ferry
Footpaths
Car parks
Table 5 below provides the confidence framework (NAMS IIMM) used to determine the confidence in the transportation asset data.
Table 5: Asset Data – Confidence Grades
Confidence Grade General Meaning
Highly Reliable Data based on sound records, procedure, investigations and analysis, documented properly and recognised as the best method of assessment.
Reliable Data based on sound records, procedures, investigations and analysis, documented properly but has minor shortcomings, for example the data are old, some documentation is missing, and reliance is placed on unconfirmed reports or some extrapolation.
Uncertain Data based on sound records, procedures, investigations and analysis which are
incomplete or unsupported, or extrapolated from a limited sample for which grade highly reliable or reliable data are available.
The condition assessment model in Table 6 is the basis for assessing the asset condition of FNDC assets.
Table 6: Typical Condition Rating Model
Grade Condition Description of Condition
1 Excellent Sound physical condition. Asset likely to perform adequately without major work for 25 years or more.
2 Good Acceptable physical condition; minimal short-term failure risk but potential for deterioration in long-term (15 years plus). Minor work required.
3 Average Significant deterioration evident; failure likely within the next 5 years but further deterioration likely and major replacement likely within the next 15 years. Minor components or isolated sections of the asset need replacement or repair now but asset still functions safely at adequate level or service.
4 Poor Failure likely short-term. Likely need to replace most or all of assets within 5 years. No immediate risk to health or safety but works required within 3 years ensuring asset remains safe. Substantial work required in short-term, asset barely serviceable.
5 Very Poor Failed or failure imminent. Immediate need to replace most or all of asset. Health and safety hazards exist which present a possible risk to public safety or asset cannot be serviced/operated without risk to personnel. Major work or replacement required urgently.
4.1.4
Maintenance Decision Making Processes
Operations and maintenance strategies determine how the local transportation network will be operated and maintained on a day-to-day basis in order to achieve the optimum use of the asset.
The lifecycle management work categories identified in Table 7 are defined as follows: Table 7: Maintenance Categories
Routine (General) Maintenance
Routine maintenance is the regular ongoing day-to-day work that is necessary to keep assets operating, including instances where portions of the asset fail and need immediate repair to make the asset operational again. This work falls into two broad categories as follows:
Proactive Proactive inspection and maintenance works planned to prevent asset failure.
Reactive Reactive action to correct asset malfunctions and failures on an as required basis.
A key element of asset management planning is determining the most cost-effective blend of planned and unplanned maintenance as illustrated in Figure 2.
4.1.5
Process for identifying the range of options to deliver levels of service
including demand management
Council provides a level of service matched to the community’s ability and willingness to pay. Information associated with the service is attained from the community in regard to
expectations on quality, delivery and costs. This information is collected via a number of mechanisms, including:
Communitrak Survey
Submissions on the Annual Plan
Analysis of Request for Service database
Community consultation
Consistency is needed between the levels of service provided by the Transportation Activity and the expectations of the communities. The communities' willingness to pay determines the level of service (LoS). High community expectations need to be matched to both a willingness and ability to pay. Both LoS and willingness to pay will differ between communities.
4.1.6
Selection Criteria for Asset Creation or Upgrading Projects
Investment in new or upgraded assets is based on:
Demand
Growth
Maintaining LoS
Regulatory requirements (refer to Section 4.8 for list of key legislation)
Projects to develop new assets are ranked on a business risk basis prior to inclusion in the Council’s Long Term Plan (LTP).
The selection criteria for the prioritising and programming of transport asset development projects are a function of Council preference, consideration of risk, costs and benefits, affordability and ranking with other projects. The following criteria are taken into consideration when prioritising projects:
Ability to Attract a Funding Subsidy
Legislative Compliance
Access to Communities and, Infrastructure: Tourist Destinations
Dust – Social and Health Impact: Dwellings and Public Facilities
Environmental Sustainability
Growth Rate
Seasonal/Holiday Traffic
Land-Use Zoning/Activity
Route Security – Alternative to Strategic Links
Safety
Strategic Link Function
Traffic Type and % Heavies
Traffic Volume
4.1.7
Asset Management Systems
The table below sets out Council’s IT applications used by the Transportation group. Table 8: Asset Management (AM) Systems
Function Systems Used Description Asset Management
System
RAMM RAMM supports hierarchical definition of assets and has defined components.
RAMM assigns a unique ID number to each asset (also used in GIS Bizeassets)
RAMM is used for most assets with the exception of car parks and quarries
Financial System Technology One Finance One is used to make payments to contractors for general maintenance and capital work
Finance One records valuation data at summary level
It is used also for forward programming
Plans and Records Objective / RAMM RAMM is the main source of Data
Hard copy of as-builts are scanned and kept in Councils system
From 2010 records are saved also into Objective which is Council’s Document Management System
Complaints (Request for Service)
Call Centre (Pathway V3.06)
Council uses Pathways RFS (request for service) module which records and tracks complaints and service requests
Capacity Modelling RAMM Traffic volumes and classification
Maintenance Management
RAMM contractor RAMM contractor is a contract management program that is available through RAMM
Works Orders Pathways V3.06 Pathways provides full functionality for generating works orders
Geographical Information System (GIS
Map Info GIS is available, but is not fully used for Transport
Project Management Technology One / Microsoft Project & Excel
Finance One has the ability to capture project timelines and manage projects and financial data, this feature is not widely used for Transport
Microsoft Project and excel spreadsheets are the most common tool used for project management
Condition Survey RAMM RAMM holds condition data for all assets except car parks, wharves, airports and quarries
Capital Renewal Modelling
RAMM RAMM is currently used to do predictive modelling for pavements. Council has started collecting data for dTIMS deterioration modelling
Network Auditing Microsoft Excel Network Auditing is done quarterly and is entered into Excel spreadsheets
Crash Analysis System (CAS)
CAS (via NZTA/Police)
CAS records all police accident records for further evaluation regarding road safety
Microsoft Microsoft 2013 For all other daily tasks Word, Excel, Outlook, Project, Access, PowerPoint
4.1.8
Asset Management Data
The table below sets out Council’s process and current practices used by the Transportation group.
Table 9: Asset Management Data
Process Current Practice
Condition Data These include RAMM Road Condition Surveys, High Speed Data surveys, RAMM Footpath Condition Surveys, Structures General Inspections, and Structures Detailed Inspections
Asset data and information
Pocket RAMM is being used by the contractors to update asset data in the field e.g. signs, drainage
Spatial Data Aerial photos available
Road centre lines on GIS
Project Management
Finance One has the ability to capture project timelines and manage projects and financial data, this feature is not widely used for Transport
Maintenance Data RAMM Contractor is used to capture all known faults with treatment cost estimates, filter and programme selected faults for treatment, and to record actual treatment and costs
Performance / Capacity
Average knowledge of traffic patterns and future demand
Bridge capacity loadings are currently being reviewed which includes structural integrity of high risk bridges (weight restricted bridges)
Asset Age / Lives Asset creation dates are recorded in RAMM and the useful lives are assigned to all assets through the valuation process based on the valuation and depreciation guidelines which are held in the Pathways system
Figure 3 illustrates the extent of the Roading Network within the Far North District and Figure 4 shows the preliminary One Network Road Classification (ONRC) summary of the Roading Network.
Figure 3: Summary of Roading Network
Figure 4: Preliminary ONRC Summary of the Roading Network
4.1.9
New Zealand Transport Agency
The NZTA is a Crown entity established on 1 August 2008, under the amended Land Transport Management Act 2003, bringing together the former functions of Land Transport New Zealand and Transit New Zealand to provide an integrated approach to transport planning, funding and delivery.
The NZTA contributes to an integrated, safe, responsive and sustainable land transport system, in support of the updated New Zealand Transport Strategy. The NZTA is focused on delivering four key outcomes:
Economic Growth and Productivity
Road Safety
Value for Money
4.1.9.1 Procedural Audits
Procedural audits are carried out by NZTA in terms of Section 95 (1) (e) (ii) of the Land Transport Management Act 2003 with a 2008 Amendment. The objectives of the audits are generally as follows:
To review any issues arising from previous procedural audit(s)
To review final claims for the period being audited
To assess the audit trail of transactions for financially assisted works
To assess compliance with NZTA’s approved procurement procedures
To review contract management procedures
To review Council’s professional services provider/network manager/business unit for compliance with NZTA’s requirements
To recommend measures for improved practice if appropriate
The last FNDC Procedural Audit was carried out in June 2011. Audits have typically been carried out on a two-yearly cycle with the next one due in 2013. A copy of the 2013 review is attached in Appendix A.
4.1.9.2 Technical Audits
Technical audits are carried out by NZTA in terms of Section 95 (1) (e) (ii) of the Land Transport Management Act 2003 with a 2008 Amendment. Factors that determine the frequency include the size of NZTA’s financial contribution, the complexity of each organisation’s programme, network condition (pavement and safety) and the outcome of previous audits. The objectives of the audits are generally as follows:
To review any issues arising from previous technical audit(s)
To assess whether the level and quality of roading maintenance being carried out by the Council is realistic and acceptable
To determine the extent to which Council’s structural and corridor maintenance programme is meeting (not exceeding) maintenance needs
To determine the extent to which Councils RAMM database is able to provide reliable reports and treatment selections
To determine in light of the answers to the above, that there is progress towards achieving a least cost, long-term, maintenance programme
The latest Technical Review for the Far North District was carried out in 2008, and a financial audit was completed in 2013. A copy of the 2008 and 2013 reports are attached in Appendix A.
4.2
The Services We Provide
4.2.1
Management of the Activity
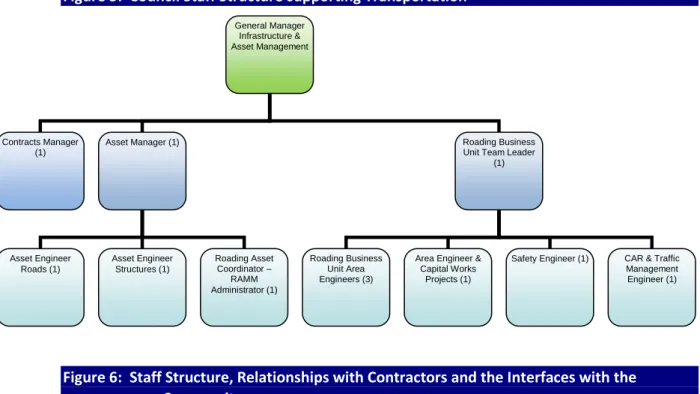
The Council Management Structure for the Transport Group is shown in Figure 5 and Figure 6 below.
Figure 5: Council Staff Structure supporting Transportation
Figure 6: Staff Structure, Relationships with Contractors and the Interfaces with the Community
General Manager Infrastructure & Asset Management
Contracts Manager (1)
Asset Manager (1) Roading Business
Unit Team Leader (1)
Asset Engineer Roads (1)
Roading Business Unit Area Engineers (3)
Area Engineer & Capital Works
Projects (1)
CAR & Traffic Management Engineer (1) Roading Asset
Coordinator – RAMM Administrator (1) Asset Engineer
Structures (1)
Safety Engineer (1)
Engineering and Professional Services Roading and Urban Stormwater
COUNCIL
Network Maintenance Contractor East Transfield Services Ltd
Chief Executive Officer (CEO)
General Manager Infrastructure and Asset Management
Council’s In House Roading Business Unit
Capital Works Contractors Network New & Renewal
Works Contractors Network Maintenance
Contractor North Fulton Hogan Ltd
Call Centre (RFS)
THE COMMUNITY Council
Network Maintenance Contractor West
Downers Ltd
4.1.1.1 Roles and Responsibilities
The transportation assets are managed, monitored and maintained by a number of parties as shown in the Table below.
Table 10: Transportation Network Service Providers
Party Role Specific Responsibilities
GM Infrastructure and Asset Management
Responsibility for overseeing the management of Assets and Services
Contracts Manager (FNDC) Responsibility for the management of Assets and Services
Financial control
Strategic Performance Monitoring
Customer Service
Asset Management Team Responsibility for overseeing the management of Assets and Services
Forward works programmes
Condition surveys
AMP’s
Engineering Professional Services Roading
(FNDC’s in house Roading Business Unit)
Provision of professional services to Infrastructure & Asset Management Department
Roading network operations and management
Management of capital and renewal works
Design
Northern Network Maintenance Contractors (Fulton Hogan Limited)
Completion of the majority of day to day operations, maintenance and renewal works within the road network. The completion of the annual remark and various new marking as required.
As detailed in Contract 7/12/100
Southern Network Maintenance Contractors (Transfield Services Limited)
As detailed in Contract 7/12/101
Western Network Maintenance Contractors (Downers Limited)
As detailed in Contract 7/12/102
Capital Works Contractors
(various contractors)
Responsible for implementation of capital new and renewal projects.
Physical construction of specified road improvements
Vehicular Ferry Operator
(Transfield Services Limited)
Day to day operations and maintenance of the ferry.
As detailed in Contract 7/13/200
Management
Planned major maintenance
Unplanned maintenance
Call Centre (Fulton Hogan Ltd) Call Centre, Customer Contacts Recording of RFS complaints
Customer interactions
Quarries (FNDC) Responsible for the management of the quarry asset.
All quarry sites not operational
Compliance with resource consent conditions
4.1.2
Pavements
Roads are safe to use and provide a comfortable and reliable means of travel 4.1.2.1 Operation of activity
The purpose of pavement assets (formation, base layers and surface) is to provide a pavement network suitable for:
The effective and efficient movement of vehicles
All year round access
A safe suitable all-weather surface that is appropriate to location and function in terms of skid resistance, noise reduction, smoothness, and has a structure suitable for legal traffic loading requirements.
This is accomplished through a renewals programme and a day to day maintenance
programme. The renewals programme addresses the lifecycle of the road surface and road base. Road surfaces that are either approaching, or at the end of their service life, are resurfaced. Roads where the road base is approaching, or at the end of its service life, are reconstructed. Day to day maintenance is managed through the three road maintenance contracts.
4.1.2.2 Physical Parameters
Council has a total of 2,543.4 km of roads within its roading network. Table 11 below shows the distribution between the sealed and unsealed networks.
Table 11: Length of Sealed and Unsealed Roads
Road Type Urban Rural Total
Unsealed Roads 8.3km 1643.7 km 1652.0 m
Sealed Roads 197.4 km 694.0 km 891.4 km
Total 205.7 km 2337.7 km 2543.4m
The roading network is classified using the hierarchical asset categories shown in Table 12, which are aligned to the RAMM system and Table 12, the preliminary ONRC classification. Table 12: Roading Network Distribution
Hierarchy Description Sealed
(km)
Unsealed (km)
Total Network (km)
Arterial Roads of regional importance 158.1 - 158.1
Collector Roads of local significance 322.5 202.5 525.0
Local All other roads maintained by Council 408.8 1,449.4 1,858.2
Service Lane Road that provides the public with a side or rear access for vehicular traffic to any land
1.9 .2 2.1
Table 13: Preliminary ONRC for Roading Network Distribution
Hierarchy Description Sealed
(km)
Unsealed (km)
Total Network
(km)
Arterial These roads make a significant contribution to social and economic wellbeing, link regionally significant places, industries, ports or airports and may be the only route available to some places within the region
72.0 - 72.0
Access These are all other roads. Low volume roads within
this category will fall into the low volume subset. 298.2 1382.2 1680.4 Primary
Collector
These are locally important roads that provide a primary distributor/collector function, linking significant local economic areas or areas of population.
71.7 1.2 72.9
Secondary Collector
These are roads that provide a secondary
distributor /collector function, linking local areas of population and economic sites and may be the only route available to some places within this local area.
449.4 268.8 718.2
Total 891.3 1652.2 2543.5
The information set out in Table 14 provides an overview of the pavement assets as recorded in Councils asset register.
Table 14: Asset Information – Road Carriageway
Asset Length (m3) ORC ODRC AD
Formation 13,012,631 424,211,756 424,211,756 0 Subbase 3,119,124 214,452,883 141,768,299 466,452 Basecourse 2,003,032 157,595,594 128,443,550 3,438,108 Surface 14,553,823 85,837,940 44,217,992 6,566,546
TOTAL 32,688,610 882,098,173 738,641,598 10,471,105
Key Issues and Strategies
Key issues and actions relating to the management of pavements are set out below. Table 15: Pavement Key Issues & Strategies
Key Issue Strategies to Address Key Issues
Demand for roads to be sealed due to dust nuisance
Monitor dust nuisance for breaches of National Environmental Standards Trial alternative methods of dust suppression
Implement 100m seal programme on worst affected logging routes Weak subgrades, poor geology – traffic
loadings, drainage
Continue to monitor key pavement Key Performance Indicators (KPIs) – condition / FWD.
Continue with well-focused and adequately funded renewals programmes – dTIMS.
Maintain a high standard of surface water channels – programme (Network).
Narrow carriageway with poor alignment and inadequate sight distance (safety)
Monitor crash reports for trends and black spots
Proactively complete sight benching and vegetation removal and corner improvements via Minor Improvements
Proactively continue with culvert extensions
Carry out regular crash reduction studies, RISA, Safety Management System.
Unsealed pavement rapid deterioration during bad weather conditions
Continue to maintain and develop metal structural layers, shape to allow surface water runoff, continue to improve drainage.
Maintain required Levels of Service appropriate to Road Hierarchy
Further analyse deterioration rates and monitor pavement condition KPIs to more confidently define extent of issue.
Closely monitor maintenance needs and the timing of reseals on
pavements which have low traffic volumes and have passed their forecast seal life, but are not yet showing signs of surface cracking or distress, then extend reseal cycle times.
Impacts of forestry traffic on road pavements
Continue to work with forestry groups on how to best manage on road by road basis.
Increasing demands on the road network from the forestry industry and other heavy vehicles.
Increased maintenance and renewal costs.
Limited source of good quality road aggregate
Increased maintenance and renewal costs relative to other councils. Limited sources of quality aggregate Proactively assess the supply and demand of aggregate and implement
recommendations, where appropriate.
Quality of RAMM pavement data Continual improvements of the RAMM data to improve quality and outputs.
Reduced central government funding for local infrastructure. New Zealand Transport Agency (NZTA) funding criteria based on One Network Road
Classification, traffic volumes and congestion, disadvantages a rural district. Loss of Regional Development Fund activity class.
Increased local share of costs of reduced levels of service, leading to ratepayer dissatisfaction. Reduced ability to carry out improvements and new projects, including seal extensions.
Poor geology prone to landslides. Increased maintenance and construction costs relative to other councils. Climate Change – increased emergency
repairs and renewals due to increased severity and occurrence of storm events.
Increased exposure to road closures and widespread damage to the road network. Unbudgeted expenditure, resulting in other programmed renewals having to be deferred and a potential drop in levels of service. Assumptions & Confidence Levels
External influences are likely to have the most impact on projections i.e. inflation, timber prices, oil prices and construction cost escalations;
The current LoS are being reviewed in accordance with ONRC requirements and a transition plan is being prepared;
Confidence levels are high with regard to the techniques for assessing the operational pavement maintenance activity.
4.1.2.3 Asset Capacity/Performance
Carriageway pavements comprise three major asset components as follows:
Formation (subgrade): The formation layer is essentially the natural ground material that the carriageway structure is formed upon. Formation is considered to have an indefinite life and is therefore not depreciated over time.
Subbase: The subbase is the compacted material (AP65) that sits above the subgrade. The thickness of this layer is determined by the strength of the subgrade.
Basecourse: The basecourse is the compacted granular material (AP40) that sits above the subbase. Basecourse has a much longer life, and therefore the renewal profile varies differently to that of the surface materials.
Modified Basecourse: This may include lime or cement dependant on the quality of aggregates.
Table 16: Top Surface Layers
Layer Type Description
Chipseal Layer of sprayed bitumen with a stone chip spread on top as a running surface. The life cycle for a chipseal surfacing varies dependent on the chip size used (small chip means less bitumen that can be sprayed as the waterproofing membrane) and by traffic volume.
Asphaltic Concrete Mix of graded aggregate and asphaltic binder laid in a 25 - 50 mm layer. Primarily used at roundabouts, busy intersections, central business areas, high traffic stress areas (i.e. cul-de-sac heads), and where road noise is an issue.
Unsealed Metal surface, or have a clay bound wearing course surface.
These layers typically have short lives and are renewed through resealing or remetalling. 4.1.2.4 Asset Condition
Pavement Condition
A considerable amount of pavement condition data is collected through bi-annual roughness and rating assessments, and through the network maintenance contracts.
Sealed Surfacing Condition
Skid resistance measurement is a primary resurfacing driver on the State Highway network. Council does not currently measure skid resistance. Council will consider surveying skid resistance on arterial roads when NZTA has the required machine in the area.
Surface Condition Index (SCI)
The SCI is a composite index that describes the network surface condition and allows easy comparison of historical and future surface conditions. Results shown graphically are very quick to interpret. SCI has two key components:
The Condition Index (CI) which is based on RAMM condition rating data, and
The Age Factor Index (AI) of the surface, which uses the surfacing remaining life held in RAMM.
The SCI is used to trigger resurfacing or reseal treatments. Figure 7 shows the SCI levels of the network from 2008/09 through to 2013/14. This may be attributed to continued poor
weather and heavy rain that the Far North experienced over previous years. The next round of condition rating is being carried out in the next 2 years.
Surface Age
Figure 8 below shows the Surface Age using the information from the RAMM database. Figure 8: Surface Age
Pavement Failure Modes
Surveys looking at scabbing, rutting and shoving on the Far North’s roads have generally, over the last ten years, shown a downward trend, indicating improvement to the overall condition of pavement throughout the network. However, over the previous year, these values have started to increase, giving early indication that the condition of the network may be starting to deteriorate. This could be due to the wet winters experienced by the Far North, taking into account the volume of rain experienced. Future results will require monitoring and, if the upward trend continues, remedial action will be initiated, i.e. increased levels of renewals to improve the condition of the network.
Pavement Integrity Index
The Pavement Integrity Index (PII) is a combined index of the pavement faults in sealed road surfaces. It is a ‘weighted sum’ of the pavement defects divided by the total lane length. PII combines surface faults with rutting and shoving. Using a scale of 0 to 100 – the higher the number the greater the pavement integrity.
Figure 9 below shows a downward movement from 2007/08 which may be a result of the continued poor weather and heavy rain that the Far North has experienced in previous years. A deteriorating trend does not always indicate that corrective action should be taken.
However, future values should be monitored closely to ensure that this is not an ongoing trend.
RAMM has a key output, which identifies treatment selections. This function is used to identify road sections that require treatment either now or within the next year. Key triggers (i.e. roughness) are used in the process and the quality of outputs is often directly related to the completeness and accuracy of the RAMM database.
Sealed Pavement Layer Condition
The condition of the road pavement is represented by the following measures:
Roughness – average National Association of Australian State Road Authorities (NAASRA) % above threshold levels and smooth travel exposure (STE).
Rutting - % of network measured in each wheel path, greater than 20 mm rut depth. Roughness
Roughness is a measure of aspects of the longitudinal profile of a pavement. The NAASRA count is the commonly used unit for the measurement of roughness. Smooth Travel Exposure (STE) is also used to determine the overall roughness of the road network.
Table 17 below provides the NAASRA Roughness Condition Grading, the values from the NZTA maintenance guidelines for local roads have been used as a reference, however due to the low volume nature of FNDC roads, some interpretation of the guidelines has been used.
Table 17: NAASRA Measurements
Hierarchy Target NAASRA Excellent Good Moderate Poor V Poor
Arterial 90 ≤ 75 75-100 100-120 120-150 >150 Collector 105 ≤ 90 90-100 100-130 130-150 >180 Local 120 ≤ 100 100-120 120-150 150-180 >180
Figure 10 illustrates the trend analysis for roughness using NAASRA averages since
measurements began. The declining trend shows that the renewal programmes in place are displaying positive results, despite increasing traffic demand. Note the increased roughness from 2012 to 2014, this need to be monitored against the next survey.
Figure 11: Trend of Network Roughness Based on Hierarchy
The trends illustrated in Figure 11 above show that the overall network roughness is
consistent in comparison to the NAASRA threshold values shown in Table 18. The important message from the above graphs is that arterial and collector roads remain steady, yet the local road network over the last 2 years has become rougher.
Table 18: Average Roughness Trend
Hierarchy Average Threshold
NAASRA 2004 2005 2006 2008 2010 2012 2014
Arterial 90 83 83 82 79 78 77 74 Collector 105 79 79 80 79 80 76 78 Local 120 92 96 95 100 95 95 97
Average 105 85 86 86 86 84 83 83
Smooth Travel Exposure (STE)
STE is defined as the proportion of vehicles travelling on roads each year with condition above the targeted conditions for those roads. An increase in STE means that fewer vehicles are travelling on roads above the target roughness. For the purpose of the NZTA reviews, the target roughness is generally taken as 150 NAASRA. A roughness greater than 150 NAASRA usually indicates poor road condition.
Unsealed Surface and Pavement Condition
The condition of the unsealed road network is formally audited quarterly by the maintenance contractors and Network Management Consultant. For unsealed pavements, the audit focuses on the following:
Potholes
Corrugations and rutting
4.1.3
Waitangi Trust Road
4.1.3.1 Operation of activityThe Waitangi Trust Road (Tau Henare Drive) is classified by NZTA as a Special Purpose Road. The road is maintained by Council but is 100% funded by NZTA. The road was accepted as a special purpose road in terms of Section 104 of the Transit NZ Act 1989 (now the Government Roading Powers Act).
4.1.4
Bridges and Large Culverts
Bridges and large culverts are designed and maintained to provide safe access across the network
4.1.4.1 Operation of activity
Bridges and large culverts (>3.4m² which corresponds to NZTA asset categories) are an integral part of the transport network. Council has 716 bridges/large culverts held in the asset
inventory. Council regularly carries out routine and planned maintenance (e.g. repairing bridges). Bridges have been identified as one of Council’s risk asset areas, based on cost, importance to the network and consequences of failure. All bridges that are sign posted for weight restrictions and overweight vehicle movements are monitored to ensure bridges are not damaged.
4.1.4.2 Physical Parameters
Bridges (concrete, timber and steel structures) have an overall value of $150,136,921. The annual depreciation for this asset group is $1,726,176. This is the second largest asset group in the transport network. The information set out in the tables below, provides an overview of the bridge assets recorded in Council's asset register as at 30th June 2014.
Table 19: Asset Information Bridges and Large Culverts
Asset Quantity ORC ODRC AD
Large Culverts 167 17,500,131 9,776,400 222,095 Timber Decks 2,227,459 724,599 40,871 Bridges 549 130,409,331 64,650,067 1,463,210
TOTAL 716 150,136,921 75,151,066 1,726,176
Key Issues and Strategies
Key issues and actions relating to the management of bridges are set out below. Table 20: Bridges Key Issues and Strategies
Key Issue Strategies to Address Key Issues
Review and clarification of Council's policy and responsibilities; particularly in regard to bridges that are not on the roading network (ownership).
Develop a new bridge policy and obtain clear legal opinions to some of the generic problems. Lack of load carrying capacity information on bridges. Bridge Management Strategy and load capacity
information.
Funding for replacements. Identification, assessment and prioritisation of works. Inspections of all bridges have identified some
structures which require more detailed investigation.
Level of uncertainty as to how much maintenance and renewals could cost.
Assumptions & Confidence Levels
There are a number of areas that require further investigations and improvements. The majority of these areas relate to improving the current level of knowledge of bridge assets, allowing council to:
Clearly understand its responsibilities
Prepare long-term forward planning programmes; based on accurate information and analysis
Accurately assess overweight load requests
The Bridge Management Strategy was updated in 2011 and highlights some key areas of focus for the future specifically around maintenance and renewals.
Figure 12: Histogram of Bridge Construction Dates
Figure 12 above shows the development of the bridge and large culvert stock. The large numbers represented by the spikes through the 10 year period from 1960 to 1970 indicate a peak that will require careful planning and management with regards to future renewals and replacement, as required.
The graphs below show a further breakdown of large culvert and bridge structure assets by age and remaining useful life.
4.1.4.3 Asset Capacity/Performance
Council has 38 weight-restricted bridges. Strengthening and/or replacement are a priority to address this issue, where appropriate. Structural assessments of the existing
weight-restricted bridges occurs annually to determine deterioration and the load carrying capacities relative to the maximum permitted loads which are specified in the Transit New Zealand Bridge Manual as 100% Class 1.
A 100% Class 1 heavy vehicle represents the maximum legal load for heavy vehicles of various axle configurations. The structural assessment and weight restriction of an existing bridge includes safety factors to ensure undue over-stressing of the structure. A vehicle exceeding the weight restriction on a bridge may over-stress the bridge but not necessarily cause failure. Repetitive over-stressing of the bridge structure will ultimately lead to failure.
A Bridge Management Strategy has been completed, which prioritises upgrades and/or renewals for programming purposes.
4.1.4.4 Asset Condition
There are financial implications to upgrade these bridges. In most situations, it will mean the renewal or upgrading of the structure.
Figure 14: Bridge Condition Bridge condition is inspected every 2 years. The majority of bridges fit into the good and average conditions (grades 2 and 3). There are 13 structures at condition grade 4 and 4 structures
at condition grade 5.
Figure 15 shows a further breakdown of the condition by material type for large culverts and bridge structures.
4.1.5
Footpaths
The footpaths network is considered to be safe, accessible, and well maintained 4.1.5.1 Operation of activity
Council manages the lifecycle of existing footpaths through an annual renewals programme, based on a 10-year programme developed for this AMP. The ongoing maintenance
programme addresses footpath defects caused by inclement weather, wilful damage, or arising from health and safety issues and public complaints.
4.1.5.2 Physical Parameters
Council has a total of 183.4 km (288,798 m²) of footpath within its network. Footpaths also include off-road paths for shared use with cyclists. Table 21 provides an overview of the footpath assets as recorded in Council's asset register. The table below provides an overview of the footpath assets recorded in Council's asset register as at 30th June 2014.
Table 21: Asset Information – Footpaths
Footpath Types Area (m²) ORC ODRC AD
Footpaths 288,798 29,054,345 14,269,505 647,777
TOTAL 288,798 29,054,345 14,269,505 647,777
Key Issues and Strategies
Key issues and actions relating to the management of footpaths are set out below. Table 22: Key Issues
Key Issue Strategies to Address Key Issues
Unsafe footpaths need to be identified and priortised for renewal, including condition assessment
Identify and programme planned maintenance or renewals
New footpaths need to be identified, with first priority being footpaths within 2 km of primary schools and 3.8 km of high schools, where applicable
New footpaths will be provided in accordance with a policy that gives priority to children walking safely to school
An assessment is needed for the footpath
requirements of an aging population, to determine how well their needs are currently met, and identification of any required actions including provision for increased use of mobility scooters on footpaths particularly in townships
New footpaths will be provided in accordance with a policy that prioritises the aged and special needs
Facilities for vision-impaired pedestrians and all other disabled footpath users
Implement Road and Transport Series 14 –
Guidelines for facilities for blind and vision impaired pedestrians
Footpath funding and management will need to be prioritised on a district-wide basis
Implement a strategy that prioritises funding and management
Injuries on footpaths as a result of trip hazards,etc. Ensure Council contractors are available to repair or make safe the footpath within 24 hours
Accessibility issues for disabled person/parents using mobility scooters/wheelchairs/walkers/strollers/prams on footpaths, and at road parking areas and pedestrian crossings.
Reduced levels of service for vulnerable users, leading to ratepayer dissatisfaction.
Inability to meet Central Government or NZTA funding subsidy criteria for maintenance of existing facilities and for construction of new facilities
Increased local share of costs or reduced levels of service, leading to ratepayer dissatisfaction. Reduced ability to carry out improvements and new projects
State highways pass through the centres of several town and villages.
Severance of communities as NZTA’s need to move people, goods and services along the corridor takes precedence over local access across it.
Assumptions & Confidence Levels
As indicated in the key issues section above, there are a number of areas that require further investigations and improvements. These will allow council to:
Clearly understand its responsibilities;
Prepare long-term forward programmes based on accurate information and analysis;
Prioritise improvements, maintenance and upgrades. 4.1.5.3 Asset Capacity/Performance
Council monitors the need for footpaths and, where affordable, build new ones. In prioritising where to build new footpaths, Council takes into account:
The location (e.g. areas close to hospitals and schools have higher priority)
The traffic density in the area
Whether the berm is suitable for pedestrians without a formed footpath.
The community, especially children and the aged, need safe routes to use, as they move to and from places in their community.
4.1.5.4 Asset Condition
Council has historically carried out condition and capacity assessments of the footpath network to determine the current status of footpath assets. The assessment of the network condition and performance is in accordance with the condition grade rating system, which ranges from Very Poor (5) to Excellent (1). Figure 16 below indicates that the majority of this asset is classed as average condition.
The information provides an overall picture of the footpath network which links into the Long Term Plan for renewals.
Figure 17: Footpath Length by Material
4.1.6
Cycle Trail
The cycle trail network is considered to be safe, accessible, and well maintained 4.1.6.1 Operation of activity
Council manages the construction of existing cycle trail through funding received from Central Government. A renewals programme, based on a 5-year programme developed for this AMP. The ongoing maintenance programme addresses cycle trail defects caused by inclement weather, wilful damage, or arising from health and safety issues and public complaints. 4.1.6.2 Physical Parameters
Council has a total of 51 km of cycle trail within its network. Cycle trails include off-road cycle trails for shared use with pedestrians and cyclists. Table 23 provides an overview of the cycle trail assets, as recorded in Council's asset register. The table below provides an overview of the cycle trail assets recorded in Council's asset register as at 30th June 2014.
Table 23: Asset Information – Cycle Trail
Asset Category Unit Quantities ORC ODRC AD
Cycle Trail Formation m2 109812 1,330,804.70 1,330,804.70 - Cycle Trail Surface m2 132390 342,414.71 319,335.91 27,310.21 Culverts and Drains m 706 182,087.04 179,441.59 3,924.69 Fences m 52515 1,066,829.73 1,007,013.39 71,121.97 Gates / Cattlestops etc. no 214 78,009.20 73,220.83 4,013.35 Bridges no 7 229,229.05 225,957.64 4,584.58 Furniture no 8 12,868.46 11,741.66 1,286.85 Signage no 76 44,446.91 40,046.07 4,444.68 Monuments / Memorials no 3 24,965.13 24,547.83 249.66 Retaining Walls no 6 205,566.06 203,133.03 4,111.32 Lighting no 1 15,179.49 12,642.66 1,517.95
Key Issues and Strategies
Key issues and actions relating to the management of cycle trails are set out below. Table 24: Key Issues
Key Issue Strategies to Address Key Issues
Structures on the cycle trail need to be identified and prioritised for renewal, including condition assessment
Identify and programme planned maintenance or renewals
Cycle trail funding and management will need to be prioritised on a district-wide basis
Implement a strategy that prioritises funding and management
Injuries on the cycle trail as a result of trail surface faults
Ensure Council contractors are available to repair or make safe the cycle trail within 24 hours
Assumptions & Confidence Levels
As indicated in the key issues section above, there are a number of areas that require further investigations and improvements. These will allow council to:
Clearly understand its responsibilities;
Prepare long-term forward programmes based on accurate information and analysis;
Prioritise improvements, maintenance and upgrades. 4.1.6.3 Asset Capacity/Performance
Council will monitor the need for extensions to the cycle trail and, where affordable, build new extensions. In prioritising where to build extensions cycle trails, Council takes into account:
The location
The traffic density in the area
The demand for cycling in the area
The potential benefits to the wider community
Whether the area is suitable or wide enough for cycle trail construction. 4.1.6.4 Asset Condition
Council will carry out condition and capacity assessments of the cycle trail network to determine the current status of cycle trail assets. The assessment of the network condition and performance is in accordance with the condition grade rating system, which ranges from Very Poor (5) to Excellent (1).
4.1.7
Car Parks
Car parks are strategically located to meet the needs of visitors and the travelling public Council provides and maintains 20 off-street car parks in main urban centres. Far North Holdings Ltd (FNHL) owns and operates car parks in Redan Road (Kaitaia), Williams Road (Paihia) and in the Opua marina development. FNHL charges fees for the Williams Road car park and Opua Marina; all other car parks are free. Table 25 below shows where the car parks are located around the district.
Table 25: Far North District Council owned car parks
Commercial Street Kawakawa Hobson Road, Kerikeri Homestead Road, Kerikeri Hundertwasser Toilet Car park,
Kawakawa Johnson Park Lay-By, Kawakawa
Kent Bay (North and South), Whangaroa
Memorial Avenue Car park, Kaikohe North Road, Kaitaia Opononi Leasehold, Opononi Ratcliffes Bay Boat Ramp, Whangaroa Taronui Bay Car Park, Whangaroa Te Corner, Ohaeawai Julian Carpark, Kerikeri Whangae Road, Whangae York Street, Russell Butler Road Car park, Kerikeri Church Street, Russell
4.1.7.1 Physical Parameters
The information set out in Table 26 provides an overview of the car park assets, as recorded in Councils asset register as at 30th June 2014.
Table 26: Car park Network Distribution
Asset Type No ORC ODRC AD
Car parks 20 5,276,821 3,933,515 91,862
TOTAL 20 5,276,821 3,933,515 91,862
Key Issues and Strategies
Key issues and actions relating to the management of car parks are set out below. Table 27: Car Parks Key Issues & Strategies
Key Issue Strategies to Address Key Issues
Sufficient number of car parks are available Monitor demand and supply during peak periods (i.e. weekends and Summer)
Car parks are adequately designed to avoid delay and or potential for accidents or damage
Ensure that car parks are designed to Council’s Engineering Standards and Guidelines Ensuring sufficient number of car parks are available
with adequate signs and markings.
Requires monitoring of demand and supply during peak periods (i.e. weekends and summer peak period) and compliance with Council’s Engineering Standards and Guidelines. Council is also reviewing the need for parking enforcement throughout the year across the district
Ensuring an adequate number of disabled car parks are available that are adequately signed and marked, and facilities for blind and vision impaired pedestrians.
Requires compliance with the provisions in the District Plan, Road and Transport Series 14 – Guidelines for facilities for blind and vision-impaired. Continued liaison with stakeholders from the disability forums Assumptions & Confidence Levels
As indicated in the key issues section above, there are a number of areas that require further investigations and improvements. These will allow council to:
Clearly understand its responsibilities;
Prepare long-term forward programmes based on accurate information and analysis;
Prioritise improvements, maintenance and upgrades;
Determine demand and supply in urban areas. 4.1.7.2 Asset Capacity/Performance
The Asset Manager is working collaboratively with the District Plan Team to update the Car Parking Strategy as part of a proposed Plan Change entitled ‘Traffic Parking Access’. This will be carried out over the next 3 years, depending on resources to complete this.
4.1.7.3 Asset Condition