0
Performance Monitoring Report:
Associate Degree Programs,
Technical Diplomas, and
Certificates
October 21, 2014
Performance Monitoring Report:
Associate Degree Programs, Technical
Diplomas, and Certificates
October 20, 2015
Associate Degree Programs, Technical Diplomas, Certificates Purpose
To deliver associate degree, technical diploma, and certificate level
programs which provide the skills and knowledge necessary to address
occupational competencies from initial job-entry to advanced
certification.
1
Overview
Through credit programming, FVTC serves its District by providing employers with an educated workforce that works to address the health, safety, and business needs of local residents.
Total credit headcount (16,107) decreased in 2014-15 by 6.2% from 2013-14 particularly noted in associate degree enrollment. Seventy-eight percent (78%) of FVTC graduates from 2013-14 who reported being employed six months after graduation were working in a job related to their field of study. FVTC outcome-based funding rankings related to this purpose are included in this report.
Performance Scorecard
PURPOSE SCORE
What we do (Products and Services) For whom (Constituents)
At what cost (Financial)
Vision 2020 - Questions for Board Discussion
In reviewing the past year’s performance, there are clear strengths and opportunities in meeting our purpose. While this performance monitoring report provides a view of our past, we also invite the Board to consider for discussion how to best meet the District’s future needs for credit programming. As you read this report, please consider:
What are our greatest strengths and how have we benefited our community with credit programming?
What threatens our ability to continue to fulfill this purpose?
What will our District require for credit programming in 2020?
Are we well organized to meet the vision for 2020 for this area? What changes should be considered?
What steps must we take to meet the needs of the district by 2020?
We look forward to discussing these questions with the Board during the monitoring review.
FVTC Scorecard Legend
Symbol Description Symbol Description
Full Green Arrow: Results are meeting or exceeding expectations. No action is required.
Partially Red Arrow: Results are below the expected levels. Efforts are under way to take corrective actions and revise the plan
Partially Green Arrow: Results are progressing, but not at the expected levels. Monitoring of the plan will increase.
Full Red Arrow: Results are well below the expected levels and actions need to be taken immediately. Yellow Arrow: Results are indicating caution with the existing
efforts and there is a need to review the existing plan.
Report: Associate Degree
Programs, Technical Diplomas,
and Certificates
2
What We Do
Fox Valley Technical College programming is developed and conducted within Wisconsin Technical College System (WTCS) guidelines and in collaboration with district business and industry needs to effectively meet skill and employment demands. In servicing the needs of the five-county district, the College’s primary educational program offerings include Associate in Applied Science degree programs, Technical Diploma programs, and Certificates defined as:
Associate in Applied Science (AAS) degree programs – An AAS degree assists individuals in preparing for, or advancing in, a particular occupation or field. AAS degree completion typically requires 60-70 credits in the program and consists of technical studies, general studies, and electives. Students pursuing a degree full time will take approximately two years to complete. Time to completion varies widely for part-time students.
Technical Diploma (TD) programs – Technical diplomas are based on local needs of business and industry and are designed to help individuals prepare for a targeted occupation – typically at the entry level. Technical diploma credit requirements vary widely, involving anywhere from 3 to 70 credits; therefore, time to completion varies widely depending on the program.
Certificates – A certificate involves a focused set of courses for skills needed in the workplace. Completed certificates can serve as enhancements to an individual’s resume, as targeted training beyond the attainment of a degree or diploma, i.e., AAS, BS, MS. Credit courses from certificates may also be applied to a related technical diploma or associate degree program, encouraging people to continue their education in these programs. Some certificates may serve as entry points to attract people into programs (i.e., exploring careers series.)
Types of Associate Degrees, Technical Diplomas, and Certificates
FVTC currently offers 63 associate degree programs, 49 technical diploma programs, and 186 certificates. Among the new degree offerings are technical diplomas that are “embedded” into an associate degree that can provide a credential for completion of a smaller segment of the associate degree. Examples of this
credentialing model are the Web Design and Aeronautics – Professional Pilot technical diplomas.
For Whom
Associate Degree and Technical Diploma Enrollment
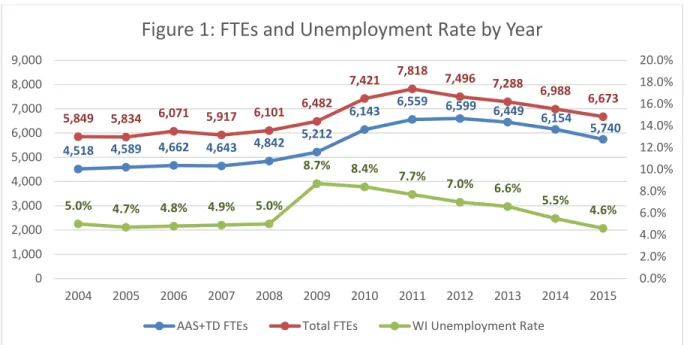
Full Time Equivalents (FTEs) are a common measure of student enrollment for FVTC. In relation to the waning effects of the Great Recession, associate degree and technical diploma enrollments are declining. Calculating a full time equivalent (FTE) from enrollments is defined as 30 credits per student in an academic year. Figure 1 displays FTE data for an eleven-year period correlating the increasing and decreasing FTE trends paralleling the unemployment rate trends. The decline from historically high enrollment levels are stabilizing with the
strengthening of the economy. Associate Degree and Technical Diploma enrollments currently account for 86% of total annual FTEs. The total FTEs include non-program course takers, basic skills and other enrollments.
3
Source: FVTC Report CL1570B – WTCS Portal *Unaudited / Not final.
Program Enrollments Aligned With High Demand Fields
Students are attracted to FVTC for a number of reasons including cost, academic reputation, location,
personalized attention, and program offerings that match their career interests. Faculty and staff continue to work to meet these student needs and to bring not only exciting opportunities but facilities and resources to match.
Program enrollments are an important college measure, as well as an important factor in the pathway to a credential for the outcomes-based funding model for degrees awarded in high demand fields. There is greater emphasis on affecting the skills gap to meet employer needs and for individuals to have the skills necessary for workplace demands. Specific occupations have been identified by the Wisconsin Department of Workforce Development (DWD) as being high demand fields based upon occupational projections through 2020. Table A outlines the College’s top enrolled programs in both associate degree and technical diploma programs, and their alignment with the DWD high demand fields. Twenty-one programs had higher enrollments in 2013-14 as compared to six programs in 2014-15 (Table A - Higher numbers are in bold).
In recent years, higher certificate enrollments reflect the beginning credential in a program career pathways or for grouping general education courses. The top five certificate enrollments for 2014-15 were:
Enrollments Certificates
163 General Studies Transfer (UW-Oshkosh)
138* Automation: Industrial Equipment Machine Operator/Maintenance Helper 90* Advanced Manual Machining
94* Basic Machine Tool 71 General Education
* Part of a US Department of Labor grant special initiative to create shorter credentials and pathways. 4,518 4,589 4,662 4,643 4,842 5,212
6,143 6,559 6,599 6,449 6,154 5,740
5,849 5,834 6,071 5,917 6,101 6,482
7,421 7,818 7,496 7,288 6,988
6,673
5.0% 4.7% 4.8% 4.9% 5.0%
8.7% 8.4% 7.7%
7.0% 6.6% 5.5%
4.6%
0.0% 2.0% 4.0% 6.0% 8.0% 10.0% 12.0% 14.0% 16.0% 18.0% 20.0%
0 1,000 2,000 3,000 4,000 5,000 6,000 7,000 8,000 9,000
2004 2005 2006 2007 2008 2009 2010 2011 2012 2013 2014 2015
Figure 1: FTEs and Unemployment Rate by Year
4
Table A. Top Associate Degree/Technical Diploma Program Declared Enrollments NUMBER OF STUDENTS ENROLLED
ACADEMIC PROGRAMS 2013-14 2014-15
Business
101011 - Accounting* 291 275
101023 - Business Management* 1,086 985
101043 - Marketing* 239 215
101161 - Human Resources* 183 200
Health
105081 - Dental Hygienist 213 235
105141 - Occupational Therapy Assistant 276 281
105431 - Nursing - Associate Degree* 854 805
105501 - Alcohol & Other Drug Abuse 161 158
305431 - Nursing Assistant* 796 737
315091 - Medical Assistant* 186 184
315302 - Medical Coding Specialist 149 152
311602 - Medical Office Assistant* 244 168
315431 - Nursing, Practical* 215 205
Information Technology
101502 - IT - Network Specialist* 172 154
101505 - IT-Network Systems Administration* 170 171
101521 - IT - Software Developer 221 243
101522 - IT - Web Development & Design Specialist 203 168
101543 - IT - Computer Support Specialist* 169 154
Agriculture & Manufacturing
100571 - Natural Resources Technician 193 181
106201 - Electro-Mechanical Technology 206 196
314571 - Welding/Metal Fabrication* 185 169
324201 - Machine Tool Technician* 183 169
Public Safety
105032 - Fire Protection Technician 246 201
105041 - Criminal Justice - Law Enforcement* 583 486
Service
103071 - Early Childhood Education* 300 265
103161 - Culinary Arts* 367 290
Transportation & Construction
304581 - Truck Driving* 264 224
*High Demand Fields Source: FVTC Data Warehouse
WTCS Benchmarking of High-Demand Degrees
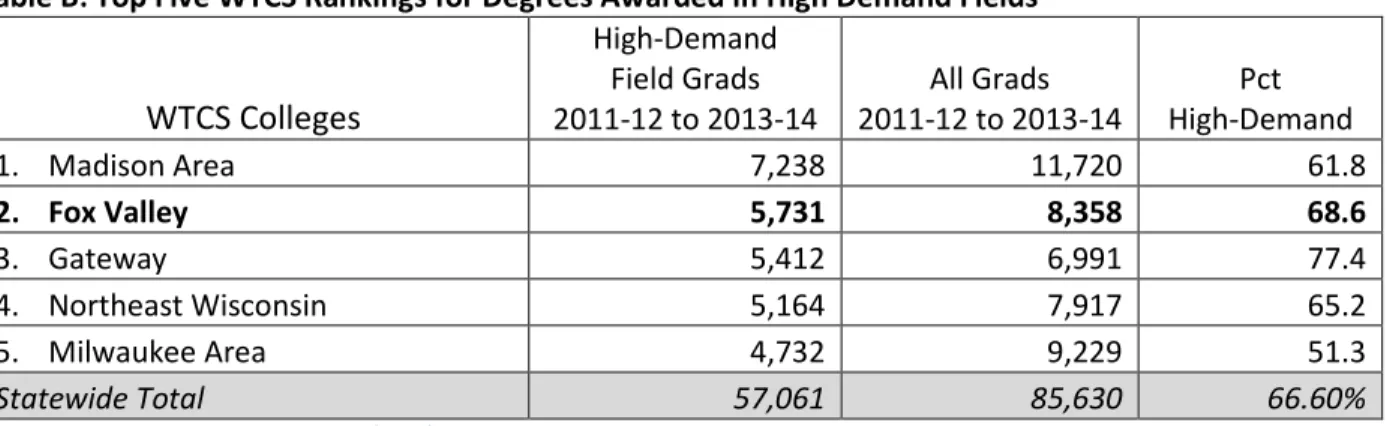
Looking at the top five comparable WTCS colleges, Table B shows FVTC as ranking second in the WTCS for degrees awarded in high demand fields within the three year timeframe. Madison College ranks first among all sixteen WTCS colleges. FVTC thrives on the challenge to meet each student at the intersection of their
5
Table B: Top Five WTCS Rankings for Degrees Awarded in High Demand Fields
WTCS Colleges
High-Demand Field Grads 2011-12 to 2013-14
All Grads 2011-12 to 2013-14
Pct High-Demand
1. Madison Area 7,238 11,720 61.8
2. Fox Valley 5,731 8,358 68.6
3. Gateway 5,412 6,991 77.4
4. Northeast Wisconsin 5,164 7,917 65.2
5. Milwaukee Area 4,732 9,229 51.3
Statewide Total 57,061 85,630 66.60%
Source = WTCS 2014-15 Outcomes-Based Funding Report
Average Age
The average age of students in occupational programs and certificates is stabilizing but showing a slight decline.
Associate degree and technical diploma students = 27 years
Certificate students = 30 years
Student Status
Six of every 10 students at FVTC are part-time students taking less than 12 credit hours per semester which is on par with community colleges nationally1. In the Fall of 2014, there were
4,592 degree-declared part-time students; a decrease of 143 over the same timeframe in the prior year (Figure 2). Full-time degree seeking enrollments (Fall 2014) decreased by 249 to 2,757 students compared to the previous year. A total of 7,349 full and part-time degree-declared students were enrolled in Fall 2014.
Source: FVTC Data Warehouse
Advisory Committee Effectiveness
Occupational program advisory committees are a requirement of the WTCS and are organized to provide advice and counsel to instructional leaders and faculty regarding specific associate degree and technical diploma programs offered by the College. The primary purpose of a program advisory committee is to help the
5185 5092
4735 4592
3158 3116 3006
2757
0 1000 2000 3000 4000 5000 6000
Fall 2011 Fall 2012 Fall 2013 Fall 2014
Figure 2: Student Status - Part Time and Full Time
Part-time Full-time
6 College ensure that the program is relevant to the community, addresses current industry standards, meets workforce needs, and has appropriate resources to support high quality student outcomes.
To accomplish this purpose, program advisory committees focus on the specific functions of program outcome review, curriculum updates, industry trends, and a public information role. The committee makes
recommendations for program improvements, expansions, or changes. A seven point effectiveness rating was implemented in 2013-14 for each program based on items such as number of active business members, meeting attendance, and industry-trend analysis. The average strategic direction rating for Measure 4.1 of employer advisory committee effectiveness is 6.42 on the seven-point scale for 2014-15. Strategic Measure 4.2 represents targeted conversations involving industry and college representatives. These discussions focus on current challenges and future trends related to workforce skills in selected industries such as manufacturing, health care and transportation.
Table C - Robust Partnerships engage employers
Measures 2013-14 2014-15 2015-16
Actual Actual Target
Measure 4.1: Employer advisory committee effectiveness average rating 5.32 of 7 6.42 of 7 5.0+ of 7
Measure 4.2: Number of industry sector dialogues 6 5 5
FVTC Program Accreditation and Licensure Requirements
Some FVTC programs prepare students to complete examinations that are required in order to work in their field of study. Accredited programs are within the Service, Health and Public Safety divisions while most programs requiring certification are in the Transportation and Service divisions.
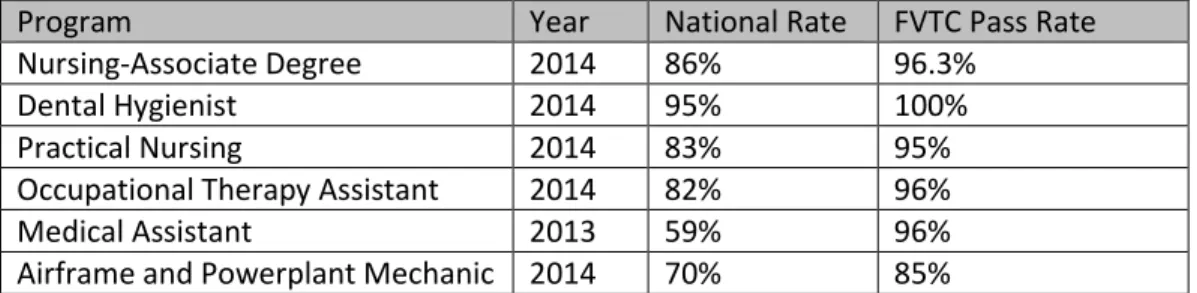
The Health programs typically have a competency exam at the end of the program of study allowing students to become registered or certified in order to work in Wisconsin. FVTC students have performed well or are showing improvement in the health and other areas (Table D). In 2015-16, all programs which require an exam for graduates to be eligible for employment in the field, have posted their most recent pass rates on their Programs of Study webpage (www.fvtc.edu). This posting meets the Higher Learning Commission expectations for accreditation.
Table D – FVTC Program 2014 Licensure Pass Rates compared to Natl. Pass Rate
Program Year National Rate FVTC Pass Rate
Nursing-Associate Degree 2014 86% 96.3%
Dental Hygienist 2014 95% 100%
Practical Nursing 2014 83% 95%
Occupational Therapy Assistant 2014 82% 96%
Medical Assistant 2013 59% 96%
Airframe and Powerplant Mechanic 2014 70% 85%
All programs with accreditation, certification, and licensure requirements are compliant with the established passing scores. FVTC faculty and staff monitor this compliance very closely and take appropriate measures to meet or exceed the minimum requirements.
Technical Skill Attainment
In 2014-15, FVTC continued to implement the three-phase process of designing a Technical Skill Attainment (TSA) assessment for each of its 120+ associate degrees, technical diplomas and apprenticeship programs and to receive the appropriate approval from the Wisconsin Technical College System (WTCS).
7 Program teams have worked with their local teams or statewide teams of similar programs to design an
assessment that is comprehensive in gauging student mastery of intended program outcomes, as well as Employability Essentials (soft skills). As of early 2015-16, 74 programs and apprenticeships are reporting TSA data on student performance to the WTCS. Ten programs are approved at the Phase 1 level and ready to work on Phase 2. Another 40 programs and apprenticeships are at the beginning stages of the TSA process. The 2015-16 target is to reach 100 programs at Level 3 reporting TSA data.
Industry-Validated Curriculum
“Industry-validated curriculum means a curriculum that is developed with business or industry input and that is based on competencies and assessments that reflect the skills and knowledge necessary for a specific job or jobs within a specific type of business or industry” (WTCS definition). FVTC validates curriculum information from sources such as advisory committee input, program accreditation and licensure requirements, and program technical skill attainment for all 127 programs. This performance ranks FVTC as second in the state for this outcomes-based funding measure (Figure 3).
Number of Graduates
The statewide outcomes-based model places emphasis on graduation. In 2014-15, FVTC had 1,045 associate degree graduates and 1,700 technical diploma graduates for a total of 2,745 graduates. The three programs with the most graduates were; Nursing Assistant (652), Truck Driving (175), and Business Management (106); indicative of great marketplace demand by both students and employers in these areas.
Benchmarking with other WTCS colleges based upon 2013-14 outcomes-based funding data, Madison ranked first with 1,875 degrees awarded in high demand fields. FVTC ranked second with 1,845 degrees awarded followed by NWTC (1,732), Gateway (1,678) and Milwaukee (1,450).
Persistence and Graduation
Students who do not persist in coursework through to graduation represent the loss of key skills needed in the workplace. Many students face personal and academic barriers to continuing in college. FVTC is committed to finding new ways to help more students complete all the classes needed to graduate. Student success, as measured by successful course completion, student persistence and graduation, is an integral indicator of FVTC’s strategic directions. The Strategic Plan Measures (Table E) highlight the results of our student success efforts in 2014-15 and the targets for 2015-16.
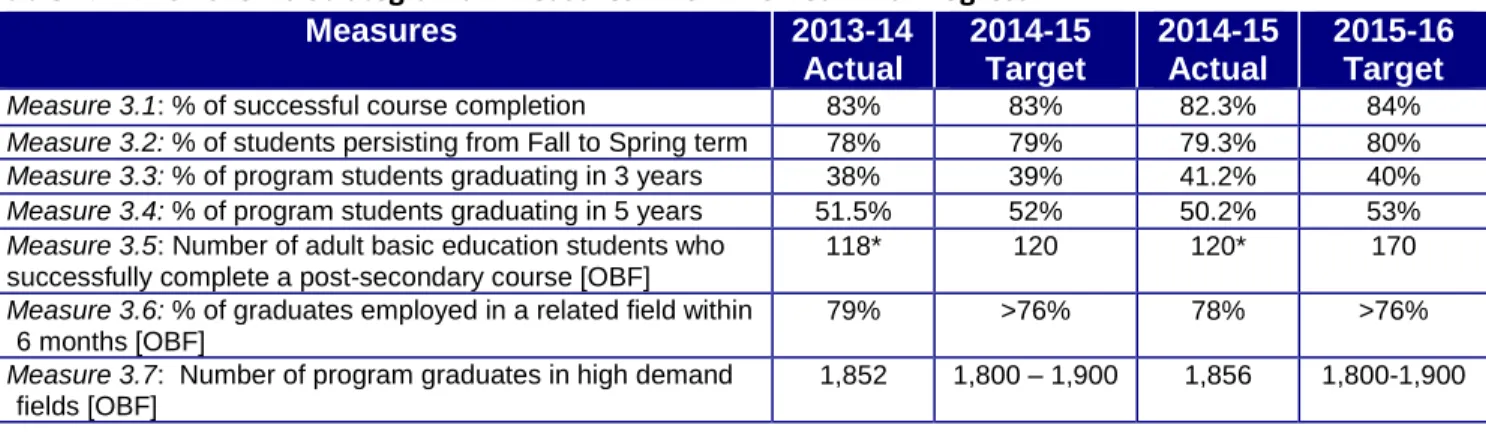
Table E: FVTC 2013-16 Strategic Plan Measures – 2014-15 Year End Progress
Measures 2013-14 Actual
2014-15 Target
2014-15 Actual
2015-16 Target
Measure 3.1: % of successful course completion 83% 83% 82.3% 84%
Measure 3.2: % of students persisting from Fall to Spring term 78% 79% 79.3% 80%
Measure 3.3: % of program students graduating in 3 years 38% 39% 41.2% 40%
Measure 3.4: % of program students graduating in 5 years 51.5% 52% 50.2% 53%
Measure 3.5: Number of adult basic education students who successfully complete a post-secondary course [OBF]
118* 120 120* 170
Measure 3.6: % of graduates employed in a related field within 6 months [OBF]
79% >76% 78% >76%
Measure 3.7: Number of program graduates in high demand fields [OBF]
1,852 1,800 – 1,900 1,856 1,800-1,900
Figure 3: 2014-15 Top Five Rankings--Number of Programs with Industry Validated Curriculum
8 Student success is a major issue at the state and national levels. As employers move to more advanced
technologies, FVTC provides well-trained individuals for occupations to meet the demands of a global marketplace.
The College provides many support and wrap around services to help students succeed which are intended to improve course completion, student persistence and graduation. Recent research calls for “Redesigning America’s Community Colleges” (Bailey, Jaggers, and Jenkins, 2015) by moving away from a cafeteria style approach (providing an assortment of services that student must seek out on their own) to a more integrated design entitled “guided pathways”. This approach anticipates that most students will need services but many will not be inclined to search for services. Rather than seek needed services, students will gradually disengage from the college, unless services are built into the process. FVTC staff are studying the research on the guided pathways approach and formulating a framework for redesigning both instructional and non-instructional systems to align with this approach.
Graduate Employment
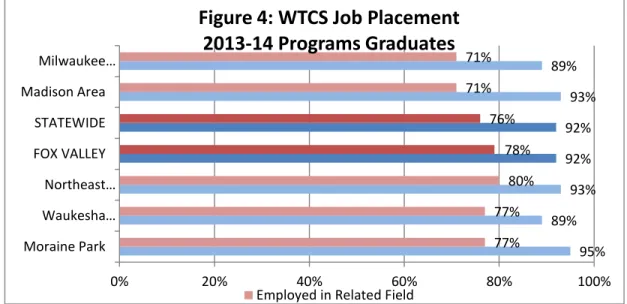
The Spring 2015 report of previous year graduates (2013-14) six months after graduation shows that 92% of FVTC graduates were employed, and 78% of placements were in jobs related to their programs of study. For peer benchmark colleges, job placement rates that are related to graduates’ field of study range from a high of 85% at Western to a low of 62% at Nicolet. The statewide average for placement in jobs related to program of study is 76% up from 74% in the previous year (Figure 4).
Source: WTCS Portal report FLW300 as of August 13, 2015
FVTC Strategic Direction Measure 3.6 related to improving graduate placement is showing progress with continued improvement efforts focused on this critical outcome. Additionally, this information is used for the job placement category in the outcomes-based funding model. Compared with other WTCS colleges, FVTC received the highest percentage of funding, ranking first in a three-year calculation of job placement related to program of study.
95% 89%
93% 92% 92% 93% 89%
77% 77%
80% 78% 76% 71% 71%
0% 20% 40% 60% 80% 100%
Moraine Park Waukesha…
Northeast… FOX VALLEY STATEWIDE Madison Area Milwaukee…
Figure 4: WTCS Job Placement
2013-14 Programs Graduates
9
Graduate Satisfaction
Ultimately, the fulfillment of this statutory purpose is measured by the satisfaction of our graduates with their education and employers with their performance in the workplace. Individuals and employers recognize the power of a credential through:
increased earning potential
better benefits
improved recession protection
higher job satisfaction
increased efficiency and performance
fewer social costs
FVTC’s 2013-14 graduates reported high satisfaction (98%) with their FVTC education.
Graduate Employment and Wages
Signs of an economic recovery continue with 49 programs of the College’s 98 programs with graduates responding to the survey had 100% employment with another 16 at 90% employment or higher. The average annual salary was reported at $35,223 which is a 4.2% increase reported by 2013 graduates from the previous year.
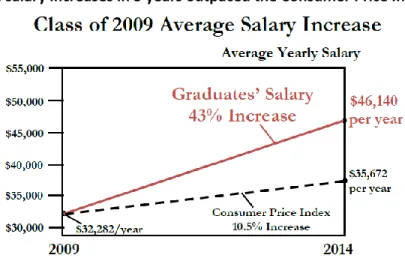
In the five year follow-up study (the Class of 2009), 21% of the 1,077 graduates responding to the survey had completed an additional degree by 2014. After five years, 61% of those employed reported working in the FVTC district. In 2009, six months after graduation, these graduates reported an average annual salary of $32,282. In the five-year follow-up (Figure 5), they reported an average annual salary of $46,140. This is a 43% increase as compared to a 10.5% increase in the consumer price index during the same time period. In
addition, 84% reported that their FVTC technical education was important in launching their career.
Figure 5 – FVTC Graduate salary increases in 5 years outpaced the Consumer Price Index
Employer Satisfaction
FVTC has a strong employer network across the district for hiring graduates with an emphasis in the high demand fields of health care, transportation and manufacturing. Each year, FVTC conducts a survey with graduate employers. In the 2015 Employer Satisfaction Survey, 161 employers responded regarding their employees who were 2013-14 FVTC graduates.
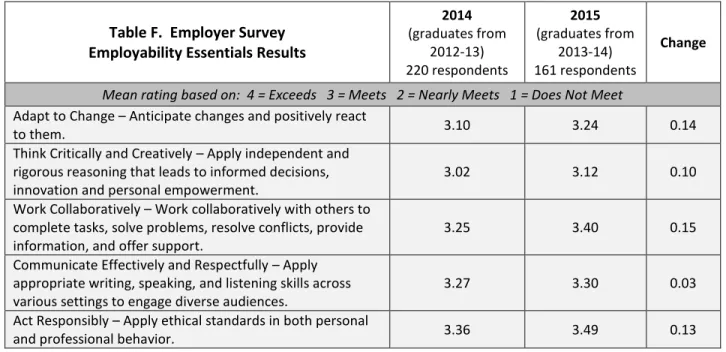
10 Employer responses are a valuable component in the process of obtaining feedback on programs offered by FVTC. To gather input, the employer satisfaction research is based on a four-point scale related to meeting expectations with 4 being “exceeds” expectations. Employers rated all areas above the “meets expectations” rating (3). Employers posted a mean rating of 3.42 regarding the importance of the local technical college to overall business success. Employers’ satisfaction with graduates’ technical education posted a 3.42 mean rating. Employability Essentials ratings (Table F) demonstrate the continued employer focus on “soft skills” and the strong performance of our graduates in most areas with an increased mean rating in the 2015 report as compared to the 2014 report.
Table F. Employer Survey Employability Essentials Results
2014
(graduates from 2012-13) 220 respondents
2015
(graduates from 2013-14) 161 respondents
Change
Mean rating based on: 4 = Exceeds 3 = Meets 2 = Nearly Meets 1 = Does Not Meet Adapt to Change – Anticipate changes and positively react
to them. 3.10 3.24 0.14
Think Critically and Creatively – Apply independent and rigorous reasoning that leads to informed decisions, innovation and personal empowerment.
3.02 3.12 0.10
Work Collaboratively – Work collaboratively with others to complete tasks, solve problems, resolve conflicts, provide information, and offer support.
3.25 3.40 0.15
Communicate Effectively and Respectfully – Apply appropriate writing, speaking, and listening skills across various settings to engage diverse audiences.
3.27 3.30 0.03
Act Responsibly – Apply ethical standards in both personal
and professional behavior. 3.36 3.49 0.13
Staff Ideas for Vision 2020 – Summary of themes from faculty/staff feedback to the report.
Key Strength Areas that benefit our community and set the foundation for our future revolve around FVTC’s hallmark responsiveness to both student and employer needs to build a vibrant workforce. Our strong alignment with industry on key curriculum and skills outcomes leads to high graduate employment rates. The many ways that FVTC staff nurture collaborative relationships with the business and industry community show that we are constantly listening to what the community needs and are responding accordingly. Similarly, FVTC recognizes and anticipates the changing needs of our student body. As student expectations of the college experience evolve, the College examines its technology and service structure to optimally support more students to becoming graduates who serve as qualified workers for area employers.
Credit programming in 2020 will continue to emphasize highly targeted, high demand, and contemporary skills instruction delivered in flexible formats to allow for the greatest opportunity for all employed, unemployed and underemployed talent to participate. Technology trends in each program area need to be closely monitored in order to ensure alignment and relevancy in the curriculum. Continuous review of current degrees and
certificates is needed to determine adjustments in the credential design. As employers experience the skilled labor shortage, many organizations may hire workers who require some level of employer sponsored technical training to perform job duties. This may require smaller chunks of credit learning options that ladder into credentials. Fast-paced change will require continuous learning by program faculty to keep current in their field along with instructional technology innovations. Monitoring types of positions trending up and down in
11 industry and improved speed to market will be needed to keep pace with inevitable increasing competition in higher education.
The FVTC organizational structure is well-positioned to meet the vision of 2020 which is propelled by the depth and devotion of our faculty along with our close relationships to business and industry as pivotal partners in staying abreast of changing community needs for technical education. The key structural redesign focuses on the continued integration of student support services into the college experience. In addition, close
collaboration between general education and technical programming is essential with an emphasis on
improving mastery of the “Employability Essentials” for all FVTC graduates. The need and opportunity for more cross-divisional programming will challenge our organizational structure as it is currently aligned with WTCS categories and reporting requirements.
At What Cost
Cost to the Student
In past three years, tuition has increased between 2% and 3% with current 2015-16 cost of $128.40 per credit.
Peer Benchmarks
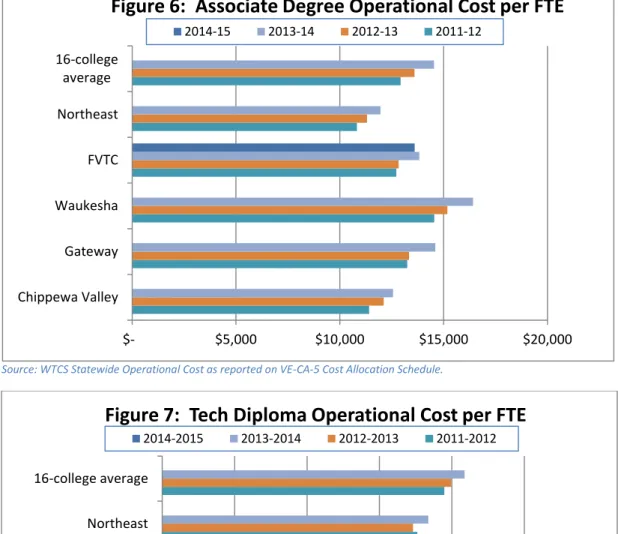
Operational cost per FTE is defined as all operating fund expenditures (General, Contract Training, & Grant funds) except Criminal Justice federal grant expenditures, which have been excluded to ensure comparability across the system. FTEs generated in the Criminal Justice grants have also been excluded in the cost calculations. The College consistently maintains a cost per FTE that aligns closely with the statewide average (Figures 6 and 7). 2013-14 is the most recent year available for the benchmark colleges. For 2013-14, FVTC cost per FTE increased 8.6% for associate degree and 6.3% for technical diploma areas. When total enrollments decline, as they did in 2013-14, the operational cost per FTE increases. 2014-15 FVTC data (unaudited) is provided to show the combined impact of declining enrollments and the first year of Act 10’s influence on instructional costs due to the impact of retirements and benefit cost sharing.
Comparisons with other WTCS colleges are provided for peer benchmarks. However, critical analysis is difficult due to multiple variations by district. These district variations can include the cost of living, demographics, local faculty contracts, types of programs, number of program offerings, staffing patterns, level of contracting activity, and other differences from college to college.
One potential explanation for the lower Associate Degree cost per FTE attributed to NWTC and CVTC is the greater emphasis that these two colleges have placed on offering general education courses as part of their transfer efforts (Figure 6). General education courses are more economical to offer, thus bringing down the overall cost per FTE. Technical diploma cost per FTE (Figure 7) is typically higher than associate degree cost per FTE due to intensive laboratory class time resulting in more contact hours for faculty with students, and the supplies and minor equipment needed for a higher level of hands-on experience in technical diplomas.
12
Source: WTCS Statewide Operational Cost as reported on VE-CA-5 Cost Allocation Schedule.
Source: WTCS Statewide Operational Cost as reported on VE-CA-5 Cost Allocation Schedule.
1 Blumenstyk, G. (2015) “American Higher Education in Crisis? What everyone needs to know”. New
York: Oxford University Press, p. 12-13.
$- $5,000 $10,000 $15,000 $20,000
Chippewa Valley Gateway Waukesha FVTC Northeast 16-college average
Figure 6: Associate Degree Operational Cost per FTE
2014-15 2013-14 2012-13 2011-12
$- $5,000 $10,000 $15,000 $20,000 $25,000
Chippewa Valley Gateway Waukesha FVTC Northeast 16-college average