2
Matthew Humphreys 2nd April 2014
There is a common idiom that a person “Can’t see the forest for the trees” which quite aptly sums up one of the most difficult problems facing modern financial professionals.
Today’s analyst has access to a near limitless amount of information; with products like the Bloomberg Terminal you can view charts on virtually any market,
commodity, bond, cross-rates and more, each having a myriad of Technical and Fundamental indicators to analyse. While information in itself is not a bad thing, an
overload of data can combine to a point where it all seems like white noise, with symbols containing the greatest potential for profit becoming obfuscated.
The problem is not an overload of information per se, which is something traders have had to deal with since the creation of ticker tape. The problem is the inability to filter this
information efficiently to display the specifics that are important at the time, without losing sight of the bigger picture.
It is problems like this that Market Analyst aims to find solutions for (it is part of our nature as a software engineering firm) and with the release of Market Analyst 7.4, we have included a newly conceived chart we have dubbed “Market Intelligence”.
What is Market Intelligence?
Market Intelligence is a reinterpretation of Business Intelligence, a method of taking raw data from multiple sources (accounts, reporting, research, etc.) and refining that into meaningful information which can be used by management to aid in decision making processes.
In a similar vein, Market Intelligence allows an investor to take multiple criteria composing of technical and fundamental information for a large and varied universe of symbols, and collates the results into a column style chart.
3
Matthew Humphreys 2nd April 2014
Figure 1 – Market Intelligence Chart – ASX Top 20 Constituents
The merging of this data presents a powerful chart providing several important points at once:
Quickly gauge the overall performance of the selected symbols according to user-defined criteria.
Identify individual symbols which are outperforming or underperforming the average according to user-defined criteria.
Compare current results with past performance.
4
Matthew Humphreys 2nd April 2014
How does Market Intelligence Work?
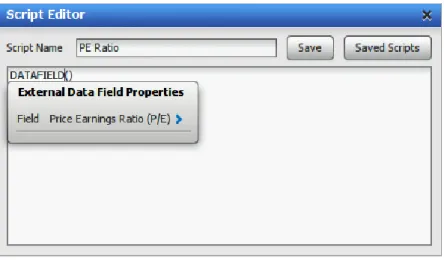
The Market Intelligence charts are tied in to the scripting language found throughout the various modules available in Market Analyst 7.
Using the scripting language, basic and advanced criteria can be set up using any function available in Market Analyst, including any of the fundamental values available through a connection to a Bloomberg Terminal.
Figure 2 - Market Intelligence Chart (Stacked Columns) - Dow Jones Constituents using PE Ratio and Best Target values sourced from Bloomberg.
5
Matthew Humphreys 2nd April 2014
There is no limit to the number of criteria you can set up in the Market Intelligence chart, nor is there any limit to the number of codes you can display within the chart.
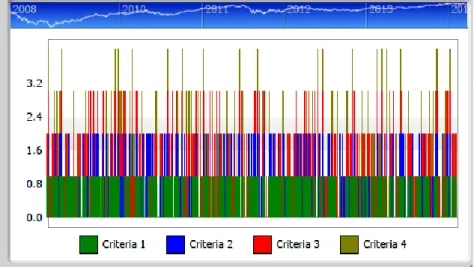
Figure 3 - Market Intelligence Chart (Stacked Columns) – FTSE 100 Constituents using 4 different criteria.
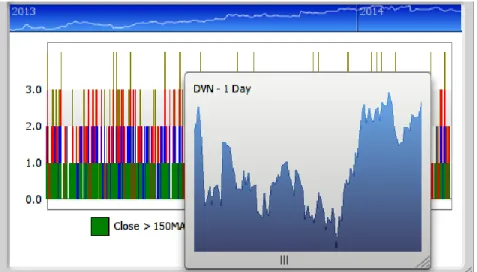
In the above example, each of the four criteria listed return a value of true (1) or false (0). In these types of setups it is recommended the Market Intelligence chart is set up to use Stacked Columns which allows for the easy identification of clusters. When an individual symbol does stand out, further analysis can be applied to the underlying price chart simply by left-clicking on the column.
Figure 4 - Market Intelligence Chart - Chart View Window
6
Matthew Humphreys 2nd April 2014
What happened in the past?
One of the core items an analyst tends to look for are repeating cycles, be it on the chart itself, or with the behaviour of various indicators applied to the chart. These cycles can act as a precursor to a change in trend and provides the analyst with a flag that further review may be required.
The first step in identifying important cycles is to look for common historical patterns occurring before significant turning points on the chart, something the Market Intelligence chart can do in a greatly optimised way.
Using the history slider along the top of the Market Intelligence chart, you are able to adjust the date the results are displaying. This allows you to view the state of your defined criteria for a variety of major historical turning points, to determine if there are any repeating cycles.
Figure 5 - Market Intelligence Chart (Stacked Columns) – Same setup as Figure 3 however with the date adjusted to February 2014.
If you are able to identify a pattern of historical markers, you will be able to monitor current charts for the same pattern within your selected criteria.
7
Matthew Humphreys 2nd April 2014
In the following example, a Market Intelligence chart has been created for the the constituents of the S&P500. Four criteria have been set up in an effort to identify possible trend reversal points.
Figure 6 - Market Intelligence Chart - S&P500 Constituents
Opening a chart for one of the included codes (Wells Fargo & Company was used in this example) from the Market Intelligence Preview screen links the two charts together. As the date line is moved to various peaks & troughs on the chart, the Market Intelligence chart updates to display the results for the selected date.
As each major trend reversal is reviewed, a pattern may emerge within the Market Intelligence chart itself.
Figure 6 - A 5.1% price reversal occurs on the chart at the same time the Market Intelligence chart identifies all 4 criteria were met. Further analysis indicates that other major turning points display the same setup on the Market Intelligence chart (10-01-2013, 18-09-2013, etc.). While not conclusive on its own, it does indicate further analysis is warranted across a broader spectrum of symbols using the selected criteria.
8
Matthew Humphreys 2nd April 2014
Market Intelligence Sample Charts
With Market Intelligence charts using the scripting language to build, from there are many combinations of criteria you can use, including indicators from Add On modules such as the ND Research tools:
Figure 7 - Market Intelligence Chart - ND Research Risk Reward
By default the columns of the Market Intelligence chart will be ordered Alphabetically. This can be adjusted so that the columns display in Ascending / Descending order:
9
Matthew Humphreys 2nd April 2014
You can also adjust the priority each script has by adjusting the order:
Figure 9 - Adjusting the priority of the criteria used on a Market Intelligence Chart
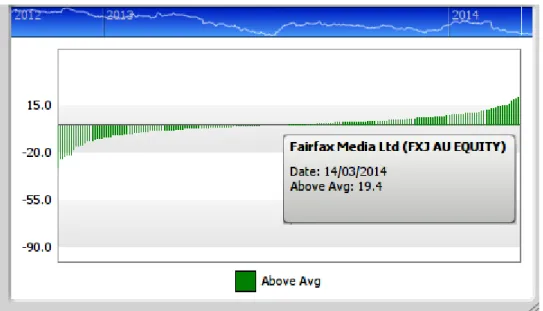
Market Intelligence charts can also be set up to use only single criteria. In the following example the columns are displaying the value (as a percentage) the symbols are trading above a 50 period Moving Average.
Figure 10 - Market Intelligence Chart - Price Above 50SMA (%) with Information Window in View
Another technique which can be used is the combination of fundamental and technical values to identify symbols with good potential value.
10
Matthew Humphreys 2nd April 2014
Figure 11 - Market Intelligence Chart - Dow Jones Constituents - RSI Turns Up (Blue) & PE Ratio (Green)
Summary
As with any new concept, the potential benefits from using this type of analysis style are still being discovered. While the initial feedback has been positive, we are eagerly awaiting a more detailed review from our existing network of professional traders.
We believe the examples provided in this paper demonstrate some of the advantages Market Intelligence can offer finance professionals in measuring the performance of individual symbols without losing a wider perspective.
The current Market Intelligence charts available are only the beginning, as we work to add even more features in future updates. This includes the ability to display the information as Pie charts, Stacked lines, Market maps or even 3D Surface maps. If you believe a certain visualisation would be suited to Market Intelligence charts, please contact us as we are always interested in receiving feedback.
If you do not have access to these charts and would like to try them for yourself, contact one of our Market Analyst offices and we would be happy to help you set up a trial account so you can experiment with these charts.
11
Matthew Humphreys 2nd April 2014
About Market Analyst
We are passionate about financial analysis using all techniques and models. Market Analyst has been designed to be the ultimate analysis solution for anyone who wants to gain insights into financial markets. More Information at http://mav7.com