1
Bucharest, March 2014
MINISTRY OF PUBLIC FINANCE
GOVERNMENT DEBT MANAGEMENT
STRATEGY
2014 – 2016
2
Contents
Summary ...3
1. Introduction ... 4
2. Objectives and scope ... 5
3. Description of the public government debt portfolio ... 5
3.1. Evolution of government public debt... 5
3.2. Risks of the public government debt portfolio at end-2013 ... 7
4. Macroeconomic background in Romania ... 11
Risks to baseline projections ...12
5. Funding sources ... 13
5.1. Domestic market ... 13
5.2. External markets ... 18
6. Analysis and strategic guidelines ... 22
6.1.Implications of the analysis of the existing debt portfolio, market development considerations and the macroeconomic analysis in the development of a debt management strategy 22
6.2. Results of the analysis of alternative debt management strategies 23
6.3. Strategic guidelines ...24
Annexes 1. Development of the domestic market of government securities ... 27
2. Improvement policy on cash management and measures to be taken...29
Acronyms
ATM Average time to maturity (years) ATR Average time to re-fixing (years) CEDB Council of Europe Development Bank
EBRD European Bank for Reconstruction and Development EMBIG Emerging Markets Bond Index Global of JP Morgan
EU European Union
GDP Gross Domestic Product
GMTN Global Medium Term Note Program for the eurobonds issuances on the foreign markets
IBRD International Bank for Reconstruction and Development IFIs International Financial Institutions
NIS National Institute of Statistics IMF International Monetary Fund MoPF Ministry of Public Finance NBR National Bank of Romania
NCP National Commission of Prognosis PDs Primary dealers
RON Romanian national currency
3
Summary
The present Public Government Debt Management Strategy for 2014-2016 (hereinafter the Strategy) is a continuation of Public Government Debt Management Strategy for 2013-2015 and was prepared following the international sound practice as defined in the WB-IMF Guidelines for debt strategy design1. The Strategy provides the direction in which the authorities intend to steer the funding and the structure of the debt portfolio to meet the Ministry of Public Finance’s debt management objectives as follows:
Cover the government’s financing needs and payment obligations, while minimizing medium and long-term costs;
Limit the financial risks of the government public debt portfolio,especially by extending the average remaining maturity, and
Develop a domestic market for government securities.
Strategic guidelines
The following principles shall guide the government funding decisions during the period 2014-2016:
1. Favoring a net financing in local currency to facilitate the development of the domestic debt market and to help mitigate foreign currency exposure.
2. Pursuing a smooth redemption profile, especially in the local currency and domestic debt portfolios avoiding to the extent possible the concentration of repayments in the short-term.
3. Mitigating refinancing risk by maintaining a foreign currency buffer and contracting credit lines when their conditions are judged favorable for the government debt portfolio.
4. Maintaining the exposure to interest rate risk under control by monitoring the share of domestic debt refixing within the next year and the average time to refix for the total portfolio.
5. Maintaining presence in the EUR market and access the USD market or other foreign currencies markets on an opportunistic basis, selecting the longest possible maturities bearing in mind the cost of extending maturity.
6. Gradually reducing the issuance of government securities denominated in euro in the domestic market while keeping a minimum outstanding that guarantee the liquidity of these bonds.
7. In the process of external financing, the foreign currency debt will be contracted mainly in EUR..
8. Continuation of the partnership with international financial institutions to benefit from their related financial products.
These principles translate into indicative target ranges2 for key risk indicators that allow flexibility in managing government debt to respond to change of the conditions in the financial markets, as follows:
1
See “Developing a Medium-Term Debt Management Strategy (MTDS)—Guidance Note for Country Authorities, Prepared by the Staff of the World Bank and the International Monetary Fund February 24, 2009.
2
This is a change from the previous strategy, which set maximum or minimum thresholds as targets. The limit referred to as the minimum or maximum can’t be exceeded during the period covered by the strategy (hard bound), while the other limit is to be achieved and can be exceeded (soft bound).
4
- to manage foreign currency risk:
1. keeping the share of local currency denominated debt between 35% (minimum) - 50% in total government public debt.
2. keeping the share of debt denominated in EUR as a proportion of foreign currency debt is set between 75% (minimum) - 90%.
- to manage refinancing risk
1. maintaining the share of debt maturing in the next 12 months between 25% and 35% (maximum) for the local currency debt and between 10% and 20% (maximum) for the total debt.
2. ATM should be maintained between 2.5 (minimum) and 4.5 years for local currency denominated debt and between 4.5 (minimum) and 6.5 years for total debt.
3. maintaining a foreign currency buffer of four months of financing needs.
- to manage interest rate risk
1. the share of debt re-fixing its interest rate in the next 12 months should remain between 25% and 35% (maximum) for the local currency debt and between 20% and 30% (maximum) for the total debt.
2. maintaining ATR between 2.5 and 4.5 years for local currency debt and between 4 and 6 years for total debt.
1. Introduction
In August 2008 the Ministry of Public Finance (MoPF) in consultations with the National Bank of Romania elaborated the first Public Government Debt Management Strategy for 2008-2010 which was approved by Government in August 2008; starting in 2011 the strategy has been revised anually in compliance with the legal framework3 and in consultation with the NBR. The present Strategy is a continuation of this work and was prepared following the international sound practice as defined in the WB-IMF Guidelines for debt strategy design, with support of the WB and financing from Social European Funds under the project“Strengthening public debt management” SIMS - 39917.
As it has been the case with previous documents, the Strategy for 2014-2016 is consistent with the medium-term Fiscal-Budgetary Strategy and with the agreements concluded with the international financial institutions (IMF/WB/EU). As last year, the Strategy focuses exclusively on the composition of the public government debt, in particular on those aspects for which the debt manager can be made accountable4. Accordingly, the Strategy provides the direction in which the authorities intend to steer the funding and the structure of the debt portfolio and such direction is expressed in terms of target bands for the main risk indicators: refinancing, interest rate and foreign currency risks. As the experience of other countries show the use of bands provides debt managers with the flexibility required to respond to the changing conditions of the financial markets.
3
As stated in the Government Emergency Ordinance 64/2007 and the Government Decision 1470/2007.
4
In consequence, the document avoids committing to fiscal policy targets such as debt/GDP or to cost/GDP since the first is an indicator depending on the fiscal targets and the second depends on the fiscal targets and market developments both of which are out of the control of the debt manager.
5
2.Objectives and scope
The Strategy will be the vehicle for the Ministry of Public Finance to achieve its debt management objectives as follows:
Covering the government’s financing needs and payment obligations, while
minimizing medium and long-term costs;
Limiting the financial risks of the government public debt portfolio,especially by extending the average remaining maturity; and
Developing a domestic market for government securities.
The first two objectives are stated in the EGO no 64/2007 and are complemented by the domestic market development objective which was formulated in the Strategy for the period2013 -2015.
The scope of the Strategy is limited to debt contracted or guaranteed by the Government, through the Ministry of Public Finance, but excluding the loans from the State Treasury Account (“temporary financing”). Temporary financing is considered a cash management instrument and cannot be viewed as a financing vehicle in the medium-term. The government policy with regards to cash management, including temporary financing, is presented in Annex 25.
3. Description of the public government debt portfolio6
3.1. Evolution of government public debt
At the end December 2013, the outstanding government public debt was RON 233.07 billion, 36.9% of GDP.
Graph 1: Evolution of public government debt (in % of GDP)
Source: MoPF
5
It should be noted however that drastic changes in the level of temporary financing may have an impact in the issuance of government securities and can affect the plans for developing the domestic debt market.
6
Does not include temporary financing.
7
6
As illustrated in graph 2, since 2008 the structure of the public government debt has continuously improved from a portfolio comprising mainly non-marketable debt (external8 loans contracted with IFIs) to one with more marketable debt instruments (with a growing proportion issued in local currency).
Graph 2 : Marketable debt instruments vs non-marketable debt instruments
42.9% 51.4% 51.1% 56.5%
62.7% 66.2%
57.1% 48.6% 48.9%
43.5% 37.3% 33.8%
0% 10% 20% 30% 40% 50% 60% 70% 80% 90% 100%
2008 2009 2010 2011 2012 2013
Non‐marketable debt instruments
Marketable debt instruments
Source : MoPF
From the outstanding public government debt at the end of 2013, 50.4% was domestic and 49.6% external. As presented in graph 3, the bulk of the domestic debt is represented by government securities, T-bills and T-bonds (mainly denominated in local currency), whereas the external debt is mainly represented by loans contracted with IFIs and bonds issued in the international capital markets.
Graph 3: Composition of the debt portfolio by market of issuances and debt instrument
Domestic debt instruments External debt instruments
Source : MoPF
Government securities issued in the domestic and external markets represented 66.2% of total public government debt compared to 33.8% of loans, and 59.4% of these securities are denominated in local currency.
8
Criterion for type of debt (domestic/external) is market of issuances and not that reflecting the residency of creditors. 8.8%
83.6% 7.6%
T-bills
bonds
7
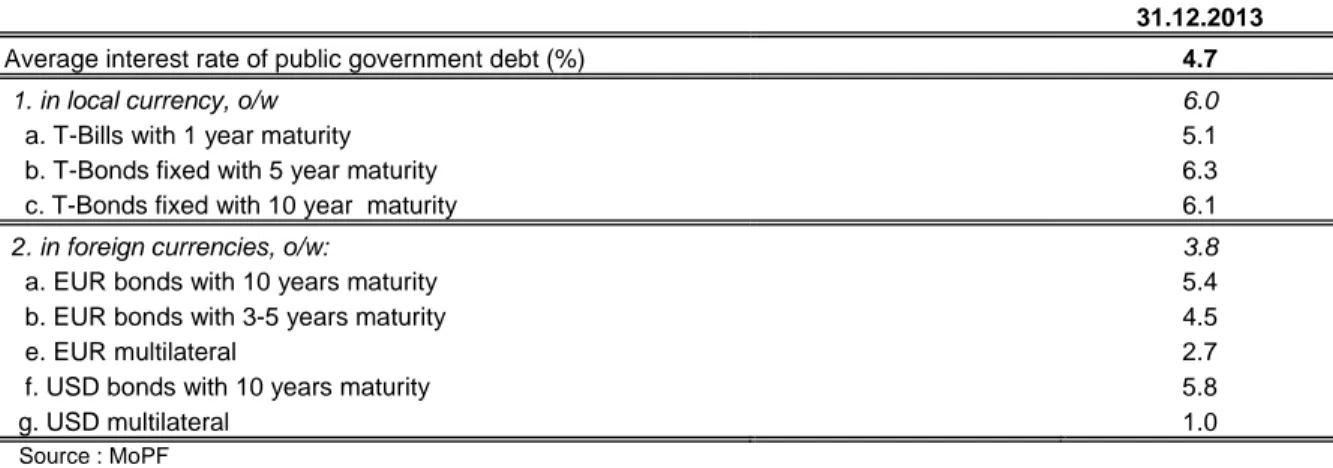
The overall cost, approximated by the average interest rates9, decreased slightly in 2013 driven by lower interest rates especially of external debt. Debt in local currency at end-2013 remains more expensive than debt in foreign currencies as presented in table 1.
Table 1: Cost of direct debt by type of instruments10
31.12.2013
Average interest rate of public government debt (%) 4.7
1. in local currency, o/w 6.0
a. T-Bills with 1 year maturity 5.1
b. T-Bonds fixed with 5 year maturity 6.3
c. T-Bonds fixed with 10 year maturity 6.1
2. in foreign currencies, o/w: 3.8
a. EUR bonds with 10 years maturity 5.4
b. EUR bonds with 3-5 years maturity 4.5
e. EUR multilateral 2.7
f. USD bonds with 10 years maturity 5.8
g. USD multilateral 1.0
Source : MoPF
The significant portion of multilateral loans contracted at concessional rates explain the lower cost of external funding; in addition, bonds placed in the international capital markets are usually issued at significantly lower yields compared to local currency securities as illustrated in graph 4.
Graph 4: Domestic benchmark bond yield vs 5 yrs eurobond
Source: MoFP
3.2. Risks of the public government debt portfolio at end-2013 Currency risk
At the end of 2013 close to 60% of the debt portfolio was denominated in foreign currencies. While at first sight this ratio would suggest a significant exposure to foreign currency risk, the relative low volatility of the RON/ EUR rate and the substantive share
9
Calculated as interest payments projected for 2014 divided by outstanding amount for each debt instrument at end-2013.
10
8
of long-term foreign currency debt denominated in EUR11 makes the risk releated to this exposure easier to manage.
Graph 5: Public government debt by currency
39.8%
50.0%
7.0% 2.2% 1%
RON USD EURO SDR o thers
Source: MoFP
As illustrated in Graph 6, debt contracted in USD is significantly riskier than that contracted in EUR. Over the last 3 years the volatility of the RON/USD has been four to five times higher compared to the RON/EUR exchange rate.
Graph 6: Annual change in the RON/EUR and RON/USD exchange rates
Source: MoFP; NBR
A depreciation of the local currency against EUR by 10% and against USD by 30% in 2014 would increase the debt stock by RON 18.3 billion or 2.8% of GDP and the debt service payments by RON 0.3 billion or 0.2% of central government revenues12. Accordingly, the exposure to exchange rate risk could be considered moderate but not negligible given the uncertainty related to the timing of adoption of the EUR.
Refinancing risk
The structure of repayments presented in graph 7 shows some accumulation of amortizations in the first 3 years. The concentration of repayments over the short term
11
Long-term euro denominated debt issued with a bullet structure implies a redemption of the principal within a time-horizon in which euro adoption is feasible and therefore a reduced implied currency risk.
12
9
is particularly noticeable in the domestic debt13 and reflects the importance of T-bills in the government funding in the crises period 2009-2012, although on a clearly downward trend, reaching 10.0 billion RON at end 2013. The refinancing of these obligations may pose a challenge in the financing process from the domestic market if the banks were to find alternative and more profitable placements with the revival of demand for credit from the private sector14. On the external side, refinancing risk is low mainly as a result of the repayment structure of the loans contracted with the international financial institutions.
Graph 7: Principal repayment schedule on public government debt at end- 2013
45.7 35.7 34.6 20.6 21.9 14.0 14.4 4.6 11.814.0 3.6
1.21.11.60.70.60.6 2.60.4 0.30.30.30.30.30.30.30.30.30.30.00.00.0 0.0 10.0 20.0 30.0 40.0 50.0 60.0 70.0 80.0 90.0 bil lion RO
N external debt
domestic debt
Source: MoPF
The redemption profile of the debt portfolio results in an average time to maturity (ATM) of 4.4 years: 2.7 years for local currency denominated debt and 5.5 years for debt denominated in foreign currencies.
Table 2: Refinancing risk indicators15
2012 2013 Domestic currency denominated debt Foreign currency denominated debt Total Domestic currency denominated debt Foreign currency denominated debt Total
Debt maturing in 1 year (% of total)
38.0 12.6 24.0 33.0 10.0 19.0
ATM (years) 2.1 5.3 3.9 2.7 5.5 4,4
Source: MoPF
13
by market of issuance.
14
MFP aims to increase the share of domestic issuances used for deficit financed from 50% in 2014 to 60% in 2015 and 70% in 2016, issuing a maximum volume of government securities of about RON 50 billion (for budget deficit financing and for refinancing of the public debt) estimated for 2016, but with about 5 billion RON less than in 2013.
15
the WB model used for formulating the Strategy considers for calculating the risk indicators, 1 year maturity for the flows and the formula for ATM was change by assuming that payments occur at the middle of the year instead at the end of the year. The T-bills are treated as fixed interest rate debt (as presented in Strategy 2013-2015) compared with indicators presented in this section which are calculated using public government debt computerized system (FTI - STAR) taking into account the date of principal repayments and that treat T-bills as debt with floating interest rate.
10
Interest rate risk
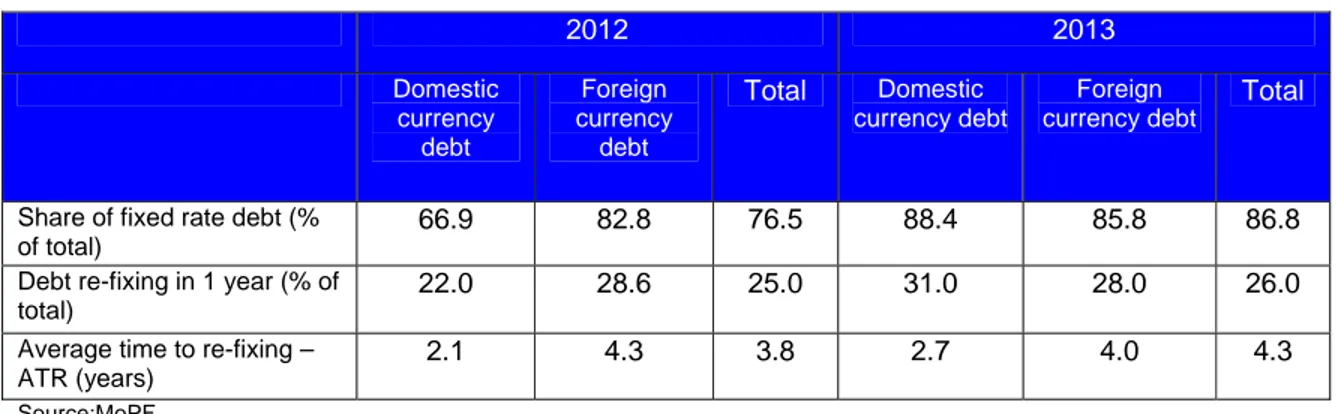
Given the small portion of debt contracted at variable rates (see Table 3), interest rate and refinancing risks are similar: high for local currency obligations and low for foreign currency ones. A 1% increase in interest rates in 2014 will increase debt service payments by RON 538 million, 0.3% of central government revenues, in the local currency debt and RON 201 million, 0.1% of central government revenues, in the foreign currency debt.
Table 3: Interest risk indicators16
2012 2013
Domestic currency
debt
Foreign currency
debt
Total Domestic
currency debt
Foreign
currency debt Total
Share of fixed rate debt (% of total)
66.9 82.8 76.5 88.4 85.8 86.8
Debt re-fixing in 1 year (% of total)
22.0 28.6 25.0 31.0 28.0 26.0
Average time to re-fixing – ATR (years)
2.1 4.3 3.8 2.7 4.0 4.3
Source:MoPF
The implementation of the Public Government Debt Management Strategy for 2013-2015
In 2013 all risk indicators were within the targets established through the public government debt management strategy for 2013-2015, except the indicator „share of domestic currency debt in total government debt”, as reflected in the presentation of financial indicators in this chapter and in Table 4.
The indicator „share of domestic currency debt in total government debt” was below the target of 40% of total portfolio, because of the external debt in foreign currency contracted from external markets, respectively the eurobonds issued in international capital markets and the disbursement of the first installment of Euro 700 million of IBRD DPL - DDO, to extend the average remaining maturity of the outstanding debt portfolio and thereby, to decrese the refinancing risk and to consolidate the buffer at the State Treasury disposal by about 2.0 billion Euro, due to the favorable financial conditions on financial markets.
16
11 Table 4 : Risk indicators at end 2013
Local currency debt re-fixing in 1 year (% of total) 31.0% max 45% in 2013 and lower thereafter
ATM for local currency debt (years) 2,7 min 2 ani in 2013 and higher
thereafter C.Interest rate risk
Debt re-fixing in 1 year (% of total) 26.0% max 35%
Local currency debt maturing in 1 years (% of total ) 33.0% max 45% in 2013 and lowr thereafter
ATM for total debt (years) 4.4 min 4
Share of EUR denominated debt in foreign currency dedominated debt (%
of total) 83.0% min 70%
B.Refinancing risk
Debt maturing in 1 year (% of total) 19.0% max 25%
Indicators*) 31/12/2013 Indicative targets according to
Strategy 2013-2015 A.Currency risk
Share of domestic currency debt in total (% of total) 39.8% min 40%
*) without loans from the availabilities of the General Current Account of the State Treasury
Given the above, we can conclude that the refinancing and interest rate risks for lei denominated debt are the most important risks associated to public government debt portfolio, whereas the exposure to currency risk is easier to mange but cannot be neglected because of uncertainty regarding the timing of adoption of EUR.
4. Macroeconomic background in Romania
In 2013 the GDP registered a real economic growth of 3.5% year/year, the fastest growth rate in the region, thanks to a strong agricultural production and record-high exports. The strong performance of the external sector, coupled with a still weaker domestic demand, contributed to a significant improvements in the current account deficit which, together with net capital inflows, resulted in the accumulation of additional EUR 1.3 billion in NBR foreign reserves in 2013 to EUR 32.5 billion at end-2013. Economic recovery in 2013 has been supported by a robust process of fiscal consolidation, a sustained reduction in inflation which allowed NBR to lower the monetary policy rate to 3.5% in February 2014, hystorically the lowest ever, and a relatively stable annual average exchange rate of about 4.4 RON/EUR.
On medium term, continued sound economic performance is important as a results of the successful completion of the macroeconomic and precautionary financial assistance programs signed with the international creditors (the IMF and the European Union) in 2011 and following the implementation of the measures agreed in the precautionary financing package signed in 2013, beeing created the necessary prerequisites to stimulate economic growth potential through structural reforms.
For the period 2014-2016, economic growth, as annual average is estimated at around 2.6%,17 mainly reflecting the continuation and acceleration of structural reforms, including labor market reforms, the improvement of the absorption of European funds and the revival of economic activity at international level, and especially in the
17
12
Eurozone. Government investments supported by an improved absorption rate of European funds will also support economic growth over the next three years. In this environment of moderate economic growth and continued fiscal consolidation, it is expected that the annual inflation rate to remain within the target range of 2.5% + / - 1 percentage point.
The process of fiscal consolidation towards achieving the medium-term objective on structural deficit (1.0% of GDP) in 2015, in accordance with the Stability, Coordination and Governance Treaty of the Economic and Monetary Union, signed by Romania in March 2012, will result in a downward trend of the gross financing needs. With relatively small budget deficits, the gross financing needs will primarily be the result of the refinancing of the government public debt as shown in the table below.
Table 5: Projections of the financing needs
Indicator 2013 2014 2015 2016
Central government revenues ( RON billion) 161,0 169,2 178,8 188,5
Central government expenditures ( RON billion) 176,3 183,1 188,1 198,4
Central government deficit (I) ( RON billion) 15.3 13.9 9.4 9.9
Refinancing of public government debt18 (II) ( RON billion) 55.6 45.7 35.7 34.6
Gross financing needs (I+II) ( RON billion) 70.9 59.6 45.1 44.5
Source : MoPF
After the sharp contraction of the deficit in 2013, the current account of the balance of payments is expected to modestly widen in the medium term, as the domestic demand recovers. The macroeconomic assumptions for the Strategy 2014-2016 are summarized in the table below.
Table 6 : Baseline macroeconomic projections
Indicators 2013 2014 2015 2016
Nominal GDP(RON billion ) 631.1 664.4 698.8 737.2
GDP growth(%) 3.5 2,3 2,5 3,0
Central government deficit19 (% in GDP) -2.4 -2.1 -1.3 -1.3
Current account deficit (% in GDP) -1,1 -1,2 -1,2 -1,5
Inflation (end of the year %) 1,55 3,4 2,5 2,3
Inflation(annual average %) 4,0 2,4 2,8 2,5
Average exchange rate RON /EUR 4,42 4,45 4,40 4.40
Average exchange rate RON /USD 3,33 3,27 3,24 3,24
Source: NCP, MoPF , INSSE
Risks to baseline projections
Deviations from the baseline macroeconomic projections described above could result from the materialization of the risks at international level, including those resulting from the uncertainties on the U.S fiscal and monetary policies, the vulnerability of emerging market economies, and the subdued growth in the euro area. External
18
Principal repayments of public government debt according to national legislation based on the outstanding at the end of December 2013 (includes guarantees and does not includes temporary financing).
19
13
shocks associated with these risks can reduce economic growth via the contraction of exports or the slowdown of capital inflows20, and can trigger an increase in the government funding needs and higher funding costs. Adverse climate conditions can also reduce economic growth via lower agriculture output, lowering government revenues and pushing up food prices, increasing the need to support the affected population and widening the government primary deficit.
Recent turbulences in the emerging markets triggered a round of depreciations affecting currencies such as the TKL, BRL, IRP. As capital flows out of emerging markets, the cost of funding in foreign currency increases both due to the widening out of credit spreads and because of the adjustment in the exchange rates. This trend could be exacerbated as a result of market overreaction to the FED’s tapering the QE or to the political deadlock on the U.S. federal budget. At the same time the cost of funding in domestic currency can also increase in countries where CBs respond aggressively to the worsening of the global monetary policy conditions. Due to its strong economic fundamentals and the consistency of its macroeconomic policy conduct of the recent years, Romania has avoided losses/reductions of foreign exchange reserves and the exchange rate was relatively stable despite market turbulences. However, the situation may change if such pressures intensify in Europe or globally.
The baseline macroeconomic projections indicate declining funding requirements and stabilising the public government debt to GDP ratio over the coming years. This will mean that the borrowing strategies will have to be implemented mainly with reference to the debt refinancing while the government may have more tolerance to risk. In addition, the macroeconomic context points to lower and stable inflation together with a relatively stable foreign exchange rate which may facilitate the extension of maturities for local currency government securities and make external funding less costly compared with domestic sources.
Significant risks to the baseline macroeconomic assumptions refers to the amplification of risks at international level, especially the uncertainties regarding the monetary policy of the FED and its impact on emerging markets triggering capital outflows and a depreciation of the RON, and subdued growth in euro area. Adverse climate conditions on the other hand could further slowdown economic growth and increase of budgetary deficit but this risk is partially mitigated by the commitment to reach the structural fiscal deficit of 1% of GDP in 201521.
5. Funding sources
5.1. Domestic market
5.1.1. Description of the funding operations in 2013
In 2013 the domestic market assured RON 55.4 billion, 78.1 % of the central government borrowing requirements22. About 60% of the borrowing program was
20
The exposure to the volatility of capital flows may have increased after the inclusion of the Romanian bonds denominated in local currency in the benchmark indexes of Barclay’s and JP Morgan due to the increase access of non-residents to the local bond market.
21
This is established through the Fiscal Budgetary Strategy on 2014-2016 elaborated in accordance with the Fiscal Responsibility Law, which was amended in 2013 to integrate structural fiscal targets and corrective actions in case of deviations.
22
14
completed in the first half of year thanks to improved market conditions. Thus, the market was tapped by issuing RON 10.8 billion T-Bills and RON 44.6 billion T-Bonds, of which 6.9 billion were denominated in EUR. As illustrated in chart 8 the MoPF continued striving for lengthening the average maturity of the government securities by issuing more on medium and long term sectors: the issuance of T-Bills in 2013 was less than a third of the new government securities issued in 2011 and 2012 and this allowed to increase the funding raised in the 3-5 and 5-10 year sectors. The 5-year and the new 10-year RON bonds were issued and reopened almost every month. Graph 8 : Breakdown of government securities issuance by maturity
Source: MoPF
At the end of 2013, the total outstanding of benchmark bonds covering 3, 5 and 7 year tenors amounted to RON 32.9 billion. These have been regularly reopened until their value reached the equivalent of EUR 1.5 - 2.0 billion per issue. Government securities are traded mainly over the counter, but also on the Bucharest Stock Exchange (volumes less than 1 percent of the secondary interbank market turnover).
In addition to securities in local currency, the MoPF issued 3-year T-Bonds denominated in EUR on a quarterly basis. These placements helped fund the repayment of two bonds maturing in August and November for EUR 1.8 billion and maintain the foreign currency cash buffer at a comfortable level23. Even though these instruments allow the extension of the portfolio remaining maturity and take advantage of certain windows of opportunity the MoPF’s medium term policy is to gradually reduce its issuances in EUR with the objective of building and consolidating the yield curve in local currency.
5.1.2. Market developments in 2013
The yields of government securities continued along the downward path of the past two years triggered by NBR monetarypolicy’ prudentadjustment starting in 2011, so that, after successive cuts by 125 bps the monetary policy rate ended 2013 at 4.00%, correlated with other factors such as market liquidity and the non-residents’ interest for government securities denominated in local currency. As illustrated in graph 10, the interest rates of government securities on short-term registered a sharper reduction
23
The foreign currency cash buffer is necessary to reduce the refinancing risk and the liquidity risk, and the net interest paid is a necessary cost for insurance against possible shocks.
15
(due to the lower bids on these segments of maturity and to money market conditions), increasing the cost of extending the average life of the domestic debt portfolio.
Graph 9 : Primary Market Yields in 2013 and 2012
Source: MoPF
Graph 10: Comparison between the monetary policy rate, 3M ROBOR and yields for 1 and 5 years
0.00 1.00 2.00 3.00 4.00 5.00 6.00 7.00
%
ROBOR 3M
Monetary
Policy Rate
1Y Yield
5Y Yield
Source: MoPF, NBR
The sustained compression in yields, that reached historical minimums in 2013, was reinforced by the introduction of selected government bonds in renowned emerging market indices which increased the non-resident investors’ appetite for benchmark bonds issued by Romanian Government. By March 2013, three local bonds (ROMGB 5.8% Oct-2015, ROMGB 5.75% Jan-2016 and ROMGB 5.9% Jul-2017) became eligible for the JP Morgan GBI-EM index. The initial weight in GBI-EM Global Diversified increased from 0.54% in March to 1.12% in December while new local bond series had been included (ROMGB 5.85% Apr 2023). Since the beginning of the year 10 series of bonds were included in the Barclays index.
From this perspective 2013 was probably one of the best for the government as issuer. This is also illustrated in Graph 11 that portraits the impact of the market liquidity in the auctions conducted throughout the year. As explained above, MoPF took advantage of the abundant liquidity in the market to lengthen the maturity of the government securities in order to reduce the refinancing risk .
16
These positive developments extended to the domestic securities in EUR. Between January and April 2013, the yields of 3-year euro denominated bonds dropped by 25 bps to 2.9 per cent and the trend continued until yields hit historical low of 2.48 per cent in October.
Graph 11: Primary market supply and demand
Source: MoPF
5.1.3. Secondary market
In 2013 the secondary market trading of government securities followed the trend set in the auctions. As shown in the graph 12, turnover trended upwards during the year and reached 59.3% in December 2013 compared to 26.8% at end of 2012.
Graph 12: Turnover24 of the government securities in 2013
Source: MoPF
24
Liquidity degree is calculated as report between the total volume of the monthly transactions and the total volume of the government securities
17
By international standards these turnover ratios are still low and the Ministry is conscious that much remains to be done in this front that is an important indicator of market development. With this in mind, the MoPF introduced regulation in January 2013 to assess the performance of PDs on the basis of criteria provided in Regulation no. 11/2012 with more emphasis on their activity in the secondary market. This measure was supplemented by introducing a non-competitive bid post-auction open to the top five best performing PDs. The annual 2013 assessment exercise has resulted in 9 PDs out of the 12 that will maintain the PD status for 2014.
5.1.4. Investor base
At the end of December 2013 the domestic debt market continued being dominated by commercial banks that held 55.9 % of the total outstanding government securities; next in importance were the non-residents with holdings that amounted to 21.0%; while pension funds’ holdings reached 8.5 %.
Banks will continue to remain the main supplier of funds to the government assuming the parent banks will maintain their exposure of to their subsidiaries in Romania. The sustained demand of government securities by commercial banks is based on the current environment where credit growth is still on negative territory and the pick up in the lending activity is expected to be slow and gradual. The banks preference focuses on maturities of up to 7 and marginally to 10 years, especially for the most liquid instruments included in the regional indices.
In the institutional investor group, local asset managers and pension funds have a relatively small share in the debt market but significant potential to support the development of the local government securities market in the near future. Total net assets of the private pension funds increased from RON 10.2 billion at the in 2012 to reach RON 14.7 billion in 2013 and are expected to further increase by RON 500 million annually, as the contribution to Pillar II will gradually increase from the actual 4.5% to 6% in 2016. Moreover, assets of private pension funds shall also increase as the mandatory contribution (currently 10.5%) under public system (Pillar I) gradually shifts to privately-managed funds (Pillar II) by 2016.
Graph 13: Government securities by holders
18
5.1.5. Expectations 2014-2016
The domestic market shall remain the main source of financing the State budget deficit and for refinancing of the local government debt. Higher yields implied in the current forward rates may be partly offset by improvement in the macroeconomic fundamentals and the potential upgrade by S&P which will bring Romania in the investment grade asset class.
To reduce funding costs and promote a better functioning of the secondary market the Ministry of Public Finance intends to continue building liquid benchmarks along the curve with a transparent issuance policy that will define the number of benchmark securities, ranges for issue size, as well as information in advance of the market in terms of volume, frequency of issuing/reopening of certain maturities.As part of this policy, the Ministry of Public Finance plans to gradually reduce the issuances of euro denominated bonds on domestic market.
Starting with the last quarter of 2014, once the policy and operational frameworks are in place, the Ministry of Public Finance intends to use liability management operations such as buy backs and bond exchanges to accelerate the construction of bechmark securities and faciliate the refinancing of large benchmarks coming due. Similarly, the MPF plans to start using reverse repo operations for an effective management of the Ministry’s cash balances, based on prior consultation with the NBR, to coordinate the policy for government financing and cash management with monetary policy.
With a clear and transparent issuance policy and more liquid benchmark securities the secondary market should gain in activity. To further incentivize the Ministry plans to introduce an electronic trading platform (ETP) in towards the end of 2014. This should increase transparency while reducing the transaction costs for market participants.
5.2. External market
5.2.1. Description of the funding operations in 2013
Since 2011 Romania has tapped the external market regularly issuing Eurobonds under EMTN Program whose maximum amount was increased from EUR 8 billion to EUR 15 billion in December 2013. The loans from international financial institutions to support the Government efforts for structural and institutional reforms had been an additional source of foreign financing, given the very competitive costs and access to long-term tenors.
In 2013 the MPF raised 3.1 billion EUR equivalent, in the external market, respectively EUR 2.0 billion and USD 1.5 billion, this amounts to 19.5% of the government borrowing requirements and was supplemented by EUR 1.4 billion in loans contracted with IFIs.
The favorable financial market sentiment towards Romania facilitated the issuance in February 2013 of 10-year Note on US market for an amount of USD 1.5 billion at a yield of 4.50%. This issuance was followed in September 2013 by a EUR 1.5 billion, 7-year Notes at 4.625% in September that was subsequently reopened in October for an
19
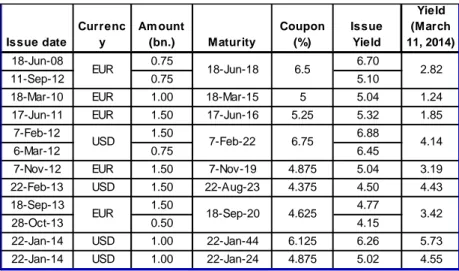
additional EUR 0.5 billion. All issues were oversubscribed around 5 times. Table 6 presents the issuance of bonds in the international capital markets since 2008.
Table 7: Romanian bonds issued on external market
Issue date Currenc y Am ount (bn.) Maturity Coupon (%) Issue Yield Yield (March 11, 2014)
18-Jun-08 0.75 6.70
11-Sep-12 0.75 5.10
18-Mar-10 EUR 1.00 18-Mar-15 5 5.04 1.24 17-Jun-11 EUR 1.50 17-Jun-16 5.25 5.32 1.85
7-Feb-12 1.50 6.88
6-Mar-12 0.75 6.45
7-Nov-12 EUR 1.50 7-Nov-19 4.875 5.04 3.19 22-Feb-13 USD 1.50 22-Aug-23 4.375 4.50 4.43
18-Sep-13 1.50 4.77
28-Oct-13 0.50 4.15
22-Jan-14 USD 1.00 22-Jan-44 6.125 6.26 5.73 22-Jan-14 USD 1.00 22-Jan-24 4.875 5.02 4.55 2.82
4.14
EUR 18-Jun-18 6.5
7-Feb-22 18-Sep-20 USD 6.75 3.42 EUR 4.625 Source: MoPF
5.2.2. Market developments in 2013
The interest rates for Romanian securities in foreign currency continued decreasing in 2013. This is explained by the evolution of interest rates in the Euro zone and the continued compression of the spreads for Romania.
Since the start of 2013 the ECB further eased its monetary policy stance pushing nominal yields to lower levels in the Euro zone, as shows in graph 14.
Graph14: EURO zone rates Q1 2012 – Q1 2014, Indexes
Source : Bloomberg
Although the ECB's monetary policy remained unchanged in the first part of the year, the downward trend in yields was interrupted in early May when the prospects of a reduction in the Fed stimulus took the market by surprise and investors began to anticipate the eventual end of the easing policy: 10-year Treasuries yield rose from a low of 1.63% in May to about 3% by the year end. The rise in US interest rates
0 50 100 150 Mar ‐12 Apr ‐12 May ‐12 Jun ‐12 Jul‐
12 Aug ‐12 Sep ‐12 Oct ‐12 Nov ‐12 Dec ‐12 Jan ‐13 Feb ‐13 Mar ‐13 Apr ‐13 May ‐13 Jun ‐13 Jul‐
13 Aug ‐13 Sep ‐13 Oct ‐13 Nov ‐13 Dec ‐13 Jan ‐14 Feb ‐14
ECB Mai n Refi nanci ng Rate
GER 5yr Yi el d Indexed
ROM EMBIG Indexed
20
generated a setback on euro area markets, set off then by ECB adoption of the forward guidance in July 2013 to limit the contagion. The ECB decision to cut the monetary policy rate to a historically low of 0.25% in November triggered a further decline in money market rates and reduced market volatility.
The accommodative monetary policy affects financial markets around the world. The prospect of low yields in core bond markets and increase liquidity levels contributed to investors searching for yield in lower-rated European bonds and emerging market paper. These positive developments were reflected in the Romania 10-year CDS spread to Germany bonds reaching its lowest level at the end 2013 since 2010 (see graph 15).
Graph15: CDS 10-years spread vs Germany
Source: Reuters
Against the backdrop of a respite in the European sovereign debt crisis and of a general rally on financial markets, financing conditions in Romania have eased markedly. The good economic performance, in particular on the fiscal side with the exit from the Excessive Deficit Procedure along with the inclusion of the country in Barclays’ and JP Morgan's emerging market indices, have fostered positive investor sentiment towards Romania and helped the MoPF to further reduce its funding costs, extend the maturities, increase liquidity of the instruments and broaden the investor base.
5.2.3 Expectations 2014 - 2016
We expect to see strong appetite for paper issued by countries in the European Economic Community from outside investors mainly especially from countries with stronger economic fundamentals and good financing positions. The key risks will remain towards the external macroeconomic and geopolitical shocks that might undermine the resilience shown during the period of increasing the volatility due to the uncertainties regarding FED monetary policy.
Romania however is less vulnerable to these risks because of the lower foreign ownership in government bonds and equity market and the anticipated increase in inflows from EU funds that should consolidate the foreign reserves levels and maintain the stability of the local currency. Furthermore, the renewed EU/IMF agreement should strengthen the confidence of international investors and the foreign currency buffer should help withstand potential external shocks.25
25
21
The Ministry plans to maintain Romania’s presence in the international capital markets albeit at slower pace since the domestic market will be sourced as the main fund provider for the government. Most placements should be denominated in EUR to consolidate and expand the price references for the government with particular interest in the longer maturities subject to market conditions.
Nevertheless, the issuance of bonds in USD will also be considered as it offer advantages in terms of longer maturities, increased capacity of absorption and a diverse investor base. The latter is particularly important for Romania as a funding alternative in case external events such as the crisis in the euro result in limited access to financing in the European markets.
In general the Ministry will retain flexibility in terms of the timing and size of the access to the international capital markets bearing in mind cost and risk considerations as well as the potential implication on NBR objectives and monetary policy as well as local market developments. Access to international capital markets especially in USD will be undertaken on opportunistic basis.
Finally, the implementation of structural reforms in key economic sectors, such as health services, education and social inclusion areas will continue to be funded through loans contracted from international financial institutions (World Bank, EIB). The recourse to private placements shall be only opportunistic.
In 2014 the Ministry will contract the remaining amount from DPL DDO (Euro 300 million), as well as the first World Bank development policy loan, amounting to EUR 750 million, in a series of programmatic development policy loans (DPL ) , which comprises two DPL loan type (the second with a similar value will be contracted in the first half of fiscal 2015). They are intended to support the Government objective of improving the Romania’s growth potential by increasing the effectiveness of public sector interventions and enhance the functioning of the capital, property and energy markets. The two loans from IBRD will be followed during 2016 – 2017 by two other similar loans that will be the subject of the second series of programmatic development policy loans (DPL), with the amount to be determined later. In addition to this, in 2013 has been signed and is in the process of ratifying a new financing contract between Romania and the EIB in the amount of 110 million euro, which will be increased in the course of 2014 according to preliminary discussions with the Bank to approximately EUR 300 million. The loan contracted with the EIB will significantly contribute to reducing pressures on the state budget to ensure the co-financing of measures from the National Program for Rural Development and to increase the degree of absorption in this program, by covering a substantial portion of the national contribution for selected schemes.
To these should be added other new loans to be contracted from international financial institutions during 2014 - 2016 in order to finance the state budget deficit and refinance public government debt, based on the realization of investments and/or other necessary actions in the sectorial reforms.
22
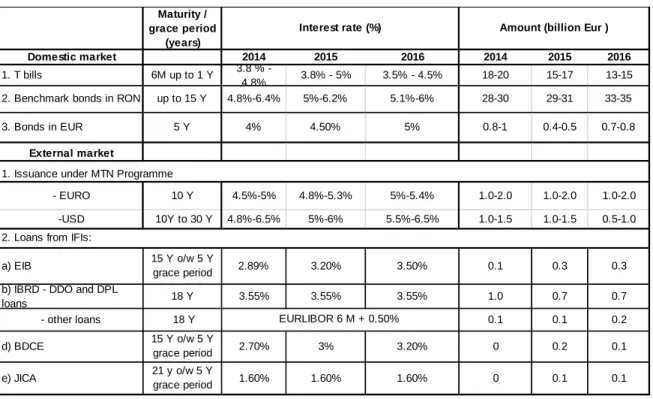
Table 8: Estimated financial conditions of the potential funding sources
Domestic market 2014 2015 2016 2014 2015 2016
1. T bills 6M up to 1 Y 3.8 % -
4.8% 3.8% - 5% 3.5% - 4.5% 18-20 15-17 13-15
2. Benchmark bonds in RON up to 15 Y 4.8%-6.4% 5%-6.2% 5.1%-6% 28-30 29-31 33-35
3. Bonds in EUR 5 Y 4% 4.50% 5% 0.8-1 0.4-0.5 0.7-0.8
External market
- EURO 10 Y 4.5%-5% 4.8%-5.3% 5%-5.4% 1.0-2.0 1.0-2.0 1.0-2.0
-USD 10Y to 30 Y 4.8%-6.5% 5%-6% 5.5%-6.5% 1.0-1.5 1.0-1.5 0.5-1.0
a) EIB 15 Y o/w 5 Y
grace period 2.89% 3.20% 3.50% 0.1 0.3 0.3
b) IBRD - DDO and DPL
loans 18 Y 3.55% 3.55% 3.55% 1.0 0.7 0.7
- other loans 18 Y 0.1 0.1 0.2
d) BDCE 15 Y o/w 5 Y
grace period 2.70% 3% 3.20% 0 0.2 0.1
e) JICA 21 y o/w 5 Y
grace period 1.60% 1.60% 1.60% 0 0.1 0.1
EURLIBOR 6 M + 0.50% Maturity /
grace period (years)
Interest rate (%) Amount (billion Eur )
1. Issuance under MTN Programme
2. Loans from IFIs:
Source: MoPF
6. Analysis and strategic guidelines
The strategic guidelines for managing public government debt in Romania reflect the cost-risk tradeoffs in the current debt portfolio26, the plans to deepen the debt market in local currency and the medium-term macroeconomic program.
6.1 Implications of the analysis of the existing debt portfolio, market development considerations and the macroeconomic analysis in the development of a debt management strategy
Exposure to refinancing and interest rate in the domestic market are the main sources of risk for the existing government debt portfolio; currency risk while significant is mitigated by the share of foreign currency debt denominated in Euro issued on long term and the perspectives of adoption of the EUR. In the composition of the foreign currency debt, the debt denominated in USD comes after the debt denominated in EUR, given that the USD market offers longer tenors than the EUR market but with substantially higher volatility versus the local currency.
26
23
Current market conditions allow Romania relatively easy access to funding in the international capital markets at medium and long tenors and supplement a domestic debt market with an investor base still dominated by commercial banks. Recent efforts to promote the deepening of the domestic market such as the inclusion of government bonds in regional market indices have resulted in a considerable increase in demand from non-residents; other measures related to the functioning of the PD system should improve liquidity and further strengthen investor’s demand in the future. The foreign and domestic interest rates ar expected to increase on medium term as implied in the forward rates from Bloomberg. Nevertheless, the interest rates in the domestic market are at low levels, even increasing in the first part of year 2014 compared with the end-2013 due to the monetary policy of FED and political disturbance, while external rates are still low and could remain at these levels in the near future.
Macroeconomic projections indicate a stable debt to GDP with declining funding requirements while low inflation together with a relatively stable exchange rate may facilitate the extension of maturities for government securities in local currency and the lower cost of external funding. Significant risks to these baseline assumptions include amplification of market turbulence related to uncertainty on the FED monetary policy and its impact on emerging markets, and subdued growth in euro area.
Based on these considerations, the MoPF evaluated financing alternatives that help mitigate the exposure to refinancing and interest rate risk. Two approaches were used: first relying more in longer tenor local currency securities and second replacing the financing in short-term T-Bills by long-term bonds in EUR. In addition, to examine the cost-risk tradeoff raised by the issuance of long-term bonds in USD, several borrowing strategies with different composition of foreign currencies (EUR versus USD) were simulated.
Alternative funding strategies were compared based on the projections of debt service under different scenarios of exchange rates and interest rates. The baseline scenario, defined as the estimate with higher probability of occurring, was used to calculate the expected cost of the different strategies. Risk was measured as the increase in cost resulting from applying shocks to the market rates used in the base scenario. Two indicators of cost and risk were used: debt / GDP and interest / GDP, both computed at the end of the third projection year, 2016. The results of the cost-risk analysis are then complemented by market development and macroeconomic considerations as described below.
6.2. Results of the analysis of alternative debt management strategies
Extension of average time to maturity (ATM) in domestic currency debt: Addressing the refinancing exposures in domestic currency debt using more RON denominated instruments on medium and long term maturity is getting more expensive as the yield curve in RON steepened despite a slightly flattening recorded in first part of year 201427. Nonetheless, the cost increase of extending ATM is relatively small in terms of debt/GDP, or, interest/GDP as T-Bill rates levels will be higher than these registered in 2013 – January 2014. Accordingly, the scenario analysis supports strategies that raise ATM as the cost increase is relatively small compared to the improvement in the
27
1-5 years and 1-10 years spreads for securities at the end of 2013 stood close to 200 bp and 160 bp respectively, while at 26 February 2014 to 150 bp and 170 bp.
24
redemption profile and the protection offered against a sudden and sustained increase in short-term interest rates.
Long tenor securities with significant outstanding volumes are expected to trade more actively in the secondary market; to an extent this has occurred with the inclusion of government bonds in the regional indices. However there is room to further increase the liquidity of government securities by revising the issuance policy around the creation and maintenance of benchmark securities. A strategy to increase ATM is fully compatible with the objective of developing an yield curve for RON denominated securities and with development of the secondary market. But flexibility is also neccesary to adapt to the changing in market conditions.
Reduce refinancing risk by rollover the T-bills with Euro denominated securities: Addressing refinancing risk in the local currency debt with Euro funding is advantageous when looking at the debt servicing flows. Indeed, when interest to GDP is used as the cost indicator, strategies with more Euro funding have lower cost and lower associated risk. The cost advantage reflects the relatively higher interest rates in RON while the risk differential responds to the fact that domestic interest rates are significantly more volatile. However, if the analysis centers on the stocks, foreign currency risk dominates and increasing the share of the EUR leaves the portfolio more exposed to a potential correction of the RON.
In any case, a strategy leaning too much towards addressing T-bills refinancing risk with Euro denominated securities runs counter to the need of issuing treasury bills in order to manage the liquidity and developa reliable domestic market that protects the government against sudden stops in the capital flows and to protect the government finances from the risk of a fall in the RON.
Composition of the foreign currency portfolio: The results of cashflow simulations indicate a clear preference for borrowing in EUR over USD. The quantitative analysis shows that at the current and implied forward yield curves, USD financing adds both to the portfolio cost and risk compared to EUR financing. This reflects higher interest rates in USD and a USD/RON rate significanly more volatile than EUR/RON.
On the other hand, the more liquid USD market allows Romania placements up to 30 years. This added to the diversification of the investor base are strong arguments for keeping a presence in the USD market. In the near future, the government plans to take advantage of these benefits hedging the exposure to the USD by using currency swaps. Access to derivative instruments (currency swaps) will provide the authorities the opportunistic access to the USD markets while maintaining the main exposure in EUR. For an active and efficient public government debt management, the MoPF intends to use financial derivates (currency swaps and interest rate swaps) as hedging tools, as well as liabilities management operations (bond-exchange and buy-backs), based on prior consultation with the NBR, to coordinate the policy for government financing and cash management with monetary policy . In this respect the MoPF will create in the near future the methodological and technical framework to use these instruments.
In the end, the government favors a net financing more in local currency debt to contribute to domestic market development while pursuing a diversification of healthy
25
funding sources including an opportunistic access to the international capital markets in currencies other than the EUR. Decreasing gross financing needs on medium term, mainly driven by the refinancing of local currency debt, allows the use of more financing from domestic market and the authorities will continue promoting its development as explained in the Annex 1.
6.3. Strategic guidelines
The following principles shall guide the government funding decisions during the period 2014-2016:
1. Favoring a net financing in local currency to facilitate the development of the domestic debt market and to help mitigate foreign currency exposure.
2. Pursuing a smooth redemption profile, especially in the local currency and domestic debt portfolios avoiding to the extent possible the concentration of repayments in the short-term.
3. Mitigating refinancing risk by maintaining a foreign currency buffer and contracting credit lines when their conditions are judged favorable for the government debt portfolio.
4. Maintaining the exposure to interest rate risk under control by monitoring the share of domestic debt refixing within the next year and the average time to refix for the total portfolio.
5. Maintaining presence in the EUR market and access the USD market or other foreign currencies markets on an opportunistic basis, selecting the longest possible maturities bearing in mind the cost of extending maturity.
6. Gradually reducing the issuance of government securities denominated in euro in the domestic market while keeping a minimum outstanding that guarantee the liquidity of these bonds.
7. In the process of external financing, the foreign currency debt will be contracted mainly in EUR.
8. Continuation of the partnership with international financial institutions to benefit from their related financial products.
Next, these principles are translated as indicative targets for the key financial risk indicators that reflect the desired composition of the government debt portfolio.
Foreign currency risk:
1. Assuring net financing more from domestic sources28 and keeping the share of local currency debt in a 35% (minimum)-2950% This share shall gradually increase to protect the government against the risk of sudden stops and the reversal of capital flows taking into consideration the absorption capacity of the domestic debt market and its cost.
2. Mantaining the ratio of euro denominated debt over total foreign currency debt in the 75% (minimum) -90% corridor.
Refinancing risk
28
50% of deficit financed from domestic sources in 2014, 60% in 2015 and 70% in 2016.
29
26
1. Keeping the share of debt maturing within one year in the 25% - 35% (maximum) range for the local currency debt and 10%-20% (maximum) for the total debt. 2. Maintaining ATM in the range of 2.5years (minimum) -4.5 years for local currency
debt and 4.5years (minimum) -6.5 years for total debt.
3. Maintaining a foreign currency buffer30 of four months of financing needs and, providing pre-financing when the conditions of financial markets allow contracting debt to cover in advance the financing needs for maintaining the foreign currency buffer at a comfortable level.
Interest rate risk
1. Keeping the share of debt re-fixing its interest rate within one year in a 25%-35% ( maximum) range for the local currency debt and 20%-30% (maximum) for the total debt.
2. Maintaining ATR in a 2.5 years (minimum) -4.5 years range for local currency debt and 4 years (minimum) -6 years for total debt.
Table 9: Targets for key risk indicators
Risk exposure Indicator Indicative range
Currency risk Share of domestic currency debt in total (% of total) Share of EUR denominate debt in foreign currency denominated debt (% of total)
35% (minimum) - 50% 75 % (minimum) - 90 % Refinancing risk Debt maturing in 1 year (% of total)
Local currency debt maturing in 1 year (% of total) ATM for total debt (years)
ATM for local currency debt (years)
10% - 20% (maximum) 25% - 35% (maximum) 4.5% (minimum) – 6.5 years 2.5% (minimum) -4.5 years Interest rate risk Debt re-fixing in 1 year (% of total)
Local currency debt re-fixing in 1 year (% of total) ATR for total debt (years)
ATR for local currency debt (years)
20 %30% (maximum)- 25 % - 35% (maximum)
4.0 years (minimum) – 6.0 years 2.5 years (minimum)– 4.5 years
The implementation of the Strategy 2014-2016 will be monitored monthly by following the debt indicators are in line with targets set and they will be published in the Monthly Bulletin of MoPF on its website. According to the Government Emergency Ordinance no. 64/2007 on public debt, as amended and supplemented, the strategy will be review annually or whenever market conditions and/or financing needs require.
30
27
Annex 1
Development of the domestic market of government securities
The medium-term strategic objectives for the development of the domestic market of government securities aim at increasing its efficiency through improving its liquidity, transparency and the consolidation of the yield curve. To achieve the above-mentioned objectives the MoPF has planned a set of actions, some of which will be implemented in the short-term as follows:
1. Increase the efficiency of the government securities market:
1.1. Consolidate and extend the yield curve on the domestic market of government securities:
1.1.1. Define a policy for the creation and maintenance of benchmark securities as main financing instrument on the domestic market;
1.1.2. Use liability management operations to accelerate the creation of benchmark securities (based on prior consultation with the NBR, to coordinate the policy for government financing and cash management with monetary policy) while tackling the refinancing risk and supporting the implementation of the debt management strategy;
1.1.3. Issue of 3month T-bills for cash management purposes, as well as futher issuace of 6 and 12 month T-bills;
1.1.4. Tighten the primary dealers rights and obligations to increase
competitiveness in the primary market. 1.2. Diversify and expand the investor base:
1.3. Analyze the opportunity of issuing new debt instruments required by market participants (like index bond), as well as specific instruments for the population, with the purpose of enlarging the investor base, supporting the market of government securities and promoting the long term saving.
1.4. Explore the opportunity to reduce the individual nominal value of government securities, to ensure the widest access to these instruments by small retail investors.
2. The measures to increase the liquidity of government securities market:
2.1. The introduction of an electronic platform for the supply of firm quotations in the secondary market in order to monitor primary dealers’ compliance with secondary market requirements designed to improve the liquidity and price disclosure/ transparency and to reduce risks associated with trading activity; 2.2. Concentrate the liquidity of government securities in a small number of
benchmarks with amounts equivalent of Euros 1.5- 2.0 billion, for each issuance, according to their maturity;
2.3. Use bond-exchange or buy-back operations to reduce the refinancing risk and build up the liquid benchmark bonds;
28
2.4. Direct sell/buy back operations conducted by MoPF on the secondary market with the purpose of increasing liquidity and to help MoPF implementing the debt management strategy;
2.5. Conduct reverse repos and securities lending for cash management purposes and to support the activity of the market makers, based on prior consultation with the NBR, to coordinate the policy for government financing and cash management with monetary policy;
3. The measures under consideration to increase the transparency and predictability
of the government securities market include:
3.1. Transparent issuance policy by publishing annually and quarterly issuance calendar and monthly prospectus, and, where appropriate, presenting flexibly and timely the modifications due to the changes in market conditions;
3.2. Continuous dialogue with the participants to the domestic market to ensure timely communication of the actions under consideration by MoPF;
3.3. Regular publication on www.mfinante.ro and www.mbuget.ro of information relevant to investors in terms of debt amount and composition;
3.4. Manage Bloomberg page dedicated to MoFP taking into account the broaden use of it by the majority of internal and international investors.
29
Annex 2
Improvement policy on cash management and measures to be taken
The Ministry of Public Finance is receiving technical assistance financed with EU funds and implemented with support of the World Bank to bring the debt and cash management practices in line with those of other EU countries.
Based on the recommendations under WB TA project, in order to improve cash management the MoPF is aiming to implement the following measures:
1. strengthening the institutional framework for a better coordination of cash and debt management process by establishing a committee structure within MPF, as well as a better coordination of the public government debt management process and cash management by using liability management operations (buy backs and bond exchanges) to accelerate the construction of benchmark securities and facilitate the refinancing of large benchmarks coming due and reverse repo operations for an effective management of the Ministry’s cash balances;
2. further developing of State Treasury’s cash flow forecasting by extending the daily cash flow forecast from one month to three months and improving the co-operation with other entities for their supplying forecast information;
3 moving to a more active cash management to reduce fluctuations in cash balances, both issuing shorter –term T-bills and by managing directly the excess current balances, either in the form of term deposits or preferable reverse repos. The first steps are to issue shorter-term T-bills, initially 3-months T-bills, and to be more active in the investment of cash surpluses, in particular via reverse repo31, based on prior consultation with the NBR, to coordinate the policy for government financing and cash management with monetary policy. The introduction of shorter-term T-bills will be done in a way that does not undermine the debt management strategy, especially the key objective of which is to lengthen the average maturity of the liability portfolio. Thus, short-term T-bills will be introduced only:
a) in the context of a lengthening of maturity of the aggregate debt portfolio;
b) after market consultations concerning the government’s intentions to issue such T-bills.
The loans from the availabilities of state treasury accounts in amount of lei 19.2 billion at end-2013 were contracted in accordance with the Government Emergency Ordinance 146/2002 on the formation and use of the resources going through the State Treasury, as subsequently amended, which allows the use of the funds available in the State Treasury Current Account to finance, through temporary borrowings, budget deficits from previous years. The borrowings on the temporary available funds in the State Treasury General Current Account used to finance the previous years’
31
The repo (or “repurchase”) market is not currently well developed; but market participants are near to agreeing a common approach and documentation. Repo has the advantage that it is easy to execute, automatically collateralized, and will contribute to money market activity.
30
state budget deficits accumulated mainly as a consequence of the lack of government securities issued on the domestic market by the MFP, from September 2005 until and including December 2006.
Despite of the advantage of using this instrument, such as the low-cost financing of the state budget deficit, since the interest rate of these borrowings was around 1% per year in 2013 this instrument has a number of disadvantages as well, like:
- it is an atypical instrument, as other European Treasuries use the state loans/government securities to integrally finance the budget deficits, with the liquidity surpluses placed in cash management instruments;
- depends on the funds available in the account, and in case of low available funds other solutions are used, such as attracting market deposits from credit institutions or selling the hard currency proceeds available in the foreign currency buffer.
Consequently, the reliance on this debt instrument brings uncertainty and refinancing risk (even no deadline for repaid this borrowing is established) impacting negatively on the government public debt management. A very important fact is that currently the funds available in the State Treasury General Current Account include also the privatization receipts in lei, and the more these revenues are used, the less the funds available in this account. Therefore the intention is to gradually refinance this instrument by issuing government securities, during a long time period (6 years) in order to reduce the impact on the domestic market and limiting the impact on the cost of financing.