Agilent Technologies
ESA Spectrum Analyzers
This guide documents firmware revision A.05.xx
Manufacturing Part Number: E4401-90189
Supersedes E4401-90174 Includes changes documented in E4401-90254 Printed in USA
August 2000
© Copyright 2000 Agilent Technologies
This manual provides documentation for the following instruments:
Agilent Technologies ESA-E Series
Agilent Technologies ESA-L Series
and
E4401B (9 kHz–1.5 GHz) E4402B (9 kHz–3.0 GHz) E4404B (9 kHz–6.7 GHz) E4405B (9 kHz–13.2 GHz) E4407B (9 kHz–26.5 GHz)
E4411B (9 kHz–1.5 GHz) E4403B (9 kHz–3.0 GHz) E4408B (9 kHz–26.5 GHz)
ii
Agilent Technologies makes no warranty of any kind with regard to this material, including but not limited to, the implied warranties of
merchantability and fitness for a particular purpose. Agilent Technologies shall not be liable for errors contained herein or for incidental or consequential damages in connection with the furnishing, performance, or use of this material.
The following safety symbols are used throughout this manual. Familiarize yourself with the symbols and their meaning before operating this instrument.
WARNING Warning denotes a hazard. It calls attention to a procedure which, if not correctly performed or adhered to, could result in injury or loss of life. Do not proceed beyond a warning note until the indicated conditions are fully understood and met.
CAUTION Caution denotes a hazard. It calls attention to a procedure that, if not correctly performed or adhered to, could result in damage to or
destruction of the instrument. Do not proceed beyond a caution sign until the indicated conditions are fully understood and met.
NOTE Note calls out special information for the user’s attention. It provides operational information or additional instructions of which the user should be aware.
The instruction documentation symbol. The product is marked with this symbol when it is necessary for the user to refer to the instructions in the documentation. This symbol is used to mark the on position of the power line switch.
This symbol is used to mark the standby position of the power line switch.
This symbol indicates that the input power required is AC.
WARNING This is a Safety Class 1 Product (provided with a protective earthing ground incorporated in the power cord). The mains plug shall only be inserted in a socket outlet provided with a protected earth contact. Any interruption of the protective conductor inside or outside of the product is likely to make the product dangerous. Intentional interruption is prohibited.
intact) only.
Warranty
This Agilent Technologies instrument product is warranted against defects in material and workmanship for a period of three years from date of shipment. During the warranty period, Agilent Technologies will, at its option, either repair or replace products which prove to be defective.
For warranty service or repair, this product must be returned to a service facility designated by Agilent Technologies. Buyer shall prepay shipping charges to Agilent Technologies and Agilent Technologies shall pay shipping charges to return the product to Buyer. However, Buyer shall pay all shipping charges, duties, and taxes for products returned to Agilent Technologies from another country.
Agilent Technologies warrants that its software and firmware designated by Agilent Technologies for use with an instrument will execute its programming instructions when properly installed on that instrument. Agilent Technologies does not warrant that the operation of the instrument, or software, or firmware will be uninterrupted or error-free.
LIMITATION OF WARRANTY
The foregoing warranty shall not apply to defects resulting from improper or inadequate maintenance by Buyer, Buyer-supplied
software or interfacing, unauthorized modification or misuse, operation outside of the environmental specifications for the product, or improper site preparation or maintenance.
NO OTHER WARRANTY IS EXPRESSED OR IMPLIED. AGILENT TECHNOLOGIES SPECIFICALLY DISCLAIMS THE IMPLIED WARRANTIES OF MERCHANTABILITY AND FITNESS FOR A PARTICULAR PURPOSE.
iv
EXCLUSIVE REMEDIES. AGILENT TECHNOLOGIES SHALL NOT BE LIABLE FOR ANY DIRECT, INDIRECT, SPECIAL, INCIDENTAL, OR CONSEQUENTIAL DAMAGES, WHETHER BASED ON
CONTRACT, TORT, OR ANY OTHER LEGAL THEORY.
Where to Find the Latest Information
Documentation is updated periodically. For the latest information about Agilent Technologies ESA Spectrum Analyzers, including firmware upgrades and application information, please visit the following Internet URL:
1. Preparing for Use
Initial Inspection . . . 1-2
Power Requirements . . . 1-4
Checking the Fuse . . . 1-4
AC Power Cable . . . 1-5
Preparation . . . 1-7
Turning On the Analyzer for the First Time . . . 1-8
2. Getting Started
What You Will Find in This Chapter . . . 2-2
Front-Panel Features . . . 2-3
Rear-Panel Features . . . 2-8
Display Annotation . . . 2-13
Key Overview . . . 2-18
Making a Measurement . . . 2-20
Measurement Summary . . . 2-22
Analyzer Accuracy and the Internal Alignment Process . . . 2-24
Warm-up Time . . . 2-24
File Menu Functions . . . 2-25
Locate and view files in the catalog . . . 2-25
Creating a directory . . . 2-27
Format a Floppy Disk . . . 2-28
Save a File . . . 2-29
Load a file . . . 2-33
Rename a File . . . 2-35
Copy a File . . . 2-36
Delete a File . . . 2-37
Printer Setup and Operation . . . 2-38
Equipment . . . 2-38
Interconnection and Setup . . . 2-38
Testing Printer Operation . . . 2-40
Analyzer Battery Information . . . 2-41
3. Functional Testing
What You Will Find in This Chapter . . . 3-2
What Are the Functional Tests? . . . 3-2
Functional Test Versus Performance Verification . . . 3-2
Test Descriptions . . . 3-3
Displayed Average Noise Level . . . 3-4
Test Limits . . . 3-4
Test Description . . . 3-5
Required Equipment . . . 3-5
vi
Procedure (10 MHz to 500 MHz) E4401B and E4411B . . . 3-6
Procedure (501 MHz to 1.0 GHz) E4401B and E4411B . . . 3-7
Procedure (1.01 GHz to 1.5 GHz) E4401B and E4411B . . . 3-9
Procedure (10 MHz to 1 GHz) E4402B, E4403B, E4404B, E4405B, E4407B, E4408B . .
3-10
Procedure (1.01 GHz to 2 GHz) E4402B, E4403B, E4404B, E4405B, E4407B, E4408B .
3-11
Procedure (2.01 GHz to 3.0 GHz) E4402B, E4403B, E4404B, E4405B, E4407B, E4408B
3-12
Procedure (3.01 GHz to 6.0 GHz) E4404B, E4405B, E4407B, E4408B . . . 3-14
Procedure (6.01 GHz to 6.7 GHz) E4404B . . . 3-15
Procedure (6.01 GHz to 12.0 GHz) E4405B, E4407B, E4408B . . . 3-16
Procedure (12.01 GHz to 13.2 GHz) E4405B . . . 3-17
Procedure (12.01 GHz to 22 GHz) E4407B and E4408B . . . 3-19
Procedure (22.01 GHz to 26.5 GHz) E4407B and E4408B . . . 3-20
Frequency Readout Accuracy . . . 3-23
Test Limits . . . 3-23
Test Description . . . 3-23
Required Equipment . . . 3-23
Procedure . . . 3-24
Marker Count Accuracy . . . 3-26
Procedure . . . 3-26
Frequency Response . . . 3-27
Test Limits . . . 3-27
Test Description . . . 3-27
Required Equipment . . . 3-28
Procedure . . . 3-29
Reference Level Accuracy . . . 3-32
Test Limits . . . 3-32
Test Description . . . 3-32
Required Equipment . . . 3-33
Log Mode Procedure . . . 3-34
Linear Mode Procedure . . . 3-35
Resolution Bandwidth Switching Uncertainty . . . 3-37
Test Limits . . . 3-37
Test Description . . . 3-37
Required Equipment . . . 3-38
Procedure . . . 3-38
Scale Fidelity . . . 3-40
Test Limits . . . 3-40
Test Description . . . 3-40
Required Equipment . . . 3-40
Procedure . . . 3-41
Second Harmonic Spurious Responses . . . 3-43
Test Limits . . . 3-43
Test Description . . . 3-43
Required Equipment . . . 3-44
Procedure . . . 3-45
Tracking Generator Level Flatness: HP E4401B and E4411B, Options 1DN and 1DQ . 3-46
Test Limits . . . 3-46
Test Description . . . 3-46
Required Equipment . . . 3-46
Procedure . . . 3-47
Tracking Generator Level Flatness: E4402B, E4403B, E4404B, E4405B, E4407B and
E4408B, Option 1DN . . . 3-49
Test Limits . . . 3-49
Test Description . . . 3-49
Required Equipment . . . 3-49
Procedure . . . 3-50
4. Troubleshooting
What You Will Find in This Chapter . . . 4-2
Before You Call Agilent Technologies . . . 4-3
Check the Basics . . . 4-3
Read the Warranty . . . 4-4
Service Options . . . 4-4
How to Contact Agilent Technologies . . . 4-5
How to Return Your Analyzer for Service . . . 4-7
Service Tag . . . 4-7
Original Packaging . . . 4-7
Other Packaging . . . 4-9
Error Messages . . . 4-10
Status Messages . . . 4-11
Informational Messages . . . 4-16
Error Queues . . . 4-21
Error Message Format . . . 4-22
Error Message Types . . . 4-23
0:
No Error . . . 4-25
–499 to –400:
Query Errors . . . 4-26
–399 to –300:
Device-Specific Error Messages . . . 4-28
Device-Specific Error Message Descriptions . . . 4-28
viii
–299 to –200:
Execution Error Messages . . . 4-29
Execution Error Message Descriptions . . . 4-29
–199 to –100:
Command Errors . . . 4-30
201 to 799:
Device-Specific Errors . . . 4-35
Greater than 1000:
Personality Specific Error Messages . . . 4-45
5. Menu Maps
What You Will Find in This Chapter . . . 5-2
6. Front-Panel Key Reference
AMPLITUDE Y Scale . . . 6-8
Auto Couple . . . 6-13
BW/Avg . . . 6-14
Det/Demod . . . 6-17
Display . . . 6-19
Enter . . . 6-25
Esc . . . 6-26
File . . . 6-27
Freq Count . . . 6-36
FREQUENCY Channel . . . 6-37
Help . . . 6-39
Input/Output . . . 6-40
Marker . . . 6-44
Marker
→ . . . 6−49Meas Control . . . 6-50
Meas Setup . . . 6-51
MEASURE . . . 6-54
MODE . . . 6-57
MODE SETUP . . . 6-58
Next Window . . . 6-59
Peak Search . . . 6-60
Preset . . . 6-65
Print . . . 6-69
Print Setup . . . 6-70
Restart . . . 6-72
Return . . . 6-73
Save . . . 6-74
Single . . . 6-75
Source . . . 6-76
SPAN X Scale . . . 6-78
Standby . . . 6-82
Sweep . . . 6-83
System (Local) . . . 6-92
Trig . . . 6-100
Viewing Angle . . . 6-104
View/Trace . . . 6-105
Zoom . . . 6-108
7. Options and Accessories
Options . . . 7-4
How to Order Options . . . 7-5
Delete Manual Set (Option 0B0) . . . 7-5
Additional Manual Set (Option 0B1) . . . 7-5
Component Level Service Documentation (Option 0BV) . . . 7-5
Service Documentation and Adjustment Software
(Option 0BW) . . . 7-5
RS-232 and Parallel Interface (Option 1AX) . . . 7-5
Rack Mount Kit With Handles (Option 1CP) . . . 7-6
High Stability Frequency Reference (Option 1D5) . . . 7-6
Time-Gated Spectrum Analysis (Option 1D6) . . . 7-6
50
Ωto 75
ΩMatching Pad (Option 1D7) . . . 7-6
50
ΩTracking Generator (Option 1DN) . . . 7-6
75
ΩInput Impedance (Option 1DP) . . . 7-6
Narrow Resolution Bandwidth (Option 1DR) . . . 7-7
75
ΩTracking Generator (Option 1DQ) . . . 7-7
Pre-amplifier (Option 1DS) . . . 7-7
GPIB and Parallel Interface (Option A4H) . . . 7-7
IF, Sweep and Video Ports (Option A4J) . . . 7-7
12 Vdc Power Cable (Option A5D) . . . 7-8
Hard Transit Case (Option AXT) . . . 7-8
Operating and Carrying Cases (Option AYT/AYU) . . . 7-8
Fast Digitized Time Domain Sweeps (Option AYX) . . . 7-8
External Mixing (Option AYZ) . . . 7-9
Benchlink Spectrum Analyzer (Option B70) . . . 7-9
Enhanced Memory Upgrade (Option B72) . . . 7-9
RF and Digital Communications Hardware
(Option B74) . . . 7-9
Performance Bundle (Option B75) . . . 7-9
TV Trigger and Picture on Screen (Option B7B) . . . 7-10
Digital Signal Processing and Fast ADC (Option B7D) . . . 7-10
x
RF Communications Hardware (Option B7E) . . . 7-10
Distance to Fault Accessory Kit (Option B7K) . . . 7-10
FM Demodulation (Option BAA) . . . 7-10
APC 3.5 Input Connector (Option BAB) . . . 7-11
cdmaOne Measurement Personality (Option BAC) . . . 7-11
GSM Measurement Personality (Option BAH) . . . 7-11
Firmware Upgrade Kit (Option UE2) . . . 7-11
Commercial Calibration with Test Data
(Option UK6) . . . 7-11
Front Panel Protective Cover (Option UK9) . . . 7-12
Low Frequency Extension (Option UKB) . . . 7-12
3 Year Calibration Contract (Option W32) . . . 7-12
5 Year Service Support (Option W50) . . . 7-12
5 Year Calibration Contract (Option W52) . . . 7-12
Accessories . . . 7-13
RF and Transient Limiters . . . 7-13
50
Ω/75
ΩMinimum Loss Pad . . . 7-13
75
ΩMatching Transformer . . . 7-13
RF Bridges . . . 7-13
HP/Agilent E1779A Battery Pack . . . 7-14
HP/Agilent N2717A Performance Verification Software . . . 7-14
AC Probe . . . 7-14
Broadband Preamplifiers and Power Amplifiers . . . 7-14
External Keyboard . . . 7-15
GPIB Cable . . . 7-15
Parallel Interface Cable . . . 7-15
Printer . . . 7-15
RS-232 Cable . . . 7-15
Carrying Strap (Part Number E4411-60028) . . . 7-15
HP/Agilent 11970 Series Harmonic Mixers . . . 7-16
HP/Agilent 11974 Series Preselected Millimeter Mixers . . . 7-16
This chapter provides information on how to inspect your analyzer when it arrives and what to expect when it is first powered on. It also includes the analyzer power requirements.
1-2 Chapter 1
Initial Inspection
Inspect the shipping container and verify that the contents are complete. Keep the container and cushioning material until you have inspected the analyzer.
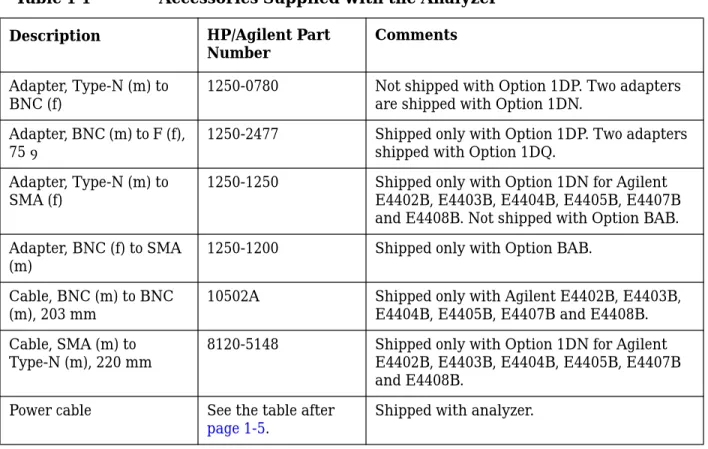
Table 1-1 contains the accessories shipped with the analyzer. If the contents are incomplete, or the analyzer does not pass the performance tests, notify the nearest Agilent Technologies office. If the shipping container is damaged or the cushioning material shows signs of stress, also notify the carrier. Keep the shipping materials for the carrier’s inspection. The Agilent office will arrange for repair or replacement without waiting for a claim settlement.
If the shipping materials are in good condition, retain them for possible future use. You may wish to ship the analyzer to another location or to return it to Agilent Technologies for service. See“How to Return Your Analyzer for Service” in Chapter 4for more information about shipping materials.
If cleaning is necessary, use a damp cloth only.
WARNING To prevent electrical shock, disconnect the analyzer mains before cleaning. Use a dry cloth or one slightly dampened with water to clean the external case parts. Do not attempt to clean internally.
Table 1-1 Accessories Supplied with the Analyzer
Description HP/Agilent Part
Number
Comments
Adapter, Type-N (m) to BNC (f)
1250-0780 Not shipped with Option 1DP. Two adapters are shipped with Option 1DN.
Adapter, BNC (m) to F (f), 75Ω
1250-2477 Shipped only with Option 1DP. Two adapters shipped with Option 1DQ.
Adapter, Type-N (m) to SMA (f)
1250-1250 Shipped only with Option 1DN for Agilent E4402B, E4403B, E4404B, E4405B, E4407B and E4408B. Not shipped with Option BAB. Adapter, BNC (f) to SMA
(m)
1250-1200 Shipped only with Option BAB.
Cable, BNC (m) to BNC (m), 203 mm
10502A Shipped only with Agilent E4402B, E4403B, E4404B, E4405B, E4407B and E4408B. Cable, SMA (m) to
Type-N (m), 220 mm
8120-5148 Shipped only with Option 1DN for Agilent E4402B, E4403B, E4404B, E4405B, E4407B and E4408B.
Power cable See the table after
page 1-5.
1-4 Chapter 1
Power Requirements
The analyzer is a portable instrument and requires no physical installation other than connection to a power source. There is no need to select a line voltage.
Checking the Fuse
Where IEC regulations apply, use a 5 by 20 mm, rated F5A, 250 V IEC approved fuse. This fuse may be used with input line voltages of 115 V or 230 V. Its part number is 2110-0709.
Where UL/CSA regulations apply, use a 5 by 20 mm rated fast blow, 5 A, 125 V UL/CSA approved fuse (part number 2110-0756). This fuse may only be used with an input line voltage of 115 V.
The line fuse is housed in a fuse holder in the upper left hand corner of the rear panel.
To remove the fuse, first disconnect the power cord from the instrument. Then insert the tip of a screwdriver into the slot at the middle of the fuse holder, and turn counterclockwise to extend the fuse holder.
WARNING For continued protection against fire hazard, replace the line fuse only with the same type and rating. The use of other fuses or material is prohibited.
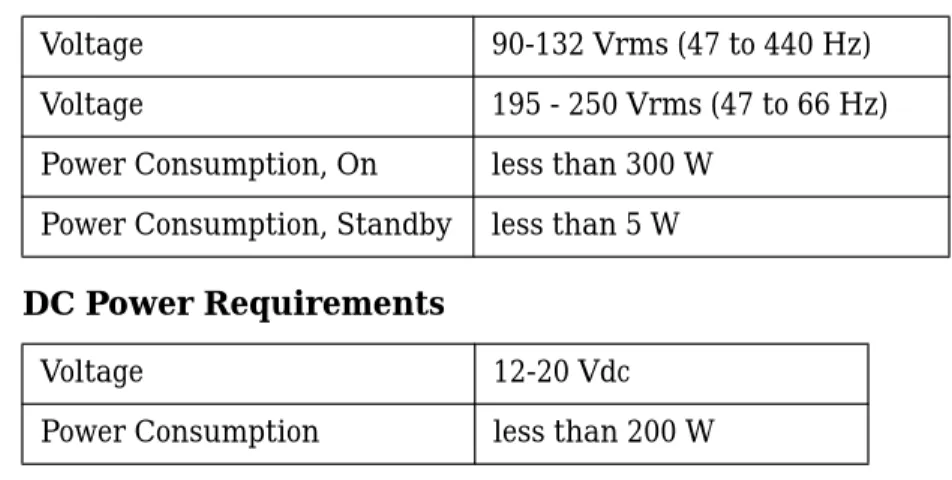
Table 1-2 AC Power Requirements
Voltage 90-132 Vrms (47 to 440 Hz) Voltage 195 - 250 Vrms (47 to 66 Hz) Power Consumption, On less than 300 W
Power Consumption, Standby less than 5 W
Table 1-3 DC Power Requirements
Voltage 12-20 Vdc
AC Power Cable
The analyzer is equipped with a three-wire power cable, in accordance with international safety standards. When connected to an appropriate power line outlet, this cable grounds the instrument cabinet.
WARNING Failure to ground the analyzer properly can result in personal injury. Before turning on the analyzer, you must connect its protective earth terminals to the protective conductor of the main power cable. Insert the main power cable plug only into a socket outlet that has a protective earth contact. DO NOT defeat the earth-grounding protection by using an extension cable, power cable, or autotransformer without a protective ground conductor.
If you are using an autotransformer, make sure its common terminal is connected to the protective earth contact of the power source outlet socket.
Various power cables are available to connect the analyzer to the types of ac power outlets unique to specific geographic areas. The cable appropriate for the area to which the analyzer is originally shipped is included with the unit. You can order additional AC power cables for use in different areas. The following table lists the available ac power cables, illustrates the plug configurations, and identifies the geographic area in which each cable is appropriate.
Preparation
WARNING If this product is to be energized via an external
autotransformer for voltage reduction, make sure that its common terminal is connected to a neutral (earthed pole) of the power supply.
CAUTION This instrument has autoranging line voltage input. Be sure the supply voltage is within the specified range. (Refer to the Agilent Technologies ESA Spectrum Analyzer Specifications Guide.)
CAUTION Ventilation Requirements: When installing the product in a cabinet, the convection into and out of the product must not be restricted. The ambient temperature (outside the cabinet) must be less than the maximum operating temperature of the product by 4 ˚C for every 100 watts dissipated in the cabinet. If the total power dissipated in the cabinet is greater than 800 watts, then forced convection must be used.
NOTE Install the instrument so that the detachable power cord is readily identifiable and is easily reached by the operator. The detachable power cord is the instrument disconnecting device. It disconnects the mains circuits from the mains supply before other parts of the instrument. The front panel switch is only a standby switch and is not a LINE switch. Alternatively, an externally installed switch or circuit breaker (which is readily identifiable and is easily reached by the operator) may be used as a disconnecting device.
1-8 Chapter 1
Turning On the Analyzer for the First Time
Before using your analyzer, plug the power cord into the analyzer. Press | (the On key).
Choose a power on preference using the switch on the rear panel (refer toFigure 2-2 on page 2-8, item 14). ThePWR ALWAYS ONsetting turns the analyzer on whenever external power is applied. This mode is useful if an external power switch is used to control a rack of several instruments. ThePWR NORMsetting (factory default) assigns analyzer on/off control to the front-panel On key (seeFigure 2-1 on page 2-3, item 23); however if the external power is removed for > 20 seconds, the instrument returns to the Standby condition of the front-panel On key when external power is reconnected.
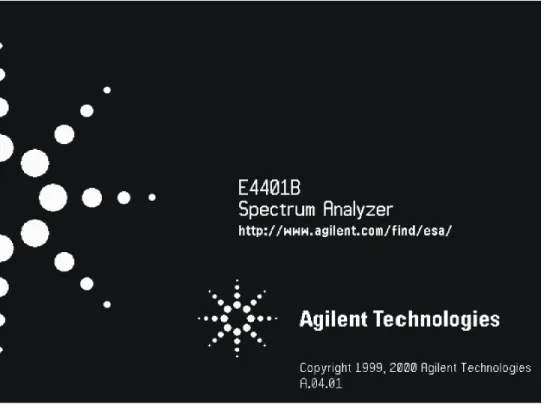
When you turn on the analyzer, the information screen as shown in Figure 1-1 will be displayed during initialization of the instrument.
NOTE This screen may be displayed for as long as 1 minute before the initialization process is complete.
Your analyzer product number, the firmware revision number (A.04.01), and a URL for accessing product support information on the World Wide Web are shown.
NOTE Record the firmware revision number and keep it for reference. If you should ever need to call Agilent Technologies for service or with any questions regarding your analyzer, it will be helpful to have the firmware revision number readily available. You can also obtain the firmware revision number by pressingSystem,More 1 of 3,Show System.
To ensure your analyzer meets specifications, it must meet operating temperature conditions. Allow a 5 minute warm-up before making calibrated measurements.
If the analyzer is an Agilent Technologies E4402B, E4403B, E4404B, E4405B, E4407B, or E4408B, connect a BNC cable from the AMPTD REF OUT to INPUT 50Ωusing an adapter. After a 5 minute warm-up, pressSystem,Alignments,Align Now,All.
NOTE It is normal to hear clicking when the Auto Alignment function is on. During the interval between sweeps, portions of the analyzer’s circuitry are realigned. Some of the circuitry is controlled by relays. It is the rapid switching of these relays between sweeps which causes the clicking sound. Under normal operation, these relays will last over 50 years.
To eliminate the clicking sound, turn off the automatic alignment. (See theAlignments key description inChapter 6 ,“Front-Panel Key
Reference.”) WithAuto Align turned off, however, the Align Now All function should be performed periodically. For more information on how often to perform Align Now All when the Auto Alignment function is off, refer to the appropriate “Specifications and Characteristics” chapter in the Agilent Technologies ESA Spectrum Analyzer Specifications Guide.
CAUTION When operating in DC coupled mode on spectrum analyzers with Option UKB, ensure protection of the input mixer by limiting the input level to 0 VDC, +30 dBm.
If you wish to use an external 10 MHz source as the reference
frequency, connect an external reference source to the10 MHz REF IN connector on the rear panel. The signal level should be greater than –15 dBm.
What You Will Find in This Chapter
This chapter introduces the basic functions of the analyzer. In this chapter you will:
• Get acquainted with the front-panel and rear-panel features. • Get acquainted with the function keys.
• Learn about display annotation.
• Make a basic measurement (using the internal alignment signal). • Learn about analyzer accuracy and the internal alignment process. • Learn about file menus.
• Set up your printer.
• Learn about the analyzer battery for retaining internal memory.
NOTE Before using your analyzer, please readChapter 1, “Preparing for Use” which describes how to set up your analyzer and how to verify that it is operational. It also describes many safety considerations that should not be overlooked.
Chapter 2 2-3
Front-Panel Features
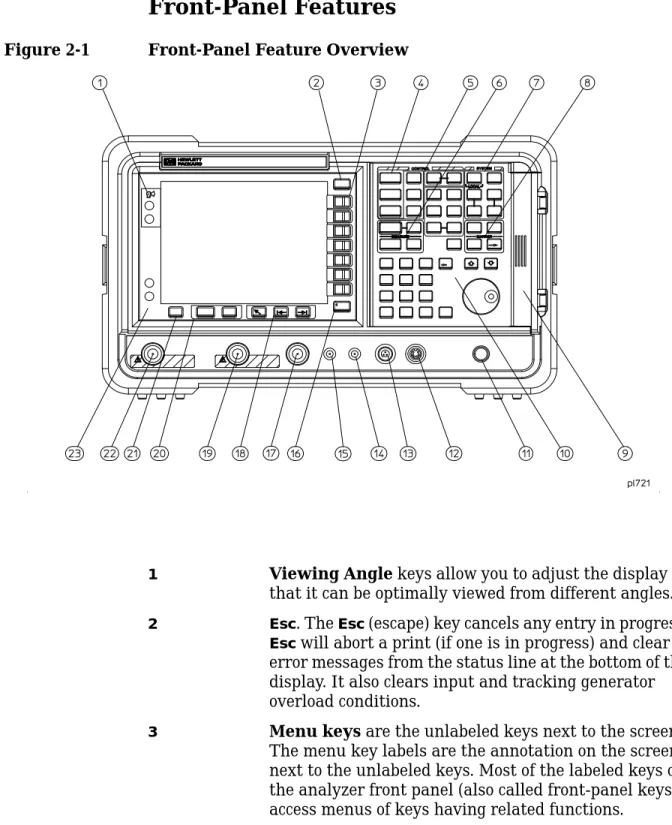
Figure 2-1 Front-Panel Feature Overview
1 Viewing Angle keys allow you to adjust the display so that it can be optimally viewed from different angles. 2 Esc. TheEsc(escape) key cancels any entry in progress.
Esc will abort a print (if one is in progress) and clear error messages from the status line at the bottom of the display. It also clears input and tracking generator overload conditions.
3 Menu keys are the unlabeled keys next to the screen. The menu key labels are the annotation on the screen next to the unlabeled keys. Most of the labeled keys on the analyzer front panel (also called front-panel keys) access menus of keys having related functions.
4 FREQUENCY Channel,SPAN X Scale, andAMPLITUDE Y Scaleare the three large keys that activate the primary analyzer functions and access menus of related
functions. The secondary labels on these keys (Channel, X Scale, and Y Scale) are used in some measurements. 5 CONTROL functions access menus that allow you to
adjust the resolution bandwidth, adjust the sweep time, and control the instrument display. They also set other analyzer parameters needed for making
measurements.
6 MEASUREaccesses a menu of keys that automate some common analyzer measurements. Once a measurement is running,Meas Setup accesses additional menu keys for defining your measurement.Meas Control and Restart access additional measurement control functions.
7 SYSTEM functions affect the state of the entire spectrum analyzer.
Various setup and alignment routines are accessed with theSystem key.
The greenPreset key resets the analyzer to a known state.
TheFile key menu allows you to save and load traces, states, limit-line tables, and amplitude correction factors to or from analyzer memory or the floppy disk drive. TheSavekey immediately executes theSave Now function defined underFile inChapter 6 ,“Front-Panel Key Reference.”
ThePrint Setup menu keys allow you to configure hardcopy outputs. ThePrintkey immediately sends hardcopy data to the printer. See Chapter 6 for more details.
8 MARKER functions control the markers, read out frequencies and amplitudes along the analyzer trace, automatically locate the signals of highest amplitude, and access functions likeMarker Noise andBand Power. 9 The Media Door on the right side of the front panel
accesses the 3.5 inch disk drive and the Earphone connector. The earphone connector provides a connection for an earphone jack which bypasses the internal speaker.
Chapter 2 2-5 10 The Data Control Keys, which include the step keys,
knob, and numeric keypad, allow you to change the numeric value of an active function.
Data control keys are used to change values for functions such as center frequency, start frequency, resolution bandwidth, and marker position.
The data controls will change the active function in a manner prescribed by that function. For example, you can change center frequency in fine steps with the knob, in discrete steps with the step keys, or to an exact (1 Hz resolution) value with the numeric keypad. The Knob provides fine incremental changes of
functions such as center frequency, reference level, and marker position. Clockwise rotation of the knob
increases values. The extent of alteration is determined by the size of the measurement range. The speed at which the knob is turned affects the rate at which the values are changed.
For slow sweeps, the analyzer uses a smooth panning feature which is designed to move the trace display to the latest function value as the knob is turned. When center, stop or, start frequency or reference level is adjusted, the signal will shift right or left or up or down with the rotation of the knob before a new sweep is actually taken. An asterisk is placed in the message block (the upper right-hand corner of the analyzer display) to indicate that the data on the screen does not reflect data at the current setting.
The Numeric Keypad allows entry of exact values for many of the analyzer functions. You may include a decimal point in the number portion. If not, the decimal point is placed at the end of the number.
Numeric entries must be terminated with a units key. When a numeric entry is begun, the menu keys show the units key labels. The units keys change depending on what the active function is. For example, the units keys for frequency span areGHz,MHz,kHz, andHz, whereas the units for reference level are+dBm,−dBm, mV, andµV.
NOTE If an entry from the numeric keypad does not coincide with an allowed function value (for example, that of a 12 MHz bandwidth), the analyzer defaults to the nearest allowable value.
The Step Keys (⇓ ⇑) increase or decrease the active function value. The step size depends upon the current analyzer measurement. Each press results in a single step change. For those parameters with fixed values (resolution bandwidth), the next value in a sequence is selected each time a step key is pressed. Changes are predictable (10% of span for center frequency) and can be set for some functions (100 MHz for center
frequency). Out-of-range values or out-of-sequence values will not occur using these keys.
11 VOLUME. TheVOLUME knob adjusts the volume of the internal speaker. The speaker is turned on and off with theSpeaker On Off key in theDet/Demod menu.
12 EXT KEYBOARD.TheEXT KEYBOARD connector is a 6-pin mini-DIN connector. The keyboard can be used to enter screen titles and filenames.
NOTE To avoid damage to the analyzer, always turn off power before plugging a keyboard into the instrument.
13 PROBE POWER provides power for high-impedance AC probes or other accessories. (+15 V,−12.6 V, 150 mA max)
14 LO OUTPUT provides the proper local oscillator signal for use with external mixers (Option AYZ).
15 IF INPUT connects to the IF OUTPUT of the external mixer (Option AYZ).
16 Return. TheReturn key accesses the previously selected menu. Continuing to pressReturn accesses earlier menus.
17 AMPTD REF OUTprovides an amplitude reference signal of 50 MHz at –20 dBm. Agilent Technologies E4402B, E4403B, E4404B, E4405B, E4407B, and E4408B only. 18 Tab Keys are used to move around in the Limit editor
and the Correction editor.
19 INPUT 50Ω (INPUT 75Ωfor Option 1DP) is the signal input for the analyzer.
CAUTION When operating in DC coupled mode on spectrum analyzers with Option UKB, take care to protect the input mixer by limiting the input level to 0 VDC, +30 dBm.
Chapter 2 2-7 20 TheNext Window key can be used to select the active
window in functions which support split-screen display modes, such as Zone markers. (Refer to“Zone” in Chapter 6 for more information.) In such modes, pressingZoom allows you to switch between the
split-screen and full-sized display of the active window. 21 Help. Press theHelp key and then any front panel or
menu key to get a short description of the key function and the associated SCPI command. The next key you press will remove the help window from the display. 22 RF OUT 50Ω (for Option 1DN) orRF OUT 75Ω
(for Option 1DQ) is the source output for the built-in tracking generator. Option 1DN or 1DQ only.
CAUTION If the tracking generator output power is too high, it may damage the device under test. Do not exceed the maximum power that the device under test can tolerate.
23 The| (On) key turns the analyzer on, while the (Standby) key turns most of the analyzer off. An instrument alignment is performed (ifAuto Align is on) every time the analyzer is turned on. After turning on the analyzer, allow 5 minutes of warm-up time to ensure the analyzer will meet all specifications.
NOTE The instrument continues to draw power even if the line power switch is in standby. The detachable power cord is the instrument
disconnecting device. It disconnects the mains circuits from the mains supply before other parts of the instrument. The front-panel switch is only a standby switch and is not a LINE switch (disconnecting device).
Rear-Panel Features
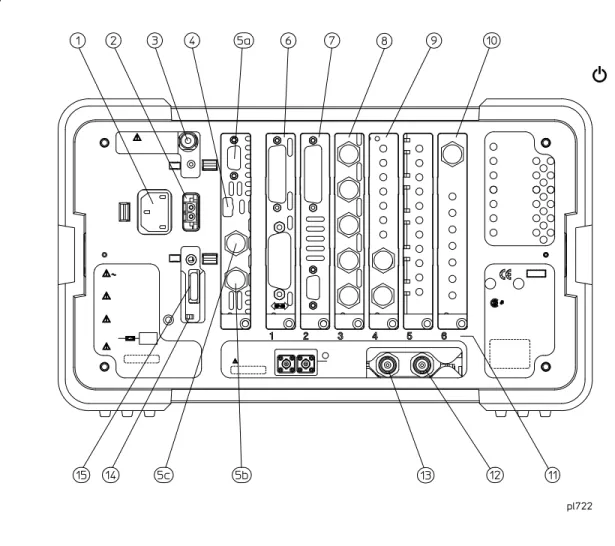
Figure 2-2 Rear-Panel Feature Overview
1 Power input is the input for the AC line power source. Make sure that the line-power source outlet has a protective ground contact.
2 DC Poweris the input for the DC power source. Refer to the “Power Requirements” section in the specifications chapter of the Agilent ESA Spectrum Analyzers
Calibration Guide.
CAUTION AC line power and DC power should not be plugged in simultaneously. 3 Line Fuse. The fuse is removed by twisting
counterclockwise 1/4 turn. Replace only with a fuse of the same rating. See the label on the rear panel.
Chapter 2 2-9 4 Service Connector. The service connector is for
service use only.
5 Inputs/Outputs (Refer to Agilent Technologies ESA Spectrum Analyzer Specifications Guide for more information.)
5a VGA OUTPUT drives an external VGA compatible monitor with a signal that has 31.5 kHz horizontal, 60 Hz vertical synchronizing rate, non-interlaced. 5b GATE/HI SWP OUT (TTL) is high when
the analyzer is sweeping or whenGate (Option 1D6) is active.
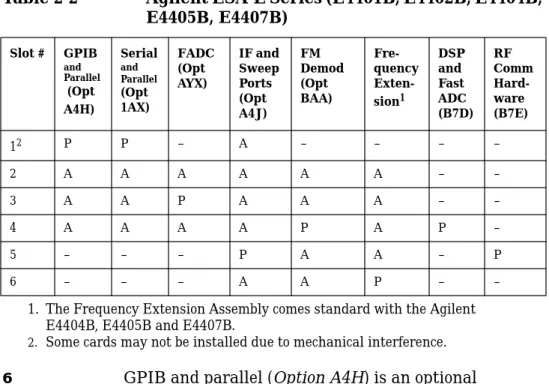
5c GATE TRIG/EXT TRIG IN (TTL)accepts the positive edge of an external voltage input that triggers the analyzer internal sweep source or the gate function (Time Gate, Option 1D6). Table 2-1andTable 2-2show the appropriate rear panel slots to be used for the optional cards available with the Agilent ESA spectrum
analyzers. Refer toTable 2-1 if you have an Agilent ESA-L Series spectrum analyzer. Refer toTable 2-2 if you have an Agilent ESA-E Series spectrum analyzer.
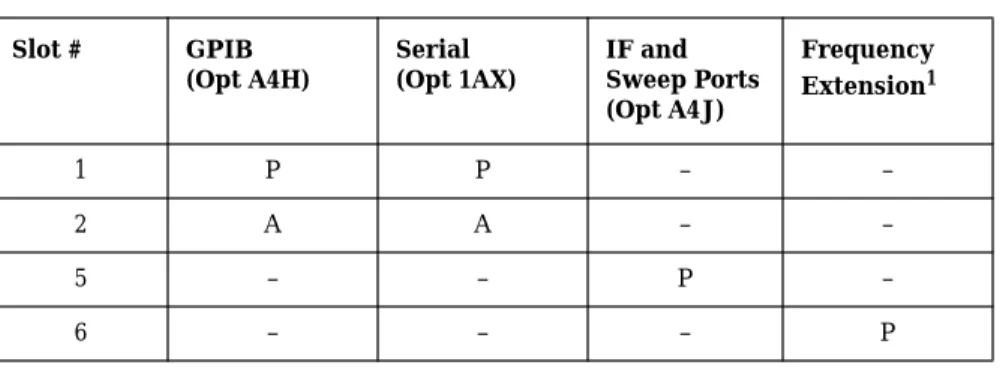
(P) = Preferred Card Slot (A) = Acceptable Card Slot (–) = Unacceptable Card Slot
Table 2-1 Agilent ESA-L Series (E4403B, E4408B, E4411B) Slot # GPIB
(Opt A4H) Serial (Opt 1AX) IF and Sweep Ports (Opt A4J) Frequency Extension1
1 P P – –
2 A A – –
5 – – P –
6 – – – P
1. The Frequency Extension Assembly comes standard with the Agilent E4408B.
6 GPIB and parallel (Option A4H) is an optional
interface. GPIB supports remote instrument operation. A parallel port is included for printing only.
7 RS-232 and parallel (Option 1AX) is an optional interface. RS-232 supports remote instrument
operation. A parallel port is included for printing only.
NOTE Printing is only supported from the parallel port.
NOTE Only one optional interface (Option A4H or Option 1AX) can be installed at a time.
8 IF, Video, and Sweep Ports (Option A4J or Option AYX): (Refer to Agilent Technologies ESA Spectrum Analyzer Specifications Guide for more information.) NOTE Only one IF and Sweep Port (Option A4J or Option AYX) can be
installed at a time.
SWP OUT provides a voltage ramp corresponding to the sweep of the analyzer (0 V to 10 V).
HI SWP IN (TTL) can be grounded to stop and reset the sweep.
HI SWP OUT (TTL) is high when the analyzer is sweeping.
Table 2-2 Agilent ESA-E Series (E4401B, E4402B, E4404B, E4405B, E4407B)
Slot # GPIB
and Parallel (Opt A4H) Serial and Parallel (Opt 1AX) FADC (Opt AYX) IF and Sweep Ports (Opt A4J) FM Demod (Opt BAA) Fre-quency Exten-sion1 DSP and Fast ADC (B7D) RF Comm Hard-ware (B7E)
12 P P – A – – – –
2 A A A A A A – –
3 A A P A A A – –
4 A A A A P A P –
5 – – – P A A – P
6 – – – A A P – –
1. The Frequency Extension Assembly comes standard with the Agilent E4404B, E4405B and E4407B.
Chapter 2 2-11 AUX VIDEO OUT provides detected video output (before the analog-to-digital conversion) proportional to vertical deflection of the trace. Output is from 0 V to 1 V. Amplitude-correction factors are not applied to this signal.
The output signal is blanked during retrace.
AUX IF OUT is a 50Ω, 21.4 MHz IF output that is the down-converted signal of the RF input of the analyzer. Amplitude-correction factors are not applied to this signal. This output is taken after the resolution bandwidth filters and step gains and before the log amplifier. The output signal is blanked during retrace. 9 FM Demod (Option BAA) allows you to demodulate,
display, and measure deviation on FM signals. You can listen to audio signals on a built-in speaker or with an earphone. Refer to“Det/Demod” in Chapter 6 and“FM Demodulation (Option BAA)” in Chapter 7 for more information about this option.
10 Frequency Extension Assembly controls the microwave front-end components in the Agilent E4404B, E4405B, E4407B and E4408B.
PRESEL TUNE OUTPUT provides a signal to control external preselected mixers (Option AYZ). Refer to “Det/Demod” in Chapter 6 or“FM Demodulation (Option BAA)” in Chapter 7for more information about this option.
11 Card Slot Identification Numbers. Refer toTable 2-1 andTable 2-2 for card slot versus option card compatibility information.
12 10 MHz REF IN accepts an external frequency source to provide the 10 MHz,−15 to +10 dBm as a timebase. 13 10 MHz REF OUT provides a 10 MHz, 0 dBm minimum,
timebase reference signal.
14 Power On Selection selects an instrument power preference. ThePWR ALWAYS ON setting turns the analyzer on whenever external power is applied. This mode is useful if an external power switch is used to control a rack of several instruments. ThePWR NORM setting assigns analyzer on/off control to the
front-panel On key (seeFigure 2-1 on page 2-3, item 23); however, if the external power is removed for >20 seconds, the instrument returns to the Standby condition of the front-panel On key when external power is reconnected.
15 DC Fuse protects the analyzer from drawing too much DC power. Replace only with a fuse of the same rating. See the label on the rear panel.
Chapter 2 2-13
Display Annotation
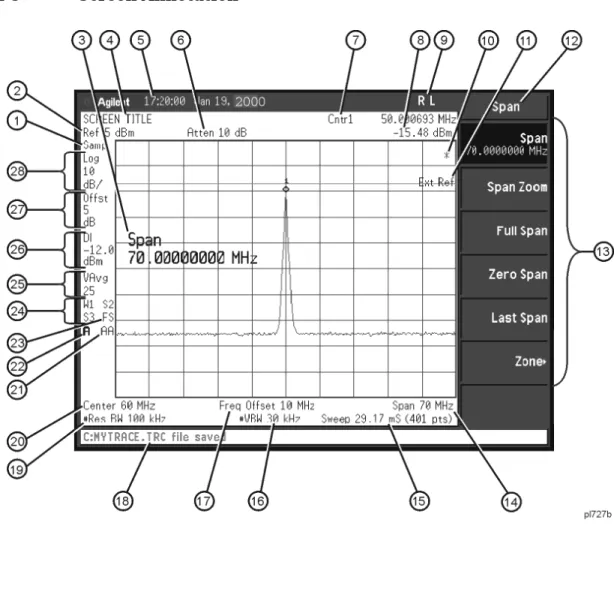
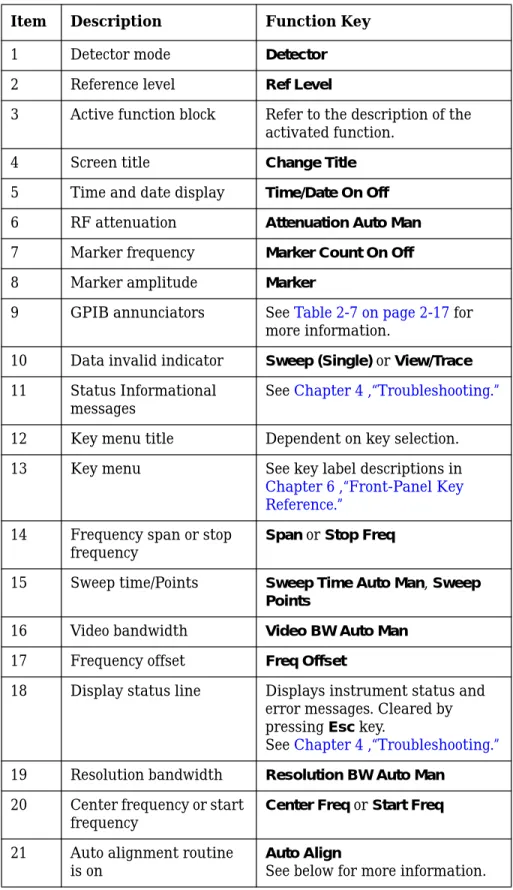
Here is an example of the annotation that may appear on an analyzer display. The display annotation is referenced by numbers which are listed in the following table. The Function Key column indicates which key activates the function related to the annotation. Refer to
Chapter 6 , “Front-Panel Key Reference” for more information on a specific function key.
Table 2-3 Screen Annotation
Item Description Function Key
1 Detector mode Detector
2 Reference level Ref Level
3 Active function block Refer to the description of the activated function.
4 Screen title Change Title
5 Time and date display Time/Date On Off
6 RF attenuation Attenuation Auto Man
7 Marker frequency Marker Count On Off
8 Marker amplitude Marker
9 GPIB annunciators SeeTable 2-7 on page 2-17 for more information.
10 Data invalid indicator Sweep (Single) orView/Trace
11 Status Informational messages
SeeChapter 4 ,“Troubleshooting.”
12 Key menu title Dependent on key selection. 13 Key menu See key label descriptions in
Chapter 6 ,“Front-Panel Key Reference.”
14 Frequency span or stop frequency
Span orStop Freq
15 Sweep time/Points Sweep Time Auto Man,Sweep Points
16 Video bandwidth Video BW Auto Man
17 Frequency offset Freq Offset
18 Display status line Displays instrument status and error messages. Cleared by pressingEsc key.
SeeChapter 4 ,“Troubleshooting.”
19 Resolution bandwidth Resolution BW Auto Man
20 Center frequency or start frequency
Center Freq or Start Freq
21 Auto alignment routine is on
Auto Align
Chapter 2 2-15 When the analyzer is set to the external mixer state (Option AYZ), item 6 changes to displayExt Mix in place ofAtten XdB. In addition, if Mixer Bias is on, a+I or–I is appended toExt Mix.
Item 10 refers to the data invalid indicator. When the(*) is displayed, it means that some or all trace data may not match the annotation due to possible changes in instrument settings.
Item 21 refers to the auto alignment mode.AA indicates that auto alignment of all analyzer parameters, except the tracking generator and FM demodulation options, will occur.AB indicates that auto
alignment of all analyzer functions except the RF section (and tracking generator and FM demodulation options) will occur. No indicator will appear if auto alignment is off.
Item 23 refers to the trigger and sweep modes of the analyzer. The first letterFindicates the spectrum analyzer is in free-run trigger mode. The second letterC indicates the spectrum analyzer is in continuous-sweep mode. Refer toTable 2-5 on page 2-16 for other valid annunciators for the first letter. Refer toTable 2-6 on page 2-16 for other valid
annunciators for the second letter.
22 Amplitude corrections are on (This indicates that the overall correction state is On. There may be any or none of the individual corrections On.)
Correction On Off
23 Trigger/Sweep Trig,Sweep
See below for more information.
24 Trace mode Trace
See below for more information.
25 Average Average On Off
VAvg indicates video average on.
PAvgindicates power average on. 26 Display line Display Line On Off
27 Amplitude offset Ref Lvl Offst
28 Amplitude scale Scale Type Log Lin Table 2-3 Screen Annotation
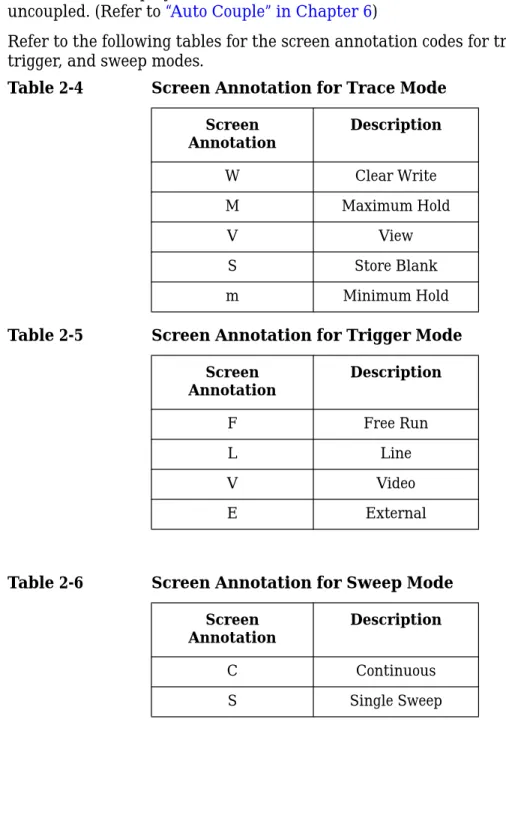
Item 24 refers to the trace modes of the analyzer. The first letterW indicates that the analyzer is in clear-write mode. The second letter is 1, representing trace 1. The trace 2 trace mode isS2, indicating trace 2 (2) is in the store-blank mode (S). The trace mode annotation for trace 3 is displayed under the trace mode annotation of trace 1. The trace 3 trace mode isS3, indicating trace 3 (3) is in the store blank mode (S). Refer toTable 2-4 for other valid trace mode annunciators.
A # in front of display annotation indicates that the function is uncoupled. (Refer to“Auto Couple” in Chapter 6)
Refer to the following tables for the screen annotation codes for trace, trigger, and sweep modes.
Table 2-4 Screen Annotation for Trace Mode Screen
Annotation
Description
W Clear Write
M Maximum Hold
V View
S Store Blank
m Minimum Hold
Table 2-5 Screen Annotation for Trigger Mode Screen
Annotation
Description
F Free Run
L Line
V Video
E External
Table 2-6 Screen Annotation for Sweep Mode Screen
Annotation
Description
C Continuous
Chapter 2 2-17 Table 2-7 Screen Annotation for GPIB Annunciators
Screen Annotation
Description
R Remote Operation
L GPIB Listen
T GPIB Talk
Key Overview
The keys labeledFREQUENCY Channel,System, andMarker are all examples of front-panel keys. Pressing most front-panel keys accesses menus of functions that are displayed along the right side of the display. These are called menu keys.
Front-panel keys that are white perform an immediate action rather than bringing up a menu.
Menu keys list functions other than those accessed directly by the front panel keys. To activate a menu key function, press the key immediately to the right of the annotation on the screen. The menu keys that are displayed depend on which front-panel key is pressed and which menu level is enabled.
If a menu key function’s value can be changed, it is called an active function. The function label of the active function is highlighted after that key has been selected. For example, pressAMPLITUDE Y Scale. This calls up the menu of related amplitude functions. Note the function labeledRef Level (the default selected key in the Amplitude menu) is highlighted.Ref Level also appears in the active function block, indicating that it is the active amplitude function and can now be changed using any of the data entry controls.
A menu key with On and Off in its label can be used to turn the menu key’s function on or off. To turn the function on, press the menu key so that On is underlined. To turn the function off, press the menu key so that Off is underlined. In the manual, when On should be underlined, it will be indicated asFunction (On).
A function with Auto and Man in the label can either be auto-coupled or have its value manually changed. The value of the function can be changed manually using the numeric keypad, knob, or step keys. To auto-couple a function, press the menu key so that Auto is underlined. In the manual, whenAuto should be underlined, it will be indicated as Function (Auto).
In some menus of keys, one key label will always be highlighted to show which key has been selected. For example, when you pressDet/Demod, Demod, you will access a menu of keys in which some of the keys are grouped together by a blue bar (on analyzers with a color display) on the left side of the menu. TheOff key, which is theDet/Demod,Demod menu default key, will be highlighted. When you press another key within the blue bar region, such asAM, the highlight will move to that key to show it has been selected.
Chapter 2 2-19 In some menus of keys, one key label will always be highlighted to show which key has been selected but the menu is immediately exited when a selection is made. For example, when you press theOrientation key (a Print Setupmenu key), it will bring up its own menu of keys. ThePortrait key, which is the Orientation menu default key, will be highlighted. When you press theLandscape key, the highlight will move to that key to show it has been selected.
A summary of all front panel keys and their related menu keys can be found inChapter 6 ,“Front-Panel Key Reference.”
Making a Measurement
Let’s begin using the analyzer by measuring an input signal. Since the internal 50 MHz amplitude reference signal is readily available, we will use it as our test signal.
NOTE You cannot hurt the analyzer by using this reference signal and pressing any of the keys described in this section. Don’t be afraid to play with the knob, step keys, or numeric keypad. (If you have experimented with other keys and wish to return to a known state, press the greenPreset key and, if present, theFactory Preset menu key.)
1. First, turn the instrument on by pressingOn. Wait for the power-up process to complete.
2. PressSystem,Power On/Preset,Preset (Factory).
3. Press the greenPresetkey. Turn on the internal 50 MHz signal by pressingInput,Amptd Ref Out (f=50 MHz) (On) and connecting a cable from theAMPTD REF OUT to theINPUT 50Ω.
NOTE For the Agilent E4401B and E4411B, the above key label isAmptd Ref (f=50 MHz), and no cable is required.
4. Set the frequency.
Press theFREQUENCY Channel key.Center appears on the left side of the screen, indicating that the center-frequency function is active. TheCenter Freqmenu key label is highlighted to indicate that center frequency is the active function. The active function block is the space on the screen within the graticule where the active function messages appear. Active function values can be changed using the knob, step keys, or numeric keypad. Set the center frequency to 50 MHz with the DATA keys by pressing50 MHz. The knob and step keys can also be used to set the center frequency.
CAUTION When operating in DC coupled mode on spectrum analyzers with Option UKB, take care to protect the input mixer by limiting the input level to 0 VDC and +30 dBm.
5. Set the span.
PressSPAN X Scale.Span is now displayed in the active function block, and theSpanmenu key label is highlighted to indicate it is the active function. Reduce the span to 20 MHz by using the knob, pressing the down key (⇓), or pressing20 MHz.
Chapter 2 2-21 6. Set the amplitude.
When the peak of a signal does not appear on the screen, it may be necessary to adjust the amplitude level on the screen. Press
AMPLITUDE Y Scale.Ref Level 0.0 dBm appears in the active function block (48.75 dBmV with Option 1DP). TheRef Level menu key label is highlighted to indicate that reference level is the active function. The reference level is the top graticule line on the display and is set to 0.0 dBm (48.75 dBmV with Option 1DP). Changing the value of the reference level changes the amplitude level of the top graticule line.
If desired, use the reference level function to place the signal peak at the top of the screen using the knob, step keys, or numeric keypad. Figure 2-4 demonstrates the relationship between center frequency and reference level. The box in the figure represents the analyzer display. Changing the center frequency changes the horizontal placement of the signal on the display. Changing the reference level changes the vertical placement of the signal on the display.
Increasing the span increases the frequency range that appears horizontally on the display.
NOTE Analyzers with Option 1DP default to display amplitude values in dBmV when in a log scale mode.
NOTE For E4402B, E4404B, and E4405B analyzers with Option UKB, frequencies below 100 kHz can be measured by setting the input to DC coupled mode. (Input, Coupling (DC))
7. Set the marker.
Marker functions measure the frequency and amplitude of a signal. You can place a diamond-shaped marker on the signal peak to find the signal’s frequency and amplitude.
To activate a marker, press theMarker key (located in theMARKER section of the front panel). TheNormalsoftkey is highlighted to show that the marker is the active function. Turn the knob to place the marker at the signal peak. You can also use thePeak Search key, which automatically places a marker at the highest point on the trace.
Readouts of marker frequency and amplitude appear in the active function block and in the upper right corner of the display. Look at the marker readout to determine the amplitude of the signal. If another function is activated, the marker frequency and
amplitude can still be identified by looking at the marker readout in the upper right corner of the display.
Measurement Summary
1. PressSystem,Power On/Preset,Preset (Factory). Press the green Preset key. Turn on the internal 50 MHz signal by pressingInput, Amptd Ref Out (f=50 MHz) (On), and connecting a cable from the AMPTD REF OUT to theINPUT 50Ω.
NOTE For the Agilent E4401B and E4411B, the above key label isAmptd Ref (f=50 MHz), and no cable is required.
2. Set the center frequency by pressing the following keys:Frequency, 5,0, MHz.
3. Set the span by pressing the following keys:Span,2,0,MHz. 4. The amplitude reference signal is about−27 dBm (25 dBmV for
Option 1DP) for the Agilent E4411B and E4401B. The amplitude reference signal is about – 20 dBm for the Agilent E4402B, E4403B, E4404B, E4405B, E4407B and E4408B. If desired, adjust the reference level: pressAMPLITUDE Y Scale to activate the reference level, and use the knob or step keys to change the reference level and bring the signal to the top of the screen.
5. Determine the amplitude and frequency of the signal. You can either pressPeak Searchor pressMarkerand move the marker to the signal peak. Read the amplitude and frequency. The display should look like the one inFigure 2-5. Frequency is displayed horizontally, and amplitude (power) is displayed vertically.
Chapter 2 2-23 Figure 2-5 Reading the Amplitude and Frequency
Analyzer Accuracy and the Internal Alignment
Process
Data from the internal alignment routine is necessary for spectrum analyzer operation. The internal alignment routine runs continuously to ensure that the analyzer is using current alignment data that improves the analyzer frequency and amplitude accuracy. Press the System,Alignments keys to view the alignment menus. For more detailed information on the alignment keys, refer to“Alignments” in Chapter 6.
Warm-up Time
In order for the analyzer to meet its specifications, allow it to warm up for 5 minutes after being turned on before attempting to make any calibrated measurements. If the analyzer is an Agilent E4402B, E4403B, E4404B, E4405B, E4407B, or E4408B, connect a BNC cable between AMPTD REF OUT and INPUT 50Ω using an adapter. After a 5 minute warm-up, pressSystem,Alignments,Align Now,All. IfAuto Align Off is selected, refer to the analyzer specifications for the conditions required to maintain calibration.
Chapter 2 2-25
File Menu Functions
This section describes how to use the functions located under the front-panelFilekey. Data storage and retrieval are handled similarly to that of personal computers (PCs). Like PCs, these analyzers include an internal storage drive and a floppy disk drive, both of which have directory and sub-directory capability.
NOTE The descriptions in this section assume the analyzer has firmware revision A.04.00 or later. The file menu functions in earlier firmware are different. If you would like to upgrade your analyzer to the latest firmware revision, please visit the following web site:
http://www.agilent.com/find/esa
You will learn how to do all of the following: • locate and view files in the catalog • create a directory
• format a floppy disk • save a file
• load a file • rename a file • copy a file • delete a file
NOTE The display examples in this section are made using the
Agilent E4407B, you may see some variations depending upon your analyzer.
Locate and view files in the catalog
Techniques for locating files and directories are consistent throughout the various file menu functions. Although this section provides specific information about navigation in the catalog, you may wish to refer back to this section when performing other operations of the file menu. PressFile,Catalog to bring up a screen display as shown inFigure 2-6.
Figure 2-6 Catalog Menu
1. The entry fields show the parameters for the files viewed. Entry fields that are being modified or are modifiable are indicated by highlighting (inverse video). Each file menu function has its own unique set of entry fields pertaining to that function. Below are the fields listed under the catalog key:
a. Name: field states the filename.
b. Show Type: field displays the type of files viewed.
c. Path: field displays the drive and directory location of the files. 2. The directory information box displays the drives, directories, and/or
files currently described in the entry fields. Highlighting a row of information selects that location and updates the entry fields. There are four column headings in this area of the display. They are described as follows:
a. Name:column states the drive ([-A-]or[-C-]) if at the top level on the drive, directory name, or filename.
b. Type:column displays the extension of the filename, for example,
.SET,.STA,.TRC. Directories are displayed as DIR and drives have nothing listed underType:. They are only designated by the
Name: column ([-A-] or[-C-]).
Chapter 2 2-27 d. Modified: column displays the date and time the last change
occurred.
3. The softkey menu has four options:
a. Type: allows you to choose the type of file you wish to view. (You may view all types by using theAllkey underType.)
b. Sort: Under theSortkey, you can sort by any of the four columns and you can choose up (ascending) or down (descending).
c. Dir Up: moves you up one directory level. If you are already at the top level, this key moves you up to the drive level, displaying the available disk drives.
d. Dir Select: moves you down into the highlighted directory or up into the next level (directory or drive) if the “. .” under theName:
column is highlighted.
NOTE Navigation keys: Use the front-panelStep Keys orKnob and theDir Up orDir Select keys to move around in the directory information box.
4. The drive space line shows the number of bytes used on the drive and the number of bytes still free on the drive.
Creating a directory
Directories and sub-directories can be created on both the A: floppy disc and the internal C: drive. This allows maximum flexibility in
organizing files. For this example, we will create a directory on the C: drive.
1. PressFile,More 1 of 2,Create Dir. Your screen should look similar to Figure 2-6, except the entry fields will beDir Name: andPath: and the Heading will read:Directories.
2. Navigate through the file system until thePath: field displays C:\. (Use the Step Keys, Knob, Dir Up, and/or Dir Select keys.)
3. PressName and enter the name, “START” using the Alpha Editor. (The numeric keypad is also available for the filename.) PressEnter (hardkey) when theDir Name: field contains this directory title. (Use theBk Sp hardkey on the front panel to make corrections.) 4. PressCreate Dir Now to execute the operation. The message:
Creating Directory appears on the screen. Then the status bar displays:Directory C:\START created.
5. To make a sub-directory, scroll down to theSTART directory you just created and pressDir Select. ThePath: field should now read:
C:\START\. Repeat Steps 3 and 4 above, using a new name. The status bar now should read:Directory C:\START\new name created.
Format a Floppy Disk
You can format a floppy disk in the analyzer. The format is MS-DOS1. Note that it is not necessary to format your floppy disk with the
analyzer; preformatted disks can be used with the analyzer.
1. Place the disk you wish to format into the floppy drive (A:\) of the analyzer.
NOTE Only 1.44-MB floppy disks are supported by the analyzer. 720-KB floppy disks will not work reliably.
2. Access theFormat key by pressingFile,More 1 of 2, and thenFormat. The directory information box is active (highlighted), however, only the floppy disk volume[-A-] is shown on the display.
NOTE The directory information box displays all files present on the floppy disk inserted in drive (A:\). If the disk you are attempting to format has no pre-existing formatting, or is not inserted in drive (A:\), the error message:bad, missing, or unformatted disk is displayed in the status line.
3. PressFormat Now. The following message appears in the display window:WARNING: You are about to destroy ALL data on Volume A:. Press Format Now again to proceed or any other key to abort.
CAUTION To abort disk format, press any key butFormat Now. When a disk is formatted, all data on the disk is destroyed.
4. PressFormat Now a second time to format the disk. SeeFigure 2-7.
Chapter 2 2-29 Figure 2-7 Format Menu
You will see the message:Formatting Disk in the display window. Pressing any other key after receiving the warning in step 3 on page 2-28, will abort the formatting process.
5. When formatting is complete, a message,Volume A: formatted
appears on the status line. The format process takes approximately three minutes.
Save a File
You can save files (setups, states, traces, limits, corrections, or screens) to a floppy disk (A:\), or the internal drive (C:\). In this example you will save a trace to the internal C: drive.
Step 1. Set up the analyzer trace
1. Turn on the 50 MHz amplitude reference signal of the analyzer. For the Agilent E4401B and E4411B, use the 50 MHz amplitude reference signal of the analyzer as the signal being measured. Press Preset,Factory Preset(if present),Input/Output,Amptd Ref (On). For all other models, connect a cable between the front-panel AMPTD REF OUT to the analyzerINPUT, then pressPreset,Factory Preset (if present),Input/Output,Amptd Ref Out (On).
2. Set the center frequency to 50 MHz and the span to 75 MHz: press FREQUENCY,50 MHz,SPAN,75 MHz.
The reference signal appears on the display.
3. View trace 1 and put it into maximum hold by pressingView/Trace, Max Hold. (Trace 1 should already by underlined, but if not, press Trace 1 2 3 until 1 is underlined. and then pressMax Hold.) Your analyzer display should look similar toFigure 2-8.
Figure 2-8 Viewing Trace 1
4. Activate trace 2 and put it into minimum hold by pressingTrace (2), Min Hold. Your analyzer display should look similar toFigure 2-9.
Chapter 2 2-31 Figure 2-9 Viewing Traces 1 and 2
5. Activate trace 3 by pressingTrace (3),Clear Write. Your analyzer display should look similar toFigure 2-10.
Step 2. Save the file
1. To access theSave menu, press,File,Save.
2. Select the type of file you want to save. In this example you are saving a trace; pressType, Trace.
3. Select the trace you wish to save (1, 2, 3, or all traces). In this example you will save trace 3; pressSource (softkey),Trace 3. 4. Select the format for which you wish to save the trace: trace plus
state (Trace + State) or comma separated value (CSV). In this
example you will save as trace plus state; pressFormat,Trace + State. 5. Enter a filename by pressingName. The Alpha Editor appears. For
this example you will name the file, “TEST1”. (The numeric keypad is also available for the filename.) Note that the file extension is always set by the system and for this file type the extension isTRC. You must now press theEnter (hardkey) to get back to the Save menu.
6. The destination for the saved file is shown in thePath: field. In this example, you will select the path asC:\START\.
NOTE If the correct location is not listed in thePath:field, change directories by pressingDir Up(softkey) or using the step keys or knob, highlight the directory you wish. PressingDir Select then confirms your choice which is displayed in the Path: field.
7. PressSave Now orSave (hardkey) to save the file to theC:\Start\
location. The message Saving Now is displayed during this operation. For this example, the status line displays:
C:\START\TEST1.TRC file saved.
NOTE When saving to drive (A:), never remove the floppy disk during the save operation. To do so could corrupt all data on the floppy disk.
NOTE You need to use a filename that does not already exist in the current directory. The filename is limited to eight characters, alpha (A-Z) or numeric (0-9) in any combination. The analyzer will not allow you to overwrite an existing file. If you select a filename that already exists, the status bar will display the message:File already exists. If you do not choose a filename, the analyzer will automatically generate a name based on the type of file you are saving (Setup:SETUP, State:
STATE, Trace:TRACE, Limits:LIMIT, Corrections:COREC, Screen:SCREN). It also generates a three digit integer (starting at 000 and extending through 999, remembering the previously saved value through a power cycle) which it adds to the name, for example:TRACE056.TRC. Also note that this three digit integer increments upon each attempted save until a unique filename is created, without regard to the success of the save.
Chapter 2 2-33
Load a file
1. Reset the analyzer by pressingPreset,Factory Preset (if present). 2. To access theLoad menu, pressFile,Load.
3. Select the type of file you want to load (setup, state, trace, limits, or corrections). In this example you are loading a trace file; pressType, Trace.
NOTE Not all file types can be loaded back into the analyzer. For example, Screen files and CSV (comma separated value) cannot be loaded. CSV and Screen files are designed for use with a PC.
4. Select the directory where your file is located. In this example, select theC:\START\directory. (Use the front-panel step keys, knob,Dir Up, and/orDir Select keys to locate the directory.)
5. Select the file you want to load into the analyzer by moving the cursor with the front-panel knob to highlight the file name. In this example the file isTEST1.TRC. Select the trace into which you wish to load the file. In this example, load it into Trace 2. (Destination, Trace 2).
6. PressLoad Now to load the specified file. Your display should look similar toFigure 2-11. The status bar reads:C:\START\TEST1.TRC file loaded.
NOTE You should notice that the trace you saved, in this example trace 3, is loaded to trace 2. If you wish to verify this condition, remove the signal input. For Agilent E4401B and E4411B, pressInput/Output,Amptd Ref On Off(Off), for all other models, pressInput/Output,Amptd Ref Out On Off (Off).
Note that when a trace is loaded, it is placed in view mode. To see that trace 2 is in view mode, blank traces 1 and 3 by pressingView/Trace, Trace 1,Blank, Trace 3,Blank. Then press Trace 2. Notice that trace 2 is the only trace displayed in view mode (the view key is selected, and the trace is not sweeping). Your display should look similar toFigure 2-12.
Figure 2-12 Verifying Trace 1
CAUTION When operating in DC coupled mode on spectrum analyzers with Option UKB, take care to protect the input mixer by limiting the input level to O VDC and +30 dBm.
NOTE When loading Limits files, be sure you have selected the appropriate X Axis Units: frequency or time (Display, Limits, Properties, X Axis Units). If you are in time X-Axis Units, and you load frequency limits, all current limit line data will be erased and the analyzer will switch to the frequency domain. The reverse of the this situation also holds true.
Chapter 2 2-35
Rename a File
1. To access theRename menu, pressFile,Rename.
2. Select the type of file you want to rename (setup, state, trace, limits, screens, or corrections). In this example you are renaming a trace file; pressType,Trace.
3. Select the drive and directory where your file is located. In this example, choose driveC:\START.
4. Select the file you want to rename. In this example, choose the file
TEST1.TRC.
5. PressNameto open the Alpha Editor menu. For this example, rename the file toRENAME using the Alpha Editor softkeys. (The
Name: field is limited to eight characters.) Your display should look similar toFigure 2-13.
6. PressEnter,Rename Now: your file is now renamed and visible within the directory displayed on your analyzer. The status line displays the message:C:\START\TEST1.TRC file renamed to
C:\START\RENAME.TRC. Figure 2-13 Renaming a File