Original Research Article
Cardiovascular profile of patients with chronic kidney disease
G. S. Mahishale
1, Deepa Allolli
2*, Anand Patil
1, Basavaraj P.G.
1, Sachin Shetagar
3,
Satish Talikoti
1INTRODUCTION
Link between kidney and cardiovascular diseases was first described by Richard Bright over a century ago, who observed cardiac hypertrophy in patients with small kidneys during autopsies. Studies have demonstrated that the frequency of fatal and nonfatal cardiovascular events increase even in early stages of chronic kidney disease (CKD) and is the most frequent cause of mortality in
dialysis patients. In a community-based study, Culleton et al showed that the prevalence of all the major traditional cardiovascular risk factors was significantly higher in patients with even mild renal failure than in those with normal renal function. Additionally, the Hypertension Detection and Follow-up Program study found that even after adjusting for other risk factors, hypertensive patients with baseline serum creatinine levels of >1.7 mg/dl had a 2.22 times higher 8-year mortality rate. These
1Department of Medicine, 2Department of Aneasthesia, 3Department of Radiology, AAMC, Vijayapura, Karnataka,
India
Received: 28 March 2019 Accepted: 04 May 2019 *Correspondence: Dr. Deepa Allolli,
E-mail: gmahishale@gmail.com
Copyright: © the author(s), publisher and licensee Medip Academy. This is an open-access article distributed under the terms of the Creative Commons Attribution Non-Commercial License, which permits unrestricted non-commercial use, distribution, and reproduction in any medium, provided the original work is properly cited.
ABSTRACT
Background: Frequency of fatal and nonfatal cardiovascular events increase even in early stages of chronic kidney disease (CKD). This study was aimed to understand the cardiovascular profile of patients with CKD.
Methods: This observational study was conducted on patients who were admitted with chronic kidney disease in Sri Venkateswara Rama Narayan RUIA Government General Hospital, Tirupati. Patients were classified according to their severity of CKD. All patients had an electrocardiogram and echocardiogram. Results of various biochemical investigations, electrocardiogram and echocardiogram were compared between patients with mild, moderate and severe CKD.
Results: Combined diabetes mellitus and hypertension was found to be the most common case of CKD in Authors patient population (43%), followed by diabetes mellitus alone (37%). Serum creatinine and blood urea nitrogen were found to be significantly higher and creatinine clearance and haemoglobin were significantly lower among patients with severe CKD. Electrocardiography revealed 50% had left ventricular hypertrophy (LVH), 30% had tall ‘T’ waves and 15 % had ST-segment changes. Mean inter-ventricular septal end diastole thickness and mean left ventricular mass was found to be significantly in patients with severe CKD as compared to mild CKD.
Conclusions: Extensive cardiovascular evaluation of patients with CKD is warranted even if the classical symptoms are not absent and early cardiovascular rehabilitation should be instituted in such patients.
Keywords: Anaemia, Cardiovascular disease, Chronic kidney disease, End-stage renal disease, Hypertension
observations suggest that early assessment and management of cardiovascular diseases early in course of CKD is required. However, there are no definitive recommendations for preventing cardiovascular events in patients with CKD. Furthermore, besides the traditional risk factors playing role in pathogenesis of CVD, the CKD itself is a risk factor for CVD because of uremic milieu, inflammation, abnormal calcium phosphate metabolism and recently the coronary artery calcification gene has been recognized in patients with CKD predisposing them for adverse cardiac events. This study was aimed to understand the cardiovascular profile of patients with CKD so as to aid prompt diagnosis of cardiovascular complications of CKD.
METHODS
Study design and sampling
This observational study was conducted on patients who were admitted with chronic kidney disease in Sri Venkateswara Rama Narayan RUIA Government General Hospital, Tirupati. All patients aged 18 years and above, who presented with history and clinical symptoms suggestive of chronic kidney disease, later confirmed by laboratory test and ultrasound of abdomen were included in this study. We excluded patients who had a history of liver failure, ischemic heart disease and nerve conduction abnormalities. Patients were admitted in the medical wards and were enrolled in the study over a period of one year. Patients fulfilling the inclusion criteria were approached and explained the purpose of the study. Patients agreeing to participate and provide a written informed consent were included in the study. The institutional ethics committee approved the study.
Data collection and Data analysis
A pre-designed and pre-tested caser report form was used to collect patient related data. Demographic information of the patients was obtained from the medical records. Etiology of CKD was ascertained in each included patient based on the medical history provided by them. Routine and specific investigations like hemogram, serum electrolytes, lipid profile, blood urea nitrogen and serum creatinine were ordered for all patients as part of their management as per the discretion of the treating physician. Creatinine clearance was calculated by Cockcroft-Gault equation. All patients in this study had an electrocardiogram and echocardiogram, some because of their significant past medical history and rest as part of this study. A 12-lead electrocardiograms (ECG) was obtained at the time of admission and was interpreted by a qualified physician trained in ECG interpretation. Two-dimensional echocardiography machine GE LOGIQ 400 PRO was used with 3.5 MHz transducer probe. The M mode recording perpendicular to the long axis of and through the centre of the left ventricle at the papillary muscle level were taken as standard measurements of the systolic and diastolic wall thickness and chamber
dimensions. Left ventricular mass was determined by the equation developed by Devereux.
Data were codified and analyzed in SPSS software (version 21, IBM Corp). Data were expressed as mean and standard deviation or as frequency and percentages. Patients were classified as mild, moderate and severe CKD based on their serum creatinine levels as 1.5 to 3.0 mg/dl, 3.1 to 6.0 mg/dl and higher than 6.0 mg/dl respectively. Results of various biochemical investigations, electrocardiogram and echocardiogram were compared between patients with mild, moderate and severe CKD using analysis of variance test with Bonferroni post hoc test. Statistical significance was considered at 5% error.
RESULTS
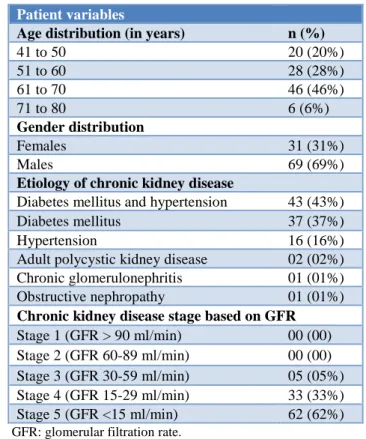
Table 1 describes the baseline characteristics of the patients included in the study. Age of the patients ranged from 41 to 80 years and 46% of the patients were from age group 61 to 70 years. Females comprised of 31% of the study population. Combined diabetes mellitus and hypertension was found to be the most common case of CKD in authors patient population (43%), followed by diabetes mellitus alone (37%). Based on glomerular filtration rate (GFR), 62% of the patients were found to have stage 5 CKD (GFR less than 15 ml/min).
Table 1: Baseline characteristics of the patients included in the study.
Patient variables
Age distribution (in years) n (%)
41 to 50 20 (20%)
51 to 60 28 (28%)
61 to 70 46 (46%)
71 to 80 6 (6%)
Gender distribution
Females 31 (31%)
Males 69 (69%)
Etiology of chronic kidney disease
Diabetes mellitus and hypertension 43 (43%) Diabetes mellitus 37 (37%) Hypertension 16 (16%) Adult polycystic kidney disease 02 (02%) Chronic glomerulonephritis 01 (01%) Obstructive nephropathy 01 (01%) Chronic kidney disease stage based on GFR Stage 1 (GFR > 90 ml/min) 00 (00) Stage 2 (GFR 60-89 ml/min) 00 (00) Stage 3 (GFR 30-59 ml/min) 05 (05%) Stage 4 (GFR 15-29 ml/min) 33 (33%) Stage 5 (GFR <15 ml/min) 62 (62%)
GFR: glomerular filtration rate.
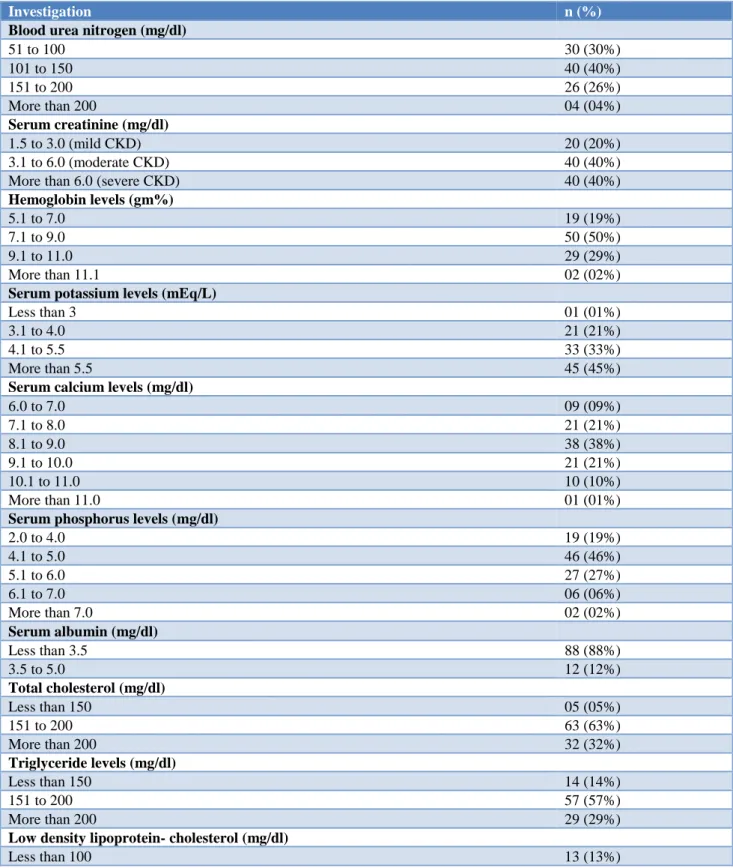
(BUN) ranged from 50 to 280 mg/dl and 40% had BUN in the range of 101 to 150 mg/dl. serum creatinine 3.1 to 6.0 mg/dl (moderate ckd), 40% had serum creatinine greater than 6.0 (severe ckd)). half of all patients had haemoglobin ranging between 7.1 and 9.0 gm%. Serum creatinine ranged from 1.5 to 20.8 mg/dl and was greater
than 3.0 mg/dl in 80% of the patients (40% had Furthermore, 45% of the patients had serum potassium levels above 5.5 mEq/L, 11% had serum calcium levels above 10 mg/dl, and 35% had serum phosphorus levels above 5 mg/dl.
Table 2: Distribution of patients according to their biochemical laboratory values.
Investigation n (%)
Blood urea nitrogen (mg/dl)
51 to 100 30 (30%)
101 to 150 40 (40%)
151 to 200 26 (26%)
More than 200 04 (04%)
Serum creatinine (mg/dl)
1.5 to 3.0 (mild CKD) 20 (20%)
3.1 to 6.0 (moderate CKD) 40 (40%)
More than 6.0 (severe CKD) 40 (40%)
Hemoglobin levels (gm%)
5.1 to 7.0 19 (19%)
7.1 to 9.0 50 (50%)
9.1 to 11.0 29 (29%)
More than 11.1 02 (02%)
Serum potassium levels (mEq/L)
Less than 3 01 (01%)
3.1 to 4.0 21 (21%)
4.1 to 5.5 33 (33%)
More than 5.5 45 (45%)
Serum calcium levels (mg/dl)
6.0 to 7.0 09 (09%)
7.1 to 8.0 21 (21%)
8.1 to 9.0 38 (38%)
9.1 to 10.0 21 (21%)
10.1 to 11.0 10 (10%)
More than 11.0 01 (01%)
Serum phosphorus levels (mg/dl)
2.0 to 4.0 19 (19%)
4.1 to 5.0 46 (46%)
5.1 to 6.0 27 (27%)
6.1 to 7.0 06 (06%)
More than 7.0 02 (02%)
Serum albumin (mg/dl)
Less than 3.5 88 (88%)
3.5 to 5.0 12 (12%)
Total cholesterol (mg/dl)
Less than 150 05 (05%)
151 to 200 63 (63%)
More than 200 32 (32%)
Triglyceride levels (mg/dl)
Less than 150 14 (14%)
151 to 200 57 (57%)
More than 200 29 (29%)
Low density lipoprotein- cholesterol (mg/dl)
Investigation n (%)
101 to 130 67 (67%)
More than 130 20 (20%)
High density lipoprotein- cholesterol(mg/dl)
Less than 30 52 (52%)
31 to 40 34 (34%)
More than 40 14 (14%)
Thirty-two percent had total cholesterol above 200 mg/dl, 29% had triglyceride above 200 mg/dl and 20% had low density lipoprotein cholesterol above 130 mg/dl. Electrocardiography revealed 50% had left ventricular hypertrophy (LVH), 30% had tall ‘T’ waves and 15 % had ST-segment changes. On echocardiography, 69% were found to have LVH (Table 3). Table 4 describes the association of biochemical parameters of the patients with the severity of CKD. Patients with severe CKD had a significantly higher blood urea and serum creatinine levels and significantly lower creatinine clearance and haemoglobin as compared to patients with mild and moderate CKD (Table 4). Age, cholesterol levels, and blood pressures were found not to be associated with the severity of CKD. Mean inter-ventricular septal end diastole thickness was found to be significantly in
patients with severe CKD as compared to mild CKD. Additionally, mean left ventricular mass was found to be higher among patients with severe CKD (243.99±7.71 gm) as compared to those with mild (204.50±6.78) or moderate (195.31±6.38) CKD (Table 5).
Table 3: Cardiovascular changes in the patients.
Investigation n (%)
Electrocardiographic findings
Left ventricular hypertrophy 50 (50%) Left atrial hypertrophy 05 (05%) ST-segment changes 15 (15%) Tall ‘T’ waves 30 (30%) Echocardiogenic findings
Left ventricular hypertrophy 69 (69%)
Table 4: Association of biochemical parameters with severity of chronic kidney disease.
Biochemical parameters CKD severity p value*
Mild (A) Moderate (B) Severe (C) A vs B A vs C B vs C
Age (Years) 63.05±17.59 60.18±7.76 59.25±10.18 >0.05 >0.05 >0.05 Blood urea (Mg/Dl) 91.24±35.70 140.03±38.00 159.15±36.30 <0.01 <0.05 <0.001 Serum creatinine (Mg/Dl) 2.35±0.38 4.21±0.78 10.13±3.90 <0.05 <0.01 <0.001 Creatinine clearance (Ml/Min) 25.81±9.17 14.93±2.33 7.90±2.74 <0.001 <0.001 <0.001 Hemoglobin (Gm%) 13.8±0.30 13.1±0.22 11.5 ± 0.17 >0.05 <0.001 <0.001 Total cholesterol (Mg/Dl) 196.09±44.90 190.67±23.10 207.22±30.40 >0.05 >0.05 >0.05 Triglyceride (Mg/Dl) 166.85±14.90 164.64±9.32 163.25±19.60 >0.05 >0.05 >0.05 LDL cholesterol (Mg/Dl) 124.28±12.5 121.97±11.9 113.52±13.2 >0.05 >0.05 >0.05 HDL cholesterol (Mg/Dl) 36.33±6.06 32.56±5.77 31.66±4.64 >0.05 <0.01 >0.05 Serum Potassium (Meq/L) 4.39±0.67 4.88±0.99 4.81±0.87 >0.05 >0.05 >0.05 Serum calcium (Mg/Dl) 8.93±1.29 8.85±0.87 8.47±0.97 >0.05 >0.05 >0.05 Serum phosphorus (Mg/Dl) 4.95±0.96 5.23±0.80 4.58±0.99 >0.05 >0.05 <0.01 Systolic blood pressure (Mm Hg) 131.62±15.92 133.41±16.50 134.00±17.55 >0.05 >0.05 >0.05 Diastolic blood pressure (Mm Hg) 85.62±7.99 88.00±6.84 86.45±7.83 >0.05 >0.05 >0.05
*Analysis of variance with Bonferroni post hoc test.
Table 5: Association of echocardiographic parameters with severity of chronic kidney disease.
Echocardiographic parameters CKD severity P Value*
Mild (A) Moderate (B) Severe (C) A Vs B A Vs C B Vs C
Left ventricular internal diameter
end diastole (cm) 4.37±0.50 4.29±0.36 4.56±0.54 >0.05 >0.05 >0.05 Left ventricular posterior wall end
Echocardiographic parameters CKD severity P Value*
Mild (A) Moderate (B) Severe (C) A Vs B A Vs C B Vs C
(Cm)
Left ventricular mass (Gm) 204.50±6.78 195.31±6.38 243.99±7.71 >0.05 <0.05 <0.01 *analysis of variance with bonferroni post hoc test.
DISCUSSION
The present study included 100 patients who were diagnosed with chronic kidney disease according to the National Kidney Foundation Kidney Disease Outcome Quality initiative and were assessed for cardiovascular changes. Echocardiographic studies have been the mainstay to demonstrate structural heart abnormalities in CKD patients. Similar to the results of the present study, 44% of the patients with CKD were found to have concentric left ventricular hypertrophy and 30% had predominately eccentric hypertrophy. These pathological changes are in response to volume and pressure overload. Volume overload increases left ventricular pressure which stretches the ventricular wall, which in turn stretches the myocytes. This process eventually results in wall thickening to reduce wall stress. On the other hand, pressure overload increases wall stress during systole, resulting in myocyte proliferation and wall thickening with preservation or reduction of cavity volume. Many of these processes can be accelerated by the uremic environment of chronic renal disease. Volume overload can commonly be caused by anemia, excess salt and water and arteriovenous fistulae in patients on dialysis, while hypertension results in pressure overload. These modifications in the physiological system are probably the primary stimuli to ventricular remodeling in uremia and also promote arterial remodeling in the large and resistance arteries. Additionally, secondary hyperparathyroidism and raised calcium-phosphate product may be associated with aortic valve calcification.
Hypertension, which is a consequence of kidney damage, predisposes to coronary artery disease, congestive heart failure and stroke. Author study population had hypertension as the most common etiology for CKD. The characteristic lipid abnormality in CKD is elevated triglycerides, low HDL and normal to low LDL (except proteinuric CKD having high LDL). We did not observe a difference in lipid profile values with increasing severity of CKD. It is also not clear whether dyslipidemia associated with CKD increases the risk of atherosclerotic disease in such patients. Though not measured in the present study, procoagulants like fibrinogen, factor VIII and von Willebrand factor concentration increase in CKD and studies have suggested their role in increasing the risk of coronary diseases, stroke and other cardiovascular events.
In the present study, LVH was observed in 50% of the patients on electrocardiograms. There is a general agreement that LVH is highly prevalent in patients on dialysis, but it varies with age, gender, blood pressure and ethnicity.
The high prevalence of LVH among patients in the present study appears to be related to late presentation and poor hypertension control. Moreover, we found that patients with only LVH had hypertension, which suggests that hemodynamic changes due to hypertension have a role to play in ventricular hypertension. This finding highlights the need to recognize hypertension in CKD patients early.
CONCLUSION
This study demonstrated that patients with CKD commonly have LVH, which can be identified non-invasively using echocardiography or electrocardiography. Left ventricular mass was significantly higher among patients with severe CKD as compared to mild or moderate CKD. Extensive cardiovascular evaluation of patients with CKD is warranted even if the classical symptoms are not absent and early cardiovascular rehabilitation should be instituted in such patients.
Funding: No funding sources Conflict of interest: None declared
Ethical approval: The study was approved by the Institutional Ethics Committee
REFERENCES
1. Bright R. Reports of Medical Cases selected with a view of illustrating the symptoms and cure of diseases by a reference to morbid anatomy. London: Logmans. Med Chir Rev.1831;15(30):289-330. 2. Ritz E. Minor renal dysfunction: an emerging
cardiovascular risk factor. Heart. 2003;89(9):963-4. 3. Culleton BF, Larson MG, Wilson PW, Evans JC,
Parfrey PS, Levy D. Cardiovascular disease and mortality in a community- based cohort with mild renal insufficiency. Kidney Int. 1999;56(6):2214-9. 4. Shulman NB, Ford CE, Hall WD, Blaufox MD,
Simon D, Langford HG, et al. Prognostic value of serum creatinine and effect of treatment of hypertension on renal function. Results from the Hypertension Detection and Follow-up Program. The Hypertension Detection and Follow- up Program Cooperative Group. Hypertension. 1989;13(Suppl 5):1180-93.
6. Cockcroft DW, Gault H. Prediction of creatinine clearance from serum creatinine. Nephron. 1976;16(1):31-41.
7. Devereux RB, Alonso DR, Lutas EM, Gottlieb GJ, Campo E, Sachs I, et al. Echocardiographic assessment of left ventricular hypertrophy: comparison to necropsy findings. Am J Cardiol. 1986;57(6):450-8.
8. Levey AS, Coresh J, Balk E, Kausz AT, Levin A, Steffes MW, et al. National Kidney Foundation practice guidelines for chronic kidney disease: evaluation, classification, and stratification. Ann Intern Med. 2003;139(2):137-47.
9. Foley RN, Parfrey PS, Harnett JD, Kent GM, Martin CJ, Murray DC, et al. Clinical and echocardiographic disease in patients starting end stage renal disease therapy. Kidney Int. 1995;47(1):186-92.
10. London GM, Drueke TB. Atherosclerosis and arteriosclerosis in chronic renal failure. Kidney Int. 1997;51(6):1678-95.
11. London GM, Pannier B, Marchais SJ, Guerin AP. Calcification of the aortic valve in the dialyzed patient. J Am Soc Nephrol. 2000;11(4):778-83.
12. Lewington S, Clarke R, Qizilblash N, Peto R, Collins R. Age-specific relevance of usual blood pressure to vascular mortality; a meta-analysis of individual data for one million adults in 61 prospective studies. Lancet. 2002;360(9349):1903-13.
13. Danesh J, Lewington S, Thompson SG, Lowe GD, Collins R, Kostis J, et al. Plasma fibrinogen level and risk of major cardiovascular diseases and nonvascular mortality: an individual participant metaanalysis. JAMA. 2005;294(14):1799-809. 14. Chen C, Sung KT, Shih SC, Liu CC, Kuo JY, Hou
CJ, et al. Age, gender and load-related influences on left ventricular geometric remodeling, systolic Mid-Wall function, and NT-ProBNP in asymptomatic Asian population. PLoS One. 2016;11(6):e0156467.
Cite this article as:Mahishale GS, Allolli D, Patil A, Basavaraj PG,Shetagar S, Talikoti S.