Creative Commons Attribution 4.0 International
UDC 502.3:613.648.4
T. I. RUSAKOVA
1*1*Dep. «Aerohydrodynamics and Energy Mass-transfer», Oles Honchar Dnipro National University, Kazakov St., 18, Dnipro, Ukraine, 49010, tel. +38 (056) 776 82 05, e-mail [email protected], ORCID 0000-0001-5526-3578
METHOD FOR PREDICTING PARAMETERS OF THE AEROIONIC
MODE IN OPEN TERRAIN GROUND AREAS
Purpose. The scientific work is devoted to the development of a new method for forecasting aeroionic mode in working areas at industrial sites, taking into account ionizing sources and surrounding obstacles. Methodology. To find the concentration of positive aeroions, dust and negative aeroions, we use 3D mass transfer equations that take into account the rate of recombination of ions having different polarity and the rate of recombination of ions with dust particles. The numerical solution is based on the integration of the mass transfer equations using the finite-difference method, which turns out to be stable for any step in time. To determine the components of the air velocity vector, a three-dimensional model of the potential flow is used, where the Laplace equations for the velocity poten-tial are the modeling equations. Findings. The mathematical method of numerical calculation of the concentration of positive, negative aeroions and dust has been developed. A feature of the method is the possibility of predicting the aeroionic mode, taking into account all physical factors that significantly affect the formation of concentration zones of aeroions in working areas at industrial sites. The method is not tied to a particular industrial site, it allows us to estimate the value of the concentration of aeroions both locally and in the entire calculated region.
Originality. A method for prediction of aeroionic mode in working areas is developed based on 3D modeling of the propagation of negative, positive aeroions and dust under the influence of wind and diffusion, which allows to ob-tain results at each point of space or in a specific cross-section. Practical value. The proposed method of forecasting was used to solve the problem of estimating aeroionic mode in industrial zones in the open area of the industrial site of the Dnipro oil extraction plant in the presence of emission sources: positive aeroions during the operation of vehi-cles and respiration of workers; dust during the movement of workers and vehivehi-cles; negative aeroions of the ionizer installed in the working zone. The regularities of changes in the concentration of aeroions of various polarity and dust at a height of 1.7 m are determined, which corresponds to the position of the respiratory organs of workers. Quantitative results are needed in assessing the permissible working conditions in the workplaces of industrial sites of enterprises when creating new jobs and reengineering existing ones.
Keywords: ionization of air; sources of ion emission; numerical method; industrial site; concentration of aeroions
Introduction
Providing a certain degree of ionization of the air environment in the working area is one of the most important factors in maintaining a good state of health and high efficiency of staff. It has been established that a significant decrease in the content of charged particles (ions) in the air coincides with the appearance of unusual sickliness in working people, fatigue complaints, depression, nausea, insomnia, irritability, respiratory disorders, and others. At the same time, the presence of people in conditions with moderately high ionization of the atmosphere, with the vast majority of negative ions - on the contrary, there is a beneficial effect on the body. The process of ionization of air consists in the transformation of neutral atoms and air molecules into electrically
charged particles (ions). Ions in the air (aeroions) can be formed as a result of natural and artificial ionization.
Creative Commons Attribution 4.0 International
two ions of different polarities, adsorption of light ions on uncharged nuclei, condensation, neutralization of light and heavy ions by charges of the opposite sign, and others.
Assessment of the aeration degree of the environment is carried out by comparing the measured values with the standard ones. Artificial ionizers (high-voltage, induction, radiation, etc.) and efficient, well-organized ventilation of premises are widely used to normalize the ionic mode of the air environment, as the external clean air contains 2-5 times more ions than the air of indoor premises (50-100 ions/cm3).
Many works of domestic authors are devoted to the study of aeroionic mode. Modeling of aeroionic mode in working zones under conditions of artificial ionization is presented in the work [1]. The problem of the evaluation and the relationship between aerosol pollution and the aeroionic composition of air in the working zone is considered in the works [8–9]. The works [2, 11] are devoted to the modeling of the aeroionic mode in premises with artificial ionization using the means of numerical Modeling. The proposed program information system for the optimization of the microclimate in the premises is in [6]. The study of ways to improve the aeroionic mode of the working environment is presented in work [7]. The study of the microclimatic parameters influence of air exchange on the aeroionic composition of the air in the working premises and the modeling and prediction of the aeroionic composition dynamics of air are given in the works [4–5]. The methods for determining the concentration of aeroions and dust content are presented in the work [3]. The normalization of the aeroionic composition of air in office premises is considered in the work [15]. A large number of foreign works are devoted to the study of ionization processes for improving the health of employees[12–14, 16].
Purpose
The purpose of this study is to develop a new method for forecasting aeroionic mode in working areas at industrial sites, taking into account ioniz-ing sources and surroundioniz-ing obstacles (buildioniz-ings).
Methodology
It is known that the formation of the concentra-tion field of aeroions is influenced by a complex of physical factors: airflow, diffusion, electric field effect and others. In addition, there is the interaction of ions of different polarity and their interaction with particles of dust. To account for these process-es during the Modeling of aeroions dispersion, the 3D equation of mass transfer is used. It is written for each component (positive aeroions, dust, negative aeroions). The Modeling equations have the form:
– to describe the process of dispersion of posi-tive ions
p p p p
A uA vA wA
t x y z
p p p
x y z
A A A
x x y y z z
p n p d
A A A A
1
( ) ( ) ( ) ( )
pi i i pi
i
n
p p
p
Q t x x y y z z
; (1)– for modeling the transfer of dust
d d d d
A uA vA wA
t x y z
d d d
х y z
A A A
x x y y z z
1 ( ) ( ) ( ) ( )
di di di di
i
n
d
Q t x x y y z z
; (2)– to describe the process of dissipating negative ions
( ) ( )
n n n
A u bE A v bE A
t x y
( ) n n n
х y
w bE A A A
z x x y y
n
z n p n d
A
A A A A
z z 1 ( ) ( ) ( ) ( )
ni i i i
i
n
n n n
n
Q t x x y y z z
Creative Commons Attribution 4.0 International
The denotations of physical parameters in these equations are as follows:
p
A , A , n Ad – the concentration of positive,
nega-tive aeroions and dust particles, respecnega-tively; u, v, w – components of the velocity vector of the air flow; х, y, z– coefficients of diffusion; t –
time; – the rate of recombination of ions with different polarity; – the rate of recombination of ions with dust particles; ( )
pi
A
Q t – the intensity of
the emission of positive ions at the corresponding coordinate points
i n x , n y , i n z ; ( ) ( ) ( )
i i i
n n n
x x y y z z
– delta-function of Dirac; b – coefficient of ions mobility; E – electric field strength.
At the boundary of the air flow inlet into the calculated area is the initial condition:
0
p entrance p
A A , (4)
where
0
p
A – the initial concentration of aeroions.
At the boundary of the area outlet from the cal-culated we set a «soft» boundary condition:
0
n
, where n– unit vector of the external
nor-mal to the solid surface.
For numerical implementation such a boundary condition is recorded:
( 1, ) ( , )
p p
A i j A i j , (5)
where A ip( 1, )j – the values of ions in the last
boundary cell, A i jp( , ) – the value of ions in the
penultimate difference cell.
On the ground surface and all solid surfaces, the boundary condition for non-permeability is set:
0 p A n
. (6)
This condition physically means that the flow of ions at these boundaries is zero.
Using the Modeling equations (1) – (3) speed components ( , , )u x y z , ( , , )v x y z , w x y z( , , ) must satisfy the equation of continuity:
0
u v w
x y z
. (7)
To fulfill this condition one should solve an aerodynamic problem for determining the velocity field. To determine the components of the air ve-locity vector, a three-dimensional model of the potential flow is used, where the Laplace equation for the velocity potential serves as the simulating equation:
2 2 2
2 2 2 0
P P P
x y z
, (8)
where P – speed potential.
Components of the velocity vector of the air are related to the velocity potential by the following relationships: P u x , P v y , P w z
. (9)
For the Laplace equation, the following bound-ary conditions are set:
– on firm boundaries the condition of
non-permeability is set P 0
n
;
– on the boundary of the flow outlet from the calculated region the Dirichlet boundary condition is set Pconst;
– at the boundary of the air flow inlet into the calculated area, the boundary condition is set
P V n
, where V – known velocity of the inflow.
When simulating the propagation of aeroions, it is necessary to take into account the influence of the electric field on this process. Since the aeroions have a charge, they generate an electric field E. For the Modeling of the electric field, the following equation is used [2, 12]:
0
y
x E z e
E E q
x y z
, (10)
where 0 – dielectric permeability; qe – volumet-ric charge density.
From equation (5.7) we can go to the scalar po-tential, if we take into account such dependence:
x
E
x
, Ey
y
, Ez
z
Creative Commons Attribution 4.0 International Then we obtain the Poisson equation:
2 2 2
2 2 2
0
e
q
x y z
, (12)
where qe e Ap
x y z, ,
, Ap
x y z, ,
– concen-tration of positive aeroions; – scalar potential; e– elementary charge. On the basis of this equation electric field Modeling is carried out.
As the boundary condition, the condition of electrical insulation is used:
0
n
,
where n– unit vector of the external normal to the
solid surface.
For numerical integration of the mass transfer equations, a difference scheme is used based on the geometric and physical splitting of the simulating equations (1) – (3). In each of the four fractional steps, only one direction of perturbation transfer is taken into account; the fifth split step takes into account the change in the concentration of aeroions due to the action of the emission source. The calcu-lation is performed on a rectangular difference grid. Concentration of quantities Ap, An, Ad is
determined in the centers of the difference cells, whereas the components of the velocity vector of the air are set at the boundaries of the difference cells [2, 11–12].
Findings
To estimate the aeroionic mode in the working zones, based on the developed method, it is neces-sary to determine the aeroions emission intensity from the specific sources. As already noted, one of these sources is the worker, who exhales positive aeroions. Physical experiment was conducted to obtain scientifically substantiated information re-garding the magnitude of such emission.
For the experiment, a group of people of dif-ferent ages was selected: 16 people in each age group. The mouth area was measured S=9.5 cm2,
the rate of air flow when exhaled was on average
V=0.4 m/s, flow rate Q V S m3/s, the intensity
of the emission of positive aeroions when exhaled
I V S C ions/s, where C – concentration of
positive aeroions at exhalation. The results of
measuring the average concentration of positive aeroions when exhaling for each age group are given in Table 1.
Experiment to measure the concentration of aeroions from human exhalation was carried out using the KT-401 AIRION TESTER.
T a b l e 1
The value of the concentration of positive aeroions when person exhales
Age of a person, years
Concentration of positive aeroions, ions/cm3,
8–9 166–176 18–19 232–349
40 277–329 78 210–256
The data obtained on the basis of the conducted physical experiment, were used during computa-tional experiments. During the experiments it was taken into account that the source of positive aeroion emission during exhalation had a periodic action, namely, exhalation for 1 s in quantity Q, the inhalation – emission is absent and after 2 s again exhalation with the same emission. That is, the source of periodic emission ( )Q t is known.
Verification of the developed forecast method was carried out. A test task was solved to calculate the emission of positive aeroions with exhaust gas-es of vehiclgas-es.
During the physical experiment, the positive aeroions at different distances from the Daewoo Matiz exhaust pipe were measured using the KT-401 AIRION TESTER. The velocity of wind and gas flow at the exhaust pipe outlet was measured using an anemometer PM 6252 B Digital Anemom-eter. The speed of the air flow was Vair=1.2–1.4 m/s,
and the speed of gas flow Vgas=1.7–1.9 m/s,
diame-ter of the exhaust pipe hole d=32 mm.
The method of conducting the experiment was as follows: the concentration of positive aeroions was measured at a height of 320 mm from the ground surface at different distances from the ex-haust pipe. To obtain data on the intensity of emis-sions, the calculation was made according to the ratio Q V gas S C, where Vgas – the velocity of
ex-Creative Commons Attribution 4.0 International
haust pipe, S – area of the outlet cross section of the exhaust pipe hole, C – the concentration of positive aeroions in the outlet cross section. Imme-diately during the experiment parameters Vgas and
C were measured at a distance of 0.5 cm from the outlet cross section of the exhaust pipe hole. The obtained data were used as input information for numerical calculation on the basis of the developed method. Using this method, the impurity concen-tration values at the points of measurements were also calculated. Table 2 shows the results of exper-imental measurements and the calculated data ob-tained with the help of the developed numerical calculation method.
T a b l e 2
Concentration of positive aeroions at different distances from the emission source
Distance from exhaust pipe of a car, cm
Concentration of positive aeroions,
ions/cm3 (experiment)
Concentration of aeroions, ions/cm3 (calculation)
5 1 400–1 443 1 425 10 1 080–1 097 1 092 20 650–738 721
30 420–546 465 40 143–158 152 50 67–76 72 60 43–57 52
Data analysis shows the adequacy of the nu-merical calculation method. The corresponding deviation is due to the flow turbulization caused by the influence of the car body on the aerodynamics of the flow.
The source of positive aeroions on the street is primarily people, cars. During calculations, a com-plex of factors was taken into account, which had been overlooked in scientific publications: aeroion emission from cars; aeroion emission from hu-mans; the influence of various obstacles in the street on the aeroionic mode formation; the influ-ence of the uneven wind velocity field on the for-mation of aeroionic mode; the influence of the un-even field of atmospheric diffusion on the for-mation of the aeroionic mode; modeling of aeroions dispersion in a three-dimensional formu-lation (3D modeling).
Taking into account the listed factors extremely complicates the solving of these problems:
The task solution is based on three stages:
1. Modeling the formation of a field of concen-tration of positive, negative aeroions and dust under the influence of wind and atmospheric diffusion.
2. Modeling the transport of aeroions under the action of an electric field.
3. Change the field of concentration of aeroion, dust due to their interaction.
The developed method of forecasting was used to solve the task of estimating the level of pollution of working areas in the open air in the presence of a source of emissions: positive aeroions – emis-sions from vehicles and people; dust – traffic; sources of negative aeroions – an ionizer installed in the working zone and the screen (fence), which changes the aerodynamics of the aeroions and dust.
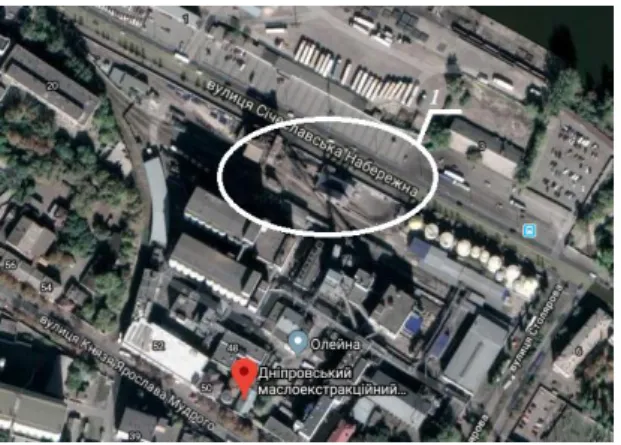
Fig. 1. Modeling area (Google Earth Image, 2019) Dnipro Oil Extraction Plant:
1 – cargo scales
As a research object, the Dnipro Oil Extraction Plant was chosen, namely, the territory where the cargo scales (Fig. 1) operate, where the lorries with seeds arrive. This area is a source of dust, positive aeroions, and workers responsible for unloading cars are constantly under the influence of these negative factors.
Scheme of the calculated area is presented in Fig. 2
Creative Commons Attribution 4.0 International
Fig. 6, Fig. 8 show the percentage distribution of negative, positive aeroions and dust concentrations in the working area at the height of 1.7 m.
Fig. 2. Scheme of the calculated area:
1 – emission source (car), 2 – emission source (dust),
3 – screen, 4 – source of positive aeroions, 5 – working area,
6 – source of negative aeroions (ionizer),
7 – temporary building
Fig. 3. Distribution of negative aeroions concentration,
intersection у=4 м
In Fig. 3 it is evident that at the distance of 3 m from the beginning of the calculated area there are no negative aeroions, since there is no source of emission on this site, and on another section a complex picture of the distribution, which is caused by the movement of the air flow and the action of atmospheric diffusion, is observed.
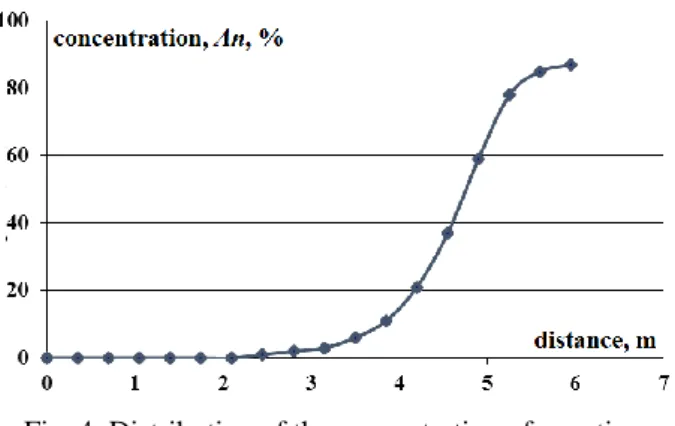
The value of the concentration at the height H = 1.7 m slowly increases under the influence of the emission source and diffusion (Fig. 4).
Fig. 4. Distribution of the concentration of negative aeroions at the height H = 1.7 m, intersection у=4 м
Fig. 5. Distribution of dust concentration, intersection у=4 м
In Fig. 5 it is evident that the entire research ar-ea is filled with dust, due to its intensive allocation on two sites: before the screen – the emission of dust from cars; from the screen to the location of the scales – the work area of the workers. The dust is driven by wind flow and gets into the working area in the open ground. The maximum permissi-ble concentration is MPCa.d.=0.15 mg/m3, so the
dust concentration in this zone exceeds the MPCa.d.by 20%.
Fig. 6. Distribution of dust concentration at the height H = 1.7 m,
Creative Commons Attribution 4.0 International
The dust concentration at the height of
H = 1.7 m slowly increases under the influence of the emission source (motor vehicles), then it is re-duced due to the screen action and decreases at insignificant distance, but under the influence of the source of emissions (workers) increases again and decreases due to changing the flow direction near the awning of the temporary building and dif-fusion (Fig. 6).
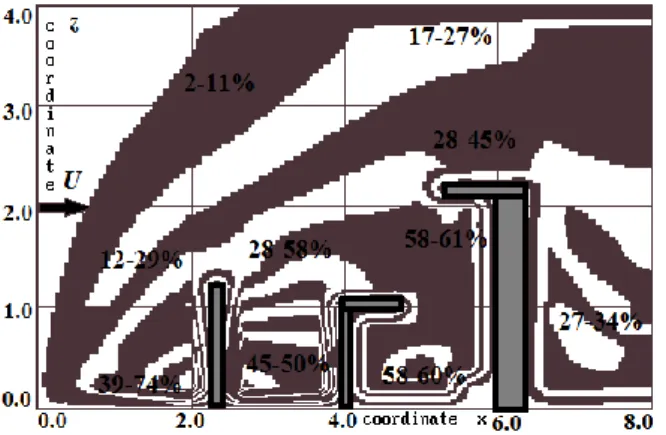
Fig. 7 shows the distribution of positive aeroions.
Fig. 7. Distribution of the concentration of positive aeroions, intersection у=4 м
Apparently, in the working zone there is a dy-namics of growth of positive aeroions, which is caused by the transport of positive aeroions from vehicles (source of emissions – cars) and the emis-sion of positive aeroions from people in the work-ing zone, that is, the interaction of sources of aeroion emissions takes place.
As the dust concentration values, the concentra-tion of positive aeroions slowly increases at the height H = 1.7 m under the action of the emission source of positive aeroions (vehicles), then it is reduced by the screen action and decreases at in-significant distance, but under the influence of the source of emissions (workers) increases again and decreases due to changing the flow direction near the awning of the temporary building and diffusion (Fig. 8).
The optimal level of positive aeroions 1500-3000 ions/cm3, the maximum allowable level
is 50000 ions/cm3, in the working area is observed
exceeding the permissible level by 10%.
Fig. 8. Distribution of the concentration of positive aeroions at the height of H=1.7 m,
intersection у=4 м
Originality and practical value
1. The method of aeroionic mode forecasting in working zones is developed, which is based on three-dimensional modeling of the distribution of negative, positive ions and dust under the influence of wind and diffusion.
2. The peculiarity of the proposed method is the possibility of forecasting the aeroionic mode, taking into account almost all physical factors that signifi-cantly affect the formation of concentration fields of aeroions in working areas at industrial sites.
3. The proposed method of forecasting was used to solve the problem of aeroion assessment in open areas in industrial site in the presence of emission sources: positive aeroions – emissions of vehicles and breathing of people; dust – the movement of workers and vehicles; sources of negative aeroions – ionizer installed in the working zone and the screen, which changes the aerody-namics of aeroions and dust.
4. The regularities of the change in the concen-tration of aeroions and dust at the height of 1.7 m are established, which corresponds to the position of the respiratory organs of the workers.
5. The developed mathematical method of fore-casting can be used to estimate the concentration of aeroions of different polarity and dust.
Creative Commons Attribution 4.0 International Findings
As a result of the conducted research the fol-lowing results were obtained:
– the mathematical method of numerical calcu-lation of the concentration of positive, negative aeroions and dust is proposed;
– the method is not tied to a specific industrial site, it allows estimating the value of the concen-tration of aeroions both locally and in the entire calculated area;
– a physical experiment was conducted
demon-strating the adequacy of the numerical calculation method;
– the results of calculations are useful in terms of ensuring acceptable working conditions in the workplaces of industrial sites, in creating new jobs and reengineering the existing ones.
The prospect of development of this direction is to improve the established method for assessing the parameters of well-being of workers in outdoor areas of industrial sites in the established aeroionic mode.
LIST OF REFERENCE LINKS
1. Беликов, А. С. Некоторые аспекты оптимизации исследования условий труда по микроклимату в про-мышленной индустрии / А. С. Беликов, С. Ю. Рагимов, В. Д. Акиньшин // Будівництво, матеріалознав-ство, машинобудування : зб. наук. пр. / ДВНЗ «Придніпр. держ. акад. буд-ва та архітектури». – Дніпро-петровськ, 2010. – Вип. 52, ч. 2. – С. 3–9.
2. Беляев, Н. Н. Моделирование аэроионного режима в рабочих зонах в условиях искусственной иониза-ции воздуха / Н. Н. Беляев, С. Г. Цыганкова // Наука та прогрес транспорту. – 2016. – № 1 (61). – С. 39– 47. doi: http://doi.org/10.15802/stp2016/60947
3. Водяник, А. О. Методи визначення концентрацій аероіонів та вмісту пилу у повітрі виробничих приміщень // А. О. Водяник, Т. В. Віднічук // Містобудування та територіальне планування : наук.-тех. зб. – Київ, 2013. – Вип. 50. – С. 77–81.
4. Глива, В. А. Дослідження впливу мікрокліматичних параметрів повітрообміну на аероіонний склад повітря робочих приміщень / В. А. Глива // Проблеми охорони праці в Україні : зб. наук. пр. – Київ, 2011. – Вип. 20. – С. 58–65.
5. Запорожець, О. І. Принципи моделювання динаміки аероіонного складу повітря у приміщеннях / О. І. Запорожець, В. А. Глива, О. В. Сидоров // Вісник Національного авіаційного університету. – 2011. – Т. 47, № 2. – С. 120–124. doi: http://dx.doi.org/10.18372/2306-1472.47.24
6. Строкань, О. В. Програмно-інформаційна система оптимізації мікроклімату у виробничому приміщенні / О. В. Строкань // Вісн. Нац. техн. ун-ту «ХПІ». Серія: Нові рішення в сучасних техно-логіях : зб. наук. пр. – Харків, 2014. – № 48 (1090). – С. 91–96.
7. Толкунов, І. О. Дослідження шляхів удосконалення аероіонного режиму робочого середовища приміщень спеціального призначення / І. О. Толкунов // Наука і техніка Повітряних Сил Збройних Сил України. – 2015. – № 1 (18). – С. 197–201.
8. Черный, К. А. Методологический подход к применению коронных аэроионизаторов при проведении коррекции аэроионного состава воздуха помещений / К. А. Черный // Инженерно-строительный жур-нал. – 2012. – № 6 (32). – С. 48–53.
9. Черный, К. А. Современное представление о природе аэроионов и их классификация / К. А. Черный // Безопасность жизнедеятельности. – 2011. – № 7 (127). – С. 15–20.
10. Численное моделирование распространения загрязнения в окружающей среде / М. З. Згуровский, В. В. Скопецкий, В. К. Хрущ, Н. Н. Беляев. – Киев : Наук. думка, 1997. – 368 с.
11. Biliaiev, M. M. Complex of numerical models for computation of air ion concentration in premises / M. M. Biliaiev, S. G. Tsygankova // Наука та прогрес транспорту. – 2016. – № 2 (62). – С. 16–24. doi: http://dx.doi.org/10.15802/stp2016/67281
12. Efficiency of ionizers in removing airborne particles in indoor environments / B. Pushpawela, R. Jayaratne, A. Nguy, L. Morawska // Journal of Electrostatics. – 2017. – Vol. 90. – P. 79–84. doi: http://dx.doi.org/10.1016/j.elstat.2017.10.002
Creative Commons Attribution 4.0 International
14. Numerical and experimental study on airborne disinfection by negative ions in air duct flow / P. Zhou, Y. Yang, G. Huang, A. C. K. Lai // Building and Environment. – 2018. – Vol. 127. – P. 204–210. doi: http://dx.doi.org/10.1016/j.buildenv.2017.11.006
15. Sidorov, А. V. The technique of small air ions concentration measurement at the PC operator workingplace / А. V. Sidorov // Машиностроение и безопасность жизнедеятельности. – 2014. – № 1. – С. 36–41.
16. The impact of the air distribution method in ventilated rooms on the aerosol particle dispersion and removal: The experimental approach / A. Jurelionis, L. Gagytė, T. Prasauskas [et al.] // Energy and Buildings. – 2015. – Vol. 86. – P. 305–313. doi: http://dx.doi.org/10.1016/j.enbuild.2014.10.014
Т. І. РУСАКОВА
1*1*Каф. «Аерогідромеханікa та енергомасоперенос», Дніпровський національний університет імені О. Гончара, вул. Каза-кова, 18, Дніпро, Україна, 49010, тел. +38 (056) 776 82 05, ел. пошта [email protected],
ORCID 0000-0001-5526-3578
МЕТОД ПРОГНОЗУ ПАРАМЕТРІВ АЕРОІОННОГО РЕЖИМУ
В РОБОЧИХ ЗОНАХ НА ВІДКРИТІЙ МІСЦЕВОСТІ
Мета. Наукова робота має на меті розробку нового методу прогнозу аероіонного режиму в робочих зо-нах на промислових майданчиках із урахуванням іонізувальних джерел і навколишніх перешкод.
Методика. Для знаходження концентрації позитивних аероіонів, пилу й негативних аероіонів використано 3D-рівняння масопереносу, що враховує швидкість рекомбінації іонів, які мають різну полярність, і швид-кість рекомбінації іонів із частинками пилу. Чисельне розв’язання ґрунтується на інтегруванні рівнянь ма-сопереносу за допомогою кінцево-різницевого методу, що виявляється стійким для будь-якого кроку за ча-сом. Для визначення компонентів вектора швидкості повітряного потоку використано тривимірну модель потенційної течії, де моделювальним рівнянням виступає рівняння Лапласа для потенціалу швидкості.
Результати. Розроблено математичний метод чисельного розрахунку концентрації позитивних, негативних аероіонів і пилу. Особливістю методу є можливість прогнозу аероіонного режиму з урахуванням практично всіх фізичних факторів, що суттєво впливають на формування концентраційних полів аероіонів у робочих зонах на промислових майданчиках. Метод не прив’язаний до конкретного промислового майданчика, що дозволяє оцінити значення коцентрації аероіонів як локально, так і в усій розрахунковій зоні.
Наукова новизна. Розроблено метод прогнозу аероінного режиму в робочих зонах, який базується на триви-мірному моделюванні розповсюдження негативних, позитивних іероіонів і пилу під дією вітру й дифузії, що дозволяє отримувати результати в кожній точці простору або в конкретному поперечному перерізі.
Практична значимість. Запропонований метод прогнозу було використано для розв’язання задачі з оцінки аероінного режиму в робочих зонах на відкритій місцевості промислового майданчика Дніпровського олійно-екстракційного заводу за наявності джерел емісії: позитивних аероіонів під час роботи автотранспорту й ди-хання працівників; пилу під час руху працівників та автотранспорту; негативних аероіонів іонізатора, встанов-леного в робочій зоні. Виявлено закономірності зміни концентрації аероіонів різної полярності й пилу на висо-ті 1,7 м, що відповідає розташуванню органів дихання працівників. Кількісні результати є необхідними для оцінки допустимих умов праці на робочих місцях промислових майданчиків підприємств і під час створення нових робочих місць і реінжинірингу наявних.
Ключові слова: іонізація повітря; джерела емісії іонів; чисельний метод; промисловий майданчик; конце-нтрація аероіонів
Т. И. РУСАКОВА
1*1*Каф. «Аэрогидромеханика и энергомассоперенос», Днипровский национальный университет имени О. Гончара, ул. Казакова, 18, Днипро, Украина, 49010, тел. +38 (056) 776 82 05, эл. почта [email protected],
Creative Commons Attribution 4.0 International
МЕТОД ПРОГНОЗА ПАРАМЕТРОВ АЭРОИОННОГО РЕЖИМА
В РАБОЧИХ ЗОНАХ НА ОТКРЫТОЙ МЕСТНОСТИ
Цель. Научная работа посвящена разработке нового метода прогноза аэроионного режима в рабочих зонах на промышленных площадках с учетом ионизирующих источников и окружающих препятствий.
Методика. Для нахождения концентрации положительных аэроионов, пыли и отрицательных аэроионов использованы 3D-уравнения массопереноса, учитывающие скорость рекомбинации ионов, имеющих разную полярность, и скорость рекомбинации ионов с частицами пыли. Численное решение основывается на инте-грировании уравнений массопереноса с помощью конечно-разностного метода, который оказывается устой-чивым для любого шага по времени. Для определения компонент вектора скорости воздушного потока ис-пользована трехмерная модель потенциального течения, где моделирующим уравнением выступает уравне-ние Лапласа для потенциала скорости. Результаты. Разработан математический метод численного расчета концентрации положительных, отрицательных аэроионов и пыли. Особенностью метода является возмож-ность прогноза аэроионного режима с учетом практически всех физических факторов, существенно влияю-щих на формирование концентрационных полей аэроионов в рабочих зонах на промышленных площадках. Метод не привязан к конкретной промышленной площадке, что позволяет оценить значение концентрации аэроионов как локально, так и во всей расчетной области. Научная новизна. Разработан метод прогноза аэроионного режима в рабочих зонах, основанный на трехмерном моделировании распространения отрицательных, положительных аэроионов и пыли под действием ветра и диффузии, что позволяет получать результаты в каждой точке пространства или в конкретном поперечном сечении.
Практическая значимость. Предложенный метод прогноза был использован для решения задачи по оценке аэроионного режима в рабочих зонах на открытой местности промышленной площадки Днипровского мас-лоэкстракционного завода при наличии источников эмиссии: положительных аэроионов во время работы автотранспорта и дыхания работников; пыли во время движения работников и автотранспорта; отрицатель-ных аэроионов ионизатора, установленного в рабочей зоне. Выявлены закономерности изменения концен-трации аэроионов различной полярности и пыли на высоте 1,7 м, что соответствует расположению органов дыхания работников. Количественные результаты необходимы при оценке допустимых условий труда на рабочих местах промышленных площадок предприятий и при создании новых рабочих мест и реинжини-ринге существующих.
Ключевые слова: ионизация воздуха; источники эмиссии ионов; численный метод; промышленная пло-щадка; концентрация аэроионов
REFERENCES
1. Belikov, A. S., Ragimov, S. Y., & Akinshin, V. D. (2010). Some aspects of the optimization of the study of working conditions on the microclimate in the industrial industry. Construction, material science, mechanical engineering, 52, 3-9. (in Russian)
2. Biliaiev, M. M., & Tsygankova, S. G. (2016). Modeling of the aeroionic mode in working zones in the condi-tions of artificial ionization of air. Science and Transport Progress, 1(61), 39-47. doi: http://doi.org/10.15802/stp2016/60947 (in Russian)
3. Vodianyk, A. O., & Vidnichuk, T. V. (2013). Metody vyznachennia kontsentratsii aeroioniv ta vmistu pylu u povitri vyrobnychykh prymishchen. Mistobuduvannia ta terytorialne planuvannia, 50, 77-81. (in Ukrainian) 4. Hlyva, V. A. (2011). Doslidzhennia vplyvu mikroklimatychnykh parametriv povitroobminu na aeroionnyi
sklad povitria robochykh prymishchen. Problemy okhorony pratsi v Ukraini, 20, 58-65. (in Ukrainian)
5. Zaporozhets,O. I., Hlyva, V. A., & Sidorov, O. V. (2011). The Principles of Modeling of Dynamics of Ionic Composition of Indoor Air. Proceedings of the National Aviation University, 47(2), 120-124. doi: http://dx.doi.org/10.18372/2306-1472.47.24 (in Ukrainian)
6. Strokan, O. V. (2014). Prohramno-informatsiina systema optymizatsii mikroklimatu u vyrobnychomu pry-mishchenni. Bulletin of the National Technical University «KhPI». Series: New solutions in modern tech-nologies, 48(1090), 91-96. (in Ukrainian)
7. Tolkunov, I. O. (2015). Study Ways to Improve the Air Ion Mode in the Work Environment Facilities for Spe-cial Purposes. Science and technology of the air force of Ukraine, 1(18), 197-201. (in Ukrainian)
Creative Commons Attribution 4.0 International
9. Chernyy, K. A. (2011). The up-to-date knowledge on the air ions nature and their classification. Bezopasnost’ Zhiznedeatel’nosti, 7(127), 15-20. (in Russian)
10. Zgurovskiy, M. Z., Skopetskiy, V. V., Khrushch, V. K., & Belyaev, N. N. (1997). Chislennoe modelirovanie rasprostraneniya zagryazneniya v okruzhayushchey srede. Kуiv: Naukova dumka. (in Russian)
11. Biliaiev, M. M., & Tsygankova, S. G. (2016). Complex of numerical models for computation of air ion con-centration in premises. Science and Transport Progress, 2(62), 16-24. doi: http://dx.doi.org/10.15802/stp2016/67281 (in English)
12. Pushpawela, B., Jayaratne, R., Nguy, A., & Morawska, L. (2107). Efficiency of ionizers in removing airborne particles in indoor environments. Journal of Electrostatics, 90, 79-84. doi: http://dx.doi.org/10.1016/j.elstat.2017.10.002 (in English)
13. Zhao, X., Li, Y., Hua, T., Jiang, P., Yin, X., Yu, J., & Ding, B. (2017). Low-Resistance Dual-Purpose Air Filter Releasing Negative Ions and Effectively Capturing PM2.5. ACS Applied Materials & Interfaces, 9(13), 12054-12063. doi: http://dx.doi.org/10.1021/acsami.7b00351 (in English)
14. Zhou, P., Yang, Y., Huang, G., & Lai, A. C. K. (2018). Numerical and experimental study on airborne disinfection by negative ions in air duct flow. Building and Environment, 127, 204-210. doi: http://dx.doi.org/10.1016/j.buildenv.2017.11.006 (in English)
15. Sidorov, А. V. (2014). The technique of small air ions concentration measurement at the PC operator working place. Engineering industry and life safety, 1, 36-41. (in English)
16. Jurelionis, A., Gagytė, L., Prasauskas, T., Čiužas, D., Krugly, E., Šeduikytė, L., & Martuzevičius, D. (2015). The impact of the air distribution method in ventilated rooms on the aerosol particle dispersion and removal: The experimental approach. Energy and Buildings, 86, 305-313. doi: http://dx.doi.org/10.1016/j.enbuild.2014.10.014 (in English)