Original Research Article
Filipino head and neck cancer patients and their quality of life
Frederic Ivan L. Ting
1*, Aylmer Rex B. Hernandez
1, Reno Eufemon P. Cereno
2,
Irisyl B. Orolfo-Real
1, Corazon A. Ngelangel
1INTRODUCTION
Head and neck cancer (HNC) is the 10th most common
cancer in the world, and accounts for more than 0.5 million cases and 380,000 deaths annually.1,2 In the
Philippines, there were more than 7,400 new HNC cases diagnosed in 2015 alone accounting for 6% of all cancers diagnosed on that year.3 The main risk factors associated
with HNCs are cigarette (tobacco) smoking, alcoholic drinking, and infections such as human papillomavirus (HPV) and Epstein-Barr virus (EBV).
In today’s age of oncologic advancements where treatment effectiveness is mainly measured through traditional endpoints such as over-all survival (OS) and progression-free survival (PFS) rates, the need for quality of life (QoL) data could not be overemphasized.4 In HNC
management, assessment of QoL outcomes is especially important because of its potential impact on patients not only on their basic human functions such as talking, eating, and breathing, but also on their physical appearance, and their manner of communication.
ABSTRACT
Background: In the management of head and neck cancer (HNC), assessment of quality of life (QoL) is imperative because of the potentially debilitating effect of treatment toxicities. Currently, there are no published data assessing the QoL in Filipino HNC patients, thus this study.
Methods: This cross-sectional study utilized the University of the Philippines - Department of Health Quality of Life scale. Patients with head and neck cancers at the University of the Philippines - Philippine General Hospital from February to September 2019 were invited to participate.
Results: A total of 418 patients were included in the study with a mean age of 42 years old (range 18 to 73 years old). In general, Filipino head and neck cancer patients had moderate QoL (mean score of 4.59±0.79). All of the QoL domains (physical, emotional, cognitive, and related functions) had a score of 3-5 (moderate), except for the social status domain which had a mean score of 5.51±0.83 (high). Among socio-demographic factors, patients who are employed and with additional funding sources on top of their income have better global QoL (p<0.01). Clinically, patients with higher stages of disease, fungating tumors, post-laryngectomy, have a feeding tube, with a tracheostomy, and had chemotherapy have lower global QoL (p<0.01).
Conclusions: Filipino patients with head and neck cancers have an overall moderate quality of life, with high scores in the social domain. Patients with higher tumor burdens and have been exposed to chemotherapy have lower QoL scores, while patients with financial stability and aid have better QoL scores.
Keywords: Quality of life, Head and neck cancer, Filipino
1Division of Medical Oncology, Department of Medicine, 2Division of Radiation Oncology, University of the
Philippines - Philippine General Hospital, Manila, Philippines
Received: 17 December 2019
Revised: 01 February 2020
Accepted: 03 February 2020
*Correspondence:
Dr. Frederic Ivan L. Ting, E-mail: fredtingmd@gmail.com
Copyright: © the author(s), publisher and licensee Medip Academy. This is an open-access article distributed under the terms of the Creative Commons Attribution Non-Commercial License, which permits unrestricted non-commercial use, distribution, and reproduction in any medium, provided the original work is properly cited.
A number of researches have studied QoL among HNC patients, and have concluded that demographic data, health behaviors, tumor and clinical characteristics, as well as treatment regimens have significant relationships to QoL.5-11
In 1997, the University of the Philippines - Department of Health (UP-DOH) QoL scale was created and validated to be a culturally appropriate tool in measuring the QoL of Filipino cancer patients.12 Unfortunately, there are
presently no Filipino QoL studies using it as a tool probably because of the scarcity of QoL studies not only in the Philippines but worldwide.
Despite improvements in the survival rates of HNC patients with the advent of advances in oncologic treatment, oncologists should remember that QoL assessment is already considered to be an essential part of the general “wholistic” assessment and management of cancer patients.13-17 Likewise, oncologists should not
forget the fact that patients may not have treatment benefits in terms of the previously mentioned traditional endpoints (OS and PFS), but it is still possible to see changes in their QoL.18-24
This study aimed to identify clinical predictors of QoL in Filipino HNC patients. The data gathered can hopefully be used to facilitate delivery of the best possible quality of care to our Filipino HNC patients that can improve their QoL. Further studies can also be done to identify interventions that could uplift and maintain the highest possible QoL for these patients.
Objectives General
This study aimed to identify clinical predictors of QoL in Filipino HNC patients.
Specific
Specifically, this study aimed to evaluate the QoL profile of Filipino HNC patients; to identify demographic factors that influence QoL in Filipino HNC patients and to investigate clinical disease variables that significantly impact QoL in Filipino HNC patients.
METHODS
Study design and setting
This was a cross-sectional analytical study. HNC patients seeking care at the Out-Patient clinics and In-Patient Wards of the Departments of Medical Oncology, Radiation Oncology, and Otorhinolaryngology of the University of the Philippines - Philippine General Hospital from January to June 2019 were invited to take part in the study. Data regarding QoL in Filipino HNC
patients were collected by using a survey (UP-DOH QOL scale) through convenience sampling.
Inclusion criteria
Patients with pathologically diagnosed HNC at any stage, regardless of the treatment regimens or phase they are in; should be at least 18 years old; able to read or comprehend Tagalog; willing to answer the survey were included.
Exclusion criteria
Pregnant patients, since nausea, vomiting, and fatigue maybe inherent in these population; patients with severe unstable psychiatric or mental conditions such as acute psychosis or dementia; refusal to answer the survey were excluded.
Survey questionnaire
The University of the Philippines (UP) Department of Epidemiology was commissioned by the Department of Health (DOH) (under the Philippine Cancer Control Program) to make a QoL scale for Filipinos. The UP-DOH QoL scale was developed in 1996, to be a culture-appropriate validated instrument to measure the QoL of Filipino cancer patients. Items are grouped into the following domains: physical wellness (13 items), emotional well-being (8 items), social status (3 items), cognitive status (5 items) and self-care or related functions (4 items).
The resulting mean score for the entire scale, represents the global QoL, and ranges from 1 to 7, where 1 referred as the lowest score and 7 to the highest QoL score. The higher the score, the better is the quality of life. For the interpretation of scores for each domain, the following scoring system can be used: a high QoL will have a mean score of 5.01-7.00, moderate QoL signifies a score of 3.01-5.00, and the QoL will be considered low when the is 1.00-3.00.25
Statistical analysis
less than 0.05 using two-tailed comparisons. Multiple comparisons procedure using the Fisher-Hayter technique were used to determine differences between more than two groups from the one-way ANOVA. Data processing and analysis were carried out using the software Stata 13.
RESULTS
A total of 418 patients were included in the study with a median age of 42 years old (range: 18 to 73). The mean time from the diagnosis to the study interview was 11 months (SD±10.47 months, median of 9 months, maximum of 96 months); while the average from the time of surgery to data collection was 4 months (SD±9.88 months, median of 1 month, max of 120 months). The average tumor size noted in the study population was
about 4 centimeters (SD±2.01 centimeters, max of 13 cm). Further details of the socio-demographic characteristics of the participants across their QoL rating can be seen in Table 1.
It can be noted that employed patients have a better QoL than otherwise (p<0.01). Also, patients with other sources of health care financing on top of their personal savings have higher global QoL scores (p<0.01). Furthermore, patients with tumors in the thyroid gland, hypopharynx, and other sites (lymphoma, parotid gland, skin) have significantly higher ratings in their overall QoL as compared with patients who have tumors in the oropharynx and ethmoid sinuses (p<0.01). At the same time, patients with tumor stage 0 to 1 have significantly higher ratings than the other disease stages (p<0.01).
Table 1: Baseline characteristics of the study population.
Characteristics Frequency (%) Global QoL P value
Gender
Male 238 (56.94) 4.58±0.67
0.87
Female 180 (43.06) 4.59±0.92
Marital status
Single 11 (2.63) 4.88±0.45
0.07 With a partner 407 (97.37) 4.58±0.79
Presence of support
Family 388 (92.82) 4.57±0.79
0.07
Friends 11 (2.63) 4.79±0.83
Both 13 (3.11) 4.58±0.62
None 6 (1.44) 5.37±0.48
Education level
High school level 300 (71.77) 4.53±0.84
0.06 College level 100 (23.92) 4.71±0.63
College graduate 18 (4.31) 4.84±0.61
Employed
Yes 176 (42.11) 4.78±0.61
<0.01*
No 242 (57.89) 4.45±0.87
Breadwinner of family
Yes 174 (41.63) 4.61±0.67
0.58
No 244 (58.37) 4.57±0.86
Ownership of house
Yes 166 (39.71) 4.63±0.80
0.40
No 252 (60.29) 4.56±0.78
Source of finances
Own savings/income 66 (15.79) 4.67±0.59
<0.01*
Philhealth 231 (55.26) 4.45±0.83
Relatives 55 (13.16) 4.53±0.73
Others 66 (15.79) 5.03±0.66
Location
Out-patient 294 (70.33) 4.56±0.79
0.34
In-patient 124 (29.67) 4.64±0.77
Risk factors
Smoking 84 (20.10) 4.58±0.97
0.60 Alcohol drinking 51 (12.20) 4.69±0.74
Both 283 (67.70) 4.57±0.73
Characteristics Frequency (%) Global QoL P value
Tumor sites
Oropharynx 19 (4.55) 4.29±0.75
<0.01*
Hypopharynx 26 (6.22) 4.74±0.53
Larynx 56 (13.40) 4.42±0.71
Oral cavity 99 (23.68) 4.71±0.75
Nasopharynx 148 (35.41) 4.44±0.82
Thyroid 20 (4.78) 5.52±0.51
Ethmoid sinus 12 (2.87) 3.76±0.54
Maxillary sinus 16 (3.83) 4.61±0.65
Others 5.11±0.47
Lymphoma 5 (1.20)
Parotid gland 6 (1.44)
Skin 11 (2.64)
Tumor stage
0-1 16 (3.83) 5.21±0.62
<0.01*
II 89 (21.29) 4.90±0.74
III 163 (39) 4.51±0.57
IV 150 (35.89) 4.42±0.94
Fungating tumor appearance
<0.01*
Yes 86 (20.57) 4.34±0.91
No 332 (79.43) 4.65±0.74
Procedures done
Post-surgery (excluding laryngectomy) 229 (54.78) 4.85±0.66 <0.01*
Post-neck dissection 200 (47.85) 4.79±0.66 <0.01*
Post-laryngectomy 50 (11.96) 4.31±0.75 <0.01*
Feeding tube insertion 94 (22.49) 3.83±0.82 <0.01*
Tracheostomy placement 84 (20.10) 4.15±0.79 <0.01*
None 146 (34.93) 4.82±0.80
Radiation (ongoing/done) 42 (10.05) 5.14±0.46
<0.01*
Chemo (ongoing/done) 22 (5.26) 4.17±1.13 Chemo-RT (ongoing/done) 208 (49.76) 4.36±0.68
Presence of comorbidities
No other conditions 297 (71.05) 4.74±0.63
<0.01*
Pulmonary conditions 48 (11.48) 3.90±0.62 Cardiovascular conditions 21 (5.02) 4.35±0.88
Stroke 7 (1.67) 3.64±0.65
Diabetes 41 (9.81) 4.51±1.28
Psychiatric problems 2 (0.48) 4.36±0
Pertinent symptoms noted
PAIN 288 (68.90) 4.32±0.75 <0.01*
Median VAS score 2 (5) [0-10] - 0.4871 <0.01*
Problems with seeing 152 (36.36) 4.27±0.81 <0.01*
Problems with feeding 315 (75.36) 4.39±0.76 <0.01*
Problems with hearing 267 (63.88) 4.28±0.71 <0.01*
Problems with taste 288 (68.90) 4.36±0.73 <0.01* *p<0.05, statistically significant.
Moreover, patients whose tumors have fungating appearance, are post-laryngectomy, have a feeding tube, and have a tracheostomy have lower QoL scores (p<0.01). Interestingly, patients who underwent surgery (excluding laryngectomy) and neck dissection have higher QoL scores (p<0.01). In terms of treatment, patients who received radiation or have not yet undergone
any treatment have higher QoL ratings as compared with those who received chemotherapy, and combined radiation and chemotherapy (p<0.01).
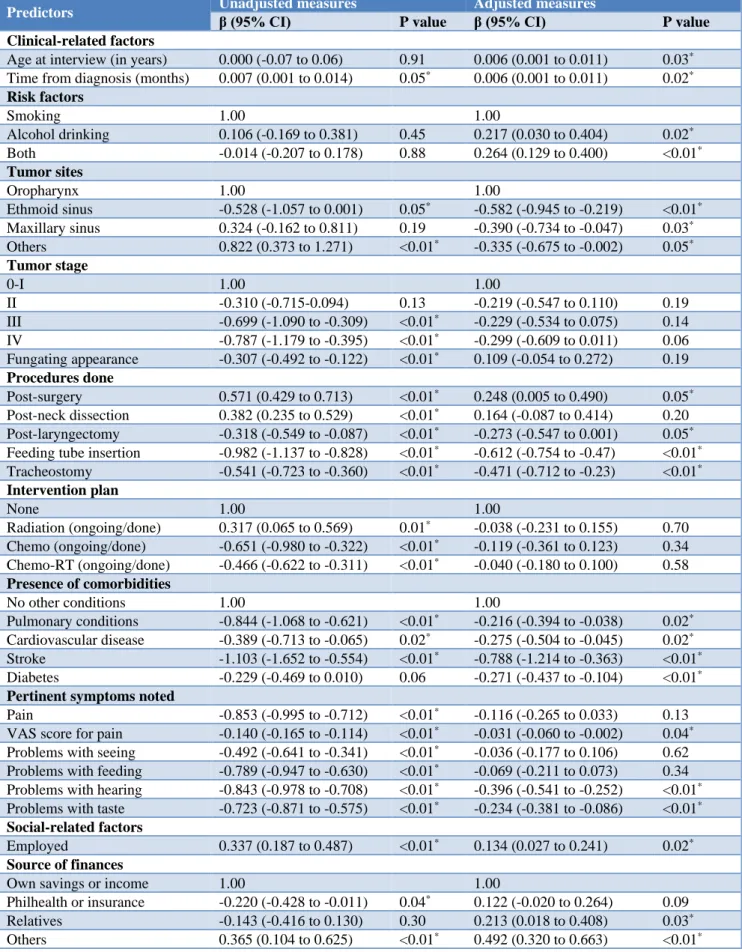
Table 2: Multiple linear regression for the perceived quality of life across variables.
Predictors Unadjusted measures β (95% CI) Adjusted measures
P value β (95% CI) P value
Clinical-related factors
Age at interview (in years) 0.000 (-0.07 to 0.06) 0.91 0.006 (0.001 to 0.011) 0.03*
Time from diagnosis (months) 0.007 (0.001 to 0.014) 0.05* 0.006 (0.001 to 0.011) 0.02* Risk factors
Smoking 1.00 1.00
Alcohol drinking 0.106 (-0.169 to 0.381) 0.45 0.217 (0.030 to 0.404) 0.02*
Both -0.014 (-0.207 to 0.178) 0.88 0.264 (0.129 to 0.400) <0.01* Tumor sites
Oropharynx 1.00 1.00
Ethmoid sinus -0.528 (-1.057 to 0.001) 0.05* -0.582 (-0.945 to -0.219) <0.01*
Maxillary sinus 0.324 (-0.162 to 0.811) 0.19 -0.390 (-0.734 to -0.047) 0.03*
Others 0.822 (0.373 to 1.271) <0.01* -0.335 (-0.675 to -0.002) 0.05* Tumor stage
0-I 1.00 1.00
II -0.310 (-0.715-0.094) 0.13 -0.219 (-0.547 to 0.110) 0.19 III -0.699 (-1.090 to -0.309) <0.01* -0.229 (-0.534 to 0.075) 0.14
IV -0.787 (-1.179 to -0.395) <0.01* -0.299 (-0.609 to 0.011) 0.06
Fungating appearance -0.307 (-0.492 to -0.122) <0.01* 0.109 (-0.054 to 0.272) 0.19 Procedures done
Post-surgery 0.571 (0.429 to 0.713) <0.01* 0.248 (0.005 to 0.490) 0.05*
Post-neck dissection 0.382 (0.235 to 0.529) <0.01* 0.164 (-0.087 to 0.414) 0.20
Post-laryngectomy -0.318 (-0.549 to -0.087) <0.01* -0.273 (-0.547 to 0.001) 0.05*
Feeding tube insertion -0.982 (-1.137 to -0.828) <0.01* -0.612 (-0.754 to -0.47) <0.01*
Tracheostomy -0.541 (-0.723 to -0.360) <0.01* -0.471 (-0.712 to -0.23) <0.01* Intervention plan
None 1.00 1.00
Radiation (ongoing/done) 0.317 (0.065 to 0.569) 0.01* -0.038 (-0.231 to 0.155) 0.70
Chemo (ongoing/done) -0.651 (-0.980 to -0.322) <0.01* -0.119 (-0.361 to 0.123) 0.34
Chemo-RT (ongoing/done) -0.466 (-0.622 to -0.311) <0.01* -0.040 (-0.180 to 0.100) 0.58 Presence of comorbidities
No other conditions 1.00 1.00
Pulmonary conditions -0.844 (-1.068 to -0.621) <0.01* -0.216 (-0.394 to -0.038) 0.02*
Cardiovascular disease -0.389 (-0.713 to -0.065) 0.02* -0.275 (-0.504 to -0.045) 0.02*
Stroke -1.103 (-1.652 to -0.554) <0.01* -0.788 (-1.214 to -0.363) <0.01*
Diabetes -0.229 (-0.469 to 0.010) 0.06 -0.271 (-0.437 to -0.104) <0.01* Pertinent symptoms noted
Pain -0.853 (-0.995 to -0.712) <0.01* -0.116 (-0.265 to 0.033) 0.13
VAS score for pain -0.140 (-0.165 to -0.114) <0.01* -0.031 (-0.060 to -0.002) 0.04*
Problems with seeing -0.492 (-0.641 to -0.341) <0.01* -0.036 (-0.177 to 0.106) 0.62
Problems with feeding -0.789 (-0.947 to -0.630) <0.01* -0.069 (-0.211 to 0.073) 0.34
Problems with hearing -0.843 (-0.978 to -0.708) <0.01* -0.396 (-0.541 to -0.252) <0.01*
Problems with taste -0.723 (-0.871 to -0.575) <0.01* -0.234 (-0.381 to -0.086) <0.01* Social-related factors
Employed 0.337 (0.187 to 0.487) <0.01* 0.134 (0.027 to 0.241) 0.02* Source of finances
Own savings or income 1.00 1.00
Philhealth or insurance -0.220 (-0.428 to -0.011) 0.04* 0.122 (-0.020 to 0.264) 0.09
Relatives -0.143 (-0.416 to 0.130) 0.30 0.213 (0.018 to 0.408) 0.03*
Patients who experience pain, problems with seeing, feeding, hearing, and tasting have lower perceived QoL (p<0.01). At the same time, it can be said that there is a moderate negative relationship between VAS-measured pain score using the Spearman's rho rank correlation - suggesting that a higher degree of pain is associated with a lower quality of life. The patients’ QoL has also been noted to increase as the time from surgery increases (p<0.01) and is noted to decrease as the tumor size increases (p<0.01). No correlation was noted between perceived QoL versus age and time from diagnosis.
The unadjusted measures of the linear regression suggest the contribution of select variables with the overall rating for the QoL such as the time from diagnosis, tumor site and stage, procedures performed, intervention plan, presence of pertinent symptoms; social support, level of education, employment and source of health care financing. However, an adjusted model to account for all the variables was developed with an adjusted R-squared of 73.19% (p<0.01).
The results of the multiple linear regression (Table 2) accounting for all the variables considered are very much similar with the results in the previous table. It can be noted that those who were exposed to both smoking and alcoholic drinks had slightly better QoL than those who only had 1 risk factor. The contribution of age in years with the perceived QoL suggests that older patients have better QoL scores.
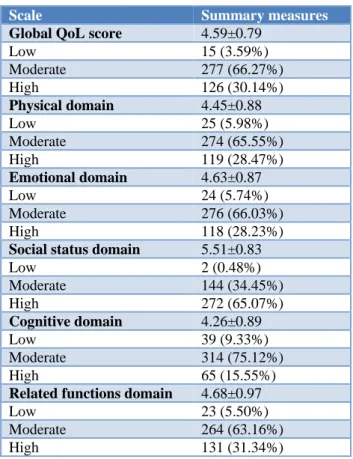
Table 3: Distribution of the perceived quality of life among the study population.
Scale Summary measures
Global QoL score 4.59±0.79
Low 15 (3.59%)
Moderate 277 (66.27%) High 126 (30.14%)
Physical domain 4.45±0.88
Low 25 (5.98%)
Moderate 274 (65.55%) High 119 (28.47%)
Emotional domain 4.63±0.87
Low 24 (5.74%)
Moderate 276 (66.03%) High 118 (28.23%)
Social status domain 5.51±0.83
Low 2 (0.48%)
Moderate 144 (34.45%) High 272 (65.07%)
Cognitive domain 4.26±0.89
Low 39 (9.33%)
Moderate 314 (75.12%) High 65 (15.55%)
Related functions domain 4.68±0.97
Low 23 (5.50%)
Moderate 264 (63.16%) High 131 (31.34%)
Tumor sites at the ethmoid sinus, maxillary sinus, and other sites (lymphoma, parotid gland, skin) are associated with a significantly decreased QoL score. The presence of stroke and other cardiovascular conditions; and problems with hearing and taste - all appeared to also significantly reduce the perceived overall QoL among these patients. On the other hand, the presence of additional sources of health financing (on top of personal savings) and being employed significantly improve their perceived quality of life.
Overall, the global QoL score of the respondents was moderate (score= 4.59±0.79, Table 3). Also, most of the domains showed moderate QoL except for the Social Status domain which showed a high QoL (score= 5.51±0.83).
DISCUSSION
Demographic factors
In an estimate of Philippine cancer prevalence in 2015, although females were noted to have a higher number of cancer cases overall, pharyngeal and laryngeal cancers were expected to be more prevalent in males.28 Similarly,
the male-to-female ratio for head and neck squamous cell carcinomas was 7:3 in a single institutional retrospective report in the Philippines.26 In our study, however, no
significant difference between the number of males and females was noted. The median age at diagnosis of 42 years in our study was also younger than the 61.5 years reported by Albano et al.26 This apparent shift in sex and
age demography should be validated by a retrospective review of records of HNC patients in our institution.
Our study revealed that employed patients had a significantly better quality of life. Particularly for cancer survivors, QoL was reportedly higher among working patients, but employment-related QoL was reported to be poor in some studies.27,29,30 Categorizing patients into
treatment status in future QoL surveys could further elucidate whether patient employment is indeed beneficial to QoL.
Sourcing finances from relatives and others were found to significantly improve patient QoL. Having Philhealth (the country’s national insurance) coverage, on the other hand, did not appear to affect patient QoL positively. Whether these findings are related to out-of-pocket expenses incurred due to inadequacy of Philhealth coverage, and to the lessened financial burden by having external financial sources for these out-of-pocket expenses, are however outside the scope of this study and could be better addressed by studies on health economics.
Clinical factors
oropharynx and ethmoid sinuses. This is consistent with a similar Brazilian study which found that the presence of tumors in the tongue and pharynx is associated with poorer QoL.31 As compared to thyroid gland, parotid
gland, and skin, the aerodigestive tracts (oral cavity, pharynx, and larynx) are the sites of function of hearing, swallowing, speech and breathing which are equally essential in social functioning.32 Hence, tumors affecting
these vital areas are expected to cause negative impacts on the aforementioned basic functions.
Patients whose tumor stage is limited to 0 or 1 have significantly higher QoL ratings compared to more advanced stages. This is in harmony with previous findings that advanced HNCs produces the worst decline in QoL.33,35,36 It is presumed that the aggressiveness of
the therapy produces these dismal findings.33
Interestingly, another earlier study found no difference in QoL with advancing stage.34
On the other hand, patients who have fungating tumor(s), are post-laryngectomy, have a feeding tube, and have a tracheostomy have lower QoL ratings. These findings are consistent with a similar American study which found that the presence of feeding tube, tracheostomy tube, and laryngectomy are strong clinical predictors of a poor QoL. Besides the physical alteration, the presence of these contraptions seem to remind the patients the presence of their disease despite the completion of cancer-directed treatments.34
Surprisingly, patients who underwent surgery (excluding laryngectomy) and neck dissection have higher QoL ratings. Previous studies showed that laryngectomy is consistently related to a poorer QoL and surgery of primary site is related to a lesser magnitude of decline in QoL compared to chemotherapy and radiation. However, it is new that neck dissection is related to a better QoL. In a previous study, neck dissection in particular is implicated with worse QoL in the physical domain when compared to chemotherapy.34 Studies that would
investigate further the QoL of post-surgery patients with HNCs are therefore warranted.
We also found that patients who received radiation or have not undergone any treatment have higher QoL ratings compared with those who had chemotherapy or combined chemotherapy and radiation. This finding is similar with other studies found in the literature, with chemotherapy as the major predictor of a poor QoL.34
The apparent negative impact of chemotherapy or combined chemotherapy and radiation may be due to the increase in nausea and vomiting, loss of appetite, constipation, and hearing loss which are considered classic sequelae of chemotherapy in the HNCs.31 In
contrast, radiation therapy seems to have a more limited effect to QoL, primarily affecting only the ‘eating domain’.34-36
Our study shows that patients who do not have comorbidities have higher overall QoL. This finding is
similar to a study done in China which showed that the presence of comorbidities in cancer patients was generally associated with lower QoL scores.37
Furthermore, our study shows that patients who have persistent symptoms such as pain and those with problems with seeing, feeding, hearing, and tasting have a lower perceived quality of life. A study done in Brazil also had similar findings where the authors found out that the severity of pain directly affected the patients’ QoL.38
QoL was also noted to improve as the time from surgery increases and with increased age; and decrease as tumor size increases. These findings are similar to a study done in the US,34 but unlike their results our study showed that
patients who were exposed to both smoking and alcoholic drinks had slightly better QoL than those who only had 1 risk factor. The authors assume that those patients who are able to support two vices at the same time have more financial capacity and are well enough to still be able to smoke and drink -but a separate study exploring this association is suggested.
Global QoL
Overall, our study showed that the respondents had a moderate global QoL score. It is significant to note that although most of the domains show moderate QoL, the Social Status domain showed a high QoL. This can be explained by the fact that unlike other cultures, Filipino families are very much supportive of one another not only during times of celebration but also in difficult situations.39 Culturally, Filipinos regard the family as a
structure that provides love, comfort, and security. Its members are generally supportive of each other which may explain the high QoL levels in the social status domain.40 It is the authors’ desire that these Filipino
values are maintained despite the changing times.
Limitations
The inherent characteristics of the cross-sectional design of this study is its major limitation.
CONCLUSION
Filipino patients with HNCs have an overall moderate quality of life, with high scores in the social domain. Patients with higher tumor burdens and have been exposed to chemotherapy have lower QoL scores, while patients with financial stability and aid have better QoL scores.
Recommendations
Studies on how to decrease the toxicity of the chemotherapy regimens commonly used in treating head and neck Filipino cancer patients is strongly suggested. Since most chemotherapy dose algorithms that we currently follow are based from clinical trials done in other countries, a dose exploration study for Filipinos is suggested.
As this study shows a positive correlation to the patients’ QoL, campaigns and programs to support funding of the treatment of Filipino HNC patients are recommended.
ACKNOWLEDGEMENTS
The authors are indebted to all members of the Research Committee of the Divisions of Medical Oncology and the Department of Medicine. The authors would also like to thank the Departments of Otorhinolaryngology Head and Neck Surgery, Radiation Oncology, and Surgery. The authors especially thank Mr. Alvin Sy for his statistical expertise.
Funding: No funding sources Conflict of interest: None declared
Ethical approval: The study was approved by the Institutional Ethics Committee
REFERENCES
1. Yeole B, Sankaranarayanan R, Sunny L, Swaminathan R, Parkin DM. Survival from head and neck cancer in Mumbai (Bombay), India. Am Cancer Soc. 2000;89:437-4.
2. Fitzmaurice C, Allen C, Barber RM, Barregard L, Bhutta ZA, Brenner H, et al. Global, Regional, and National Cancer Incidence, Mortality, Years of Life Lost, Years Lived With Disability, and Disability-Adjusted Life-years for 32 Cancer Groups, 1990 to 2015: A Systematic Analysis for the Global Burden of Disease Study. JAMA Oncol. 2017;3(2):524-48. 3. Laudico A, Lumague M, Medina V, Mapua C,
Valenzuela F, Pukkala E. Philippine Cancer Facts and Estimates 2015. Philippine cancer Society. 2015.
4. Gyawali B, Hwang T. Prevalence of quality of life (QoL) outcomes and association with survival in cancer clinical trials. J Clin Oncol. 2018;36:6573-3. 5. Allison PJ, Locker D, Wood-Dauphinee S, Black M,
Feine JS. Correlates of health related quality of life in upper aerodigestive tract cancer patients. Qual Life Res. 1998;7:713-22.
6. Bjordal K, Kaasa S, Mastekaasa A. Quality of life in patients treated for head and neck cancer: a follow-up study 7 to 11 years after radiotherapy. Int J Radiat Oncol Biol Phys. 1994;28:847-56.
7. de Graeff A, de Leeuw JR, Ros WJ, Hordijk GJ, Blijham GH, Winnubst JA. Long term quality of life of patients with head and neck cancer. Laryngoscope. 2000;110:98-106.
8. Nguyen NP, Sallah S, Karlsson U, Antoine JE. Combined chemotherapy and radiation therapy for head and neck malignancies: quality of life issues. Cancer. 2002;94:1131-41.
9. Huguenin PU, Taussky D, Moe K, Meister A, Baumert B, Lütolf UM, et al. Quality of life in patients cured from a carcinoma of the head and neck by radiotherapy: the importance of the target volume. Int J Radiat Oncol Biol Phys. 1999;45:47-52.
10. De Santo LW, Olsen KD, Perry WC, Rohe DE, Keith RL. Quality of life after surgical treatment of cancer of the larynx. Ann Otol Rhinol Laryngol. 1995;104(10):763-9.
11. Schliephake H, Jamil MU. Impact of intraoral soft-tissue reconstruction on the development of quality of life after ablative surgery in patients with oral cancer. Plast Reconstr Surg. 2002;109:421-30. 12. Ramiro LS, Ngelangel CA, Amarillo ML. The
UP-DOH QOL Scale: Measures of quality of life of Filipino cancer patients. Philippine J Internal Med. 1997;5:179-88.
13. Spilker B, editor. Quality of life and pharmacoeconomics in clinical trials. 2nd ed. New York: Raven Press; 1996: 1-10.
14. Varricchio CG, McCabe MS, Trimble E, Korn EL. Quality of Life in Clinical Cancer Trials. Introduction. J Natl Cancer Inst Monogr. 1996;20:7-8.
15. Osoba D. Lessons learned from measuring health-related quality of life in oncology. J Clin Oncol. 1994;12:608-16.
16. Feld R. Endpoints in cancer clinical trials: Is there a need for measuring quality of life? Support Care. Cancer 1995;3:23-7.
17. Stephens RJ, Hopwood P, Girling DJ, Machin D. Randomized trials with quality of life endpoints: are doctors' ratings of patients' physical symptoms interchangeable with patients' self-ratings? Qual Life Res. 1997;6:225-36.
18. Titzer ML, Fisch M, Kristellar JL. Clinician's assessment of quality of life (QOL) in outpatients with advanced cancer: how accurate is our prediction? A Hoosier oncology study. Am Soc Clin Oncol. 2001;20:384.
19. Green SB. Does assessment of quality of life in comparative cancer trials make a difference? A discussion. Control Clin Trials. 1997;18:306-10. 20. Kong SX, Gandhi SK. Methodologic assessments of
quality of life measures in clinical trials. Ann Pharmacother. 1997;31:830-6.
21. Smith KW, Avis NE, Assmann SF. Distinguishing between quality of life and health status in quality of life research: a meta-analysis. Qual Life Res. 1999;8:447-59.
23. Osoba D, Rodrigues G, Myles J et al. Interpreting the significance of changes in health-related quality-of-life scores. J Clin Oncol. 1998;16:139-44. 24. Kramer JA, Curran D, Piccart M et al. Identification
and interpretation of clinical and quality of life prognostic factors for survival and response to treatment in first-line chemotherapy in advanced breast cancer. Eur J Cancer. 2000;36:1498-506. 25. Ramiro LS, Ngelangel CA, Amarillo MAL. The
UP-DOH QOL scale: measures of quality of life in Filipino cancer patients. J Clin Epidemiol. 1996;49(1):19.
26. Albano PM, Lumang-Salvador C, Orosa J, Racelis S, Leano M, Angeles LM, et al. Overall survival of Filipino patients with squamous cell carcinoma of the head and neck: a single-institution experience. Asian Pac J Cancer Prev. 2013;14(8):4769-74. 27. Baxi SS, Salz T, Xiao H, Atoria CL, Ho A,
Smith-Marrone S, et al. Employment and return to work following chemoradiation in patient with HPV-related oropharyngeal cancer. Cancers Head Neck. 2016;1(4).
28. Laudico AV, Mirasol-Lumague MR, Medina V, Mapua CA, Valenzuela FG, Pukkala E. Philippine cancer facts and estimates. Philippine Cancer Society. 2015: 1-79.
29. Timperi AW, Ergas IJ, Rehkopf DH, Roh JM, Kwan ML, Kushi LH. Employment status and quality of life in recently diagnosed breast cancer survivors. Psycho-oncology. 2013;22(6):1411-20.
30. Veenstra CM, Wittmann D, McLeod C, Braun T, Hawley ST. Employment outcomes and quality of life in patients with early breast cancer and their support persons: a dyadic study. J Clin Oncol. 2019;37:15:18241.
31. Filho MRDM, Rocha BA, Pires MBDO, Fonseca ES, de Freitas EM, Junior HM. Quality of life of patients with head and neck cancer. Braz J Otorhinolaryngol. 2013;79(1):82-8.
32. La Mantia I, Rossitto F, Andaloro C. Quality of life in head and neck cancer: patients’ and family
caregivers’ perceptions. Egyptian J Ear Nose Throat Allied Sci. 2017;18(3):247-250.
33. Weymuller EAJ, Yuch B, Deleyiannis FWB, Kuntz AL, Alsarrraf R, Coltrera MD. Quality of life in patients with head and neck cancer. Arch Otolharnyngol Head Neck Surg. 2000;126:329-35. 34. Terrell JE, Ronis DL, Fowler KE, Bradford MD,
Chepeha DB, Prince ME, et al. Clinical predictors of quality of life in patients with head and neck cancer. Arch Otolharnyngol Head Neck Surg. 2004;130:401-8.
35. Palan K, Narayanan P, Pattanshetty S, Monteiro A. Assessment of quality of life in radically treated head and neck cancer patients: a cross-sectional study in a tertiary care setting in Manipal, Udupi. J Cancer Res Immunooncol. 2010;2:1-10.
36. de Graeff A, de Leeuw JRJ, Ros WJG, Hordijk GJ, Blijham GH, Winnubst JAM. Long-term quality of life of patients with head and neck cancer. Laryngoscope. 2000;110(1):98-106.
37. Wang JW, Sun L, Ding N, Gong XH, Chen XF, Yu DH, et al. The association between comorbidities and the quality of life among colorectal cancer survivors in the People’s Republic of China. Patient Prefer Adherence. 2016;10:1071-7.
38. Oliveira KG, von Zeidler SV, Podestá JR, Sena A, Souza ED, Lenzi J, et al. Influence of pain severity on the quality of life in patients with head and neck cancer before antineoplastic therapy. BMC Cancer. 2014;24:39.
39. Ngelangel CA. Quality of Life of Filipino Cancer Patients. Touch Oncology Briefings. 2008: 18-9. 40. Cordero FV, Panopio IS, General Sociology: Focus
on the Philippines, Quezon City, Philippines: Ken Inc, 1969.