Copyright © 2016 Vilnius Gediminas Technical University (VGTU) Press Technika http://www.bjrbe.vgtu.lt
doi:10.3846/bjrbe.2016.20 OF ROAD AND BRIDGE ENGINEERING ISSN 1822-427X / eISSN 1822-4288
2016 Volume 11(2): 169–178
1. Introduction
Design alternatives, subsequently analysis of these alter-natives and their construction variants enable to analyse and to compare them and to select the optimum solution (Okasha, Fragopol 2009). The suggested assessment of bridge’s life cycle is undoubtedly one of the very often used tools of evaluating transport infrastructure.
In general every new construction is assessed not only from the perspective of investment costs but in view of the total expenditures on operation and maintenance in the course of the whole life cycle. These standpoints are mainly preferred in case of building construction but it is beneficial to apply them in case of transport construction and especially bridge construction too. Bridges influence significantly the average price per kilometre of the who-le route because of their high investment prices. Other risk-based approach see in Padgett et al. (2010). The re-sults show that not only do the magnitudes of the expec-ted losses but also retrofit benefit differs for a particular bridge.
That means the responsible decision regarding a choice of a suitable type of a bridge is very important
already in the pre-investment phase (Lozano-Galant et al. 2015). The design of a bridge must respect objectives such as transport continuity, environmental protection. The goal and approach of the European Commission is the development of a tool to calculate the Life-Cycle Costs (LCC) (according to Directive 2014/24/EU) for specific products for public procurement. The mentioned rese-arch developed cycles of repairs (Macek, Dobiáš 2014), and also their extension to software for general regulation of Directorate of Roads and Highways of the Czech Republic.
The current routine practise is: a designer elaborates drafts of possible technical solutions, defines pros and cons of each particular draft inclusive assessment. The eva-luation of variants (drafts of highway bridges) is judged (evaluated) by an investor management on the base of data prepared by a designer. The multi criteria methods are used for cost-benefit analysis. The expert experience gained during the similar realised construction and cost and price database, local conditions and many other cri-teria is taken into consideration. The way in which basic conditions of a tender are set can significantly contribute to the reasoning of a bridge price (Lee, Cho 2006).
LIFE-CYCLE COST
OF BRIDGES – FIRST STEPS TO A HOLISTIC APPROACH
Václav Beran1, Daniel Macek2, Dana Měšťanová3
Dept of Economics and Management in Civil Engineering, Czech Technical University in Prague, Thakurova 7, 166 29 Prague 6, Czech Republic
E-mails: 1beran@fsv.cvut.cz; 2daniel.macek@fsv.cvut.cz; 3dana.mestanova@fsv.cvut.cz
Abstract. Bridges create transport infrastructure and are subjected to long term witness of economic design, reliability, durability, maintainability and external risk (natural and human hazards). Deficient design of bridges points to high in-vestment costs, low quality, retrofits maintenance costs, mitigates quality damages. The primary reason of the problem is usually stated high investment costs. Resources for investment are limited over and over again. However, approach for evaluating and comparing the cost effectiveness in practical design does not dominate in present-days as arbitra-tion of different strategies and warrant for avoiding critical economic or funcarbitra-tional situaarbitra-tions. This paper illustrates a method for estimating the retrofits for bridges design based on Life-Cycle Costs and Cost-Benefit Analysis. The ap-proach integrates cost model, fragility of as-designed and retrofitted benefits for a range of externalities and associated potential changes in design and economical retrofit. The emphasis on life-time performance and benefits, as opposed to initial retrofit acquisition investment cost alone, paves the way to risk-wise investment and also helps to support up-grade actions for sustainable infrastructure. An application of the holistic approach Life-Cycle Cost and benefit analysis is conducted for two representative bridges of highway class. The available financing has a big influence on the chosen technical design.
The main role of an investor thus rests not only on a particular decision but in the registration of the data from previous years (used for a financial comparison, for the exclusion of excessively expensive bids etc.) too (Lee et al. 2011). However the holistic approach is more broadly ba-sed and has to include more externalities (Fig. 1).
The investment costs play the role of initial cost for evaluation of a bridge for starting time t0 of the starting life cycle. However, Investment costs influence LCC signi-ficantly. Externalities linked to construction, read as qu-ality, material chosen, technology applied, organisation of construction process predestine future costs and the length of duration of particular maintenance and re-placement cycles. The similar impacts have externalities related to region (read ecology, air pollution, and type or kind of long term loads).
The basic formula for calculating Life-Cycle Cost is given as schematic relational Eq (1):
, (1)
where LCC – total Life-Cycle Cost (present value) of the structure; I – initial investment cost of the structure (total purchase price not counting interest if it is a loan); r – in-terest paid on the loan amount used to purchase the build-ing; Re – replacement cost of the building (present value);
RS – resale or salvage value of the structure at the end of its useful life (present value); D – disposal costs to remove the structure at the end of its useful life (present value). This could be zero if the building will be sold instead of de-molished; E – estimated energy costs of the structure (use-ful life); W – estimated water costs of the structure (use(use-ful life); M – estimated maintenance, repair, and upkeep costs of the structure (useful life); O – estimated other costs as-sociated with ownership of the structure (administrative, permitting, licensing, etc).
LCC calculation (2) is for practical purposes usually simplified by the formula:
, (2)
where I – initial investment purchase; Cn – the cost in year n; i – discount rate; tD – length lifecycle.
2. Bridge management system
As for already finished bridges it is, in the course of the lifespan of construction, desirable to monitor their techni-cal state and then the outputs can serve as a base for the creation of a maintenance and renewal database. For this purpose there are many software products commonly used. However, the main indicators of a good or bad proposal are the accrued costs C(t) in four basic cycles: construc-tion, repayment, capitalizaconstruc-tion, and devaluation (Fig. 2). In time period starting from – tz are visible the first cost lo-cations, the first investment indication. The construction cycle consists internally of activities as studies, → project proposal(s), → construction, → operation trials. The main objective is to get a realistic expected cumulative cost curve C(t) and at this stage awaited investment cost It. In subsequent cycles follow increase of maintenance and re-construction costs. In practical cases a smooth curve is not available, but discontinuous cost time series. The calcula-tion of a realistic curve is desirable (Heralová 2014). The later mentioned subsection of 4th paragraph deals with construction of C(t).
Figure 2 shows the cost C(t), earnings E(t) curve for life cycle define time points: starting in tz project, in t0 use, in te credit liquidity, in t0 max capitalization of earnings, in tu the period of losses.
The main reason of construction of cost curve C(t) is the comparison with expected earnings E(t) (Fig. 2). The result is: a – location of break-even point (BEP); b – test of economic profitability on the basis of max (E(t) – C(t)); and c – location of tu as a time point marking the end of sustainability period.
If the relation (1) does not offer convincing positive ar-gumentation and if BEP given as E(t) = C(t) exists only for high te values that are not acceptable for project financing then the project should be rejected (or redesigned). The re-lation (1) is a necessary condition for an economic beha-viour (Soliman, Frangopol 2015).
If the relation (3) does not offer a convincing result the recommendation for project completion is desirable.
Fig. 1. Structure of Life Cycle Costs
, (3)
where BEP – break-even point; E(t) – earnings in year t; C(t) – costs in year t.
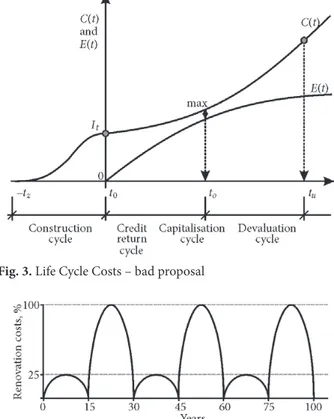
There is no reason to deal with such investment. It is necessary to change proposal, to change the design structure. The construction of curve E(t) is a separate pro-blem. Figure 3 illustrates undesirable situation, E(t) does not intersect C(t).
Figure 3 characterizes critically passive project. En-forcing of the reduced It and C(t) and/or increase of E(t) is necessary. The basic economic frame of any investment is given in Figs 2 and 3. However, the basic principle is com-bination of maintenance and renewal cycles in the life time of a bridge as illustrated Fig. 4.
There are many software products for the design of repairs and renovation. Systems are available as DABRO, SMART (Denmark), BRUTAS (Norway), KUBA-MS (Switzerland), QUADRO (Great Britain), PONTIS, BRID-GIT (USA) and many other. The majority of the systems stand as a part of large economic modules and archiving files. Data drawn from them serve reversely for strategy, repairs planning, for preparation of new projects, for the definition and optimization of requirements regarding fi-nancial evaluation (Gode, Paeglitis 2014). However, the basic scheme of a single construction element of the bridge (Fig. 4) might be projected into a table and expanded to a multiple size of elements Ei. Every single construction ele-ment can be described by cycle of renewal which defines the volume of expected maintenance and renewal costs in the future in comparison with initial costs [in %]. In some cases renewal of the whole construction element is reali-zed (Fig. 4) or sometimes renewal only of a part of a cons-truction element is realized.
The matrix (Table 1) represents the scheme of cycles of renewal for single construction elements. As a basic source for the determination of the length of cycles of re-newal the expert base is used comprising data regarding lifespans and expected future maintenance and renewal costs [in %] of construction elements as mentioned above.
The convenient solution for complex program of cycles is to calculate optimal cycles. The linear program-ming assignment is usually expressed in matrix form (in our case extended structure A of Table 1). The formulation functional max F(x) =cx is subject to Ax ≤ b,where x ≥ 0is usually extent of maintenance and renewal. The main aim is to determine the optimum time sequences of cycles at minimum cost.
The explanation optimization is beyond the scope of the article, more in Öncan (2013).
The Bridge Management System (BMS) has been used in the Czech Republic since 2003. The system serves for (1) registration of bridges from the perspective of their technical state (about 400 users), weight capacity, usabili-ty and (2) taking the decision regarding the necessary le-vel of maintenance, repairs and reconstruction (financial planning of maintenance and repairs, since 2008, 19 000 bridges in evidence, 900 highway bridges).
3. Assessments of the drafts of bridges in a pre-investment phase
In the course of the assessment and the decision-taking pro-cess (as far as the right choice of an optimal construction solution is concerned) an investor must take into consid-eration, above the commonly used evaluation procedures, an aspect of financial requirements emerging during the lifespan of a bridge (Christensen et al. 2005; Lozano-Galant et al. 2014). Assignment of needed repairs in the phase of designing is difficult to define. It is possible to exploit infor-mation from monitoring of required repairs, maintenance and reconstruction of existing bridges and the information similarly exploit for designing of new bridges in the pre-in-vestment phase. It is essential to specify in detail (for each part of the construction) an assessment of a need concern-ing repairs and maintenance because it is necessary to dif-ferentiate from the range and a cycle of repairs point of view. There are many models which are able to generate the outcome as for the most effective solution if the who-le lifespan of the construction is taken into consideration (Koh 2011).
Fig. 3. Life Cycle Costs – bad proposal
Fig. 4. Example – maintenance cycles for the structural element of the bridge
Table 1. The matrix of maintenance and renewal cycles Time (years)/
Elements 5 10 15 20 25 30 35 40 45 50
The novelty of this described approach is based on the aggregation of price items into groups with simultane-ous observation of the same groups of items which is drawn up from currently used bridges in the Czech Republic (the whole life plan and particular costs are taken into considera-tion). With respect to the selected construction solution the-re have been sorted (from available the-resources) expendituthe-res on repairs and reconstruction of existing bridges. There are available data for the second half of the last century and ten years of the current century. The necessary expenditures on repairs have been gained as a percentage of the whole price i.e. the comparison between the price of repairs and the whole price of a bridge was assessed.
The calculation of the bridge’s price in the whole li-fespan is a sum of the investment expenditures and the predicted volume of financial resources used in the course of the bridge’s lifespan. The total volumes of used financial resources and simultaneously the time cycles defined in the application Buildpass are observed. In the outcomes the factor of time value of money is involved.
The price calculation of a particular part of a bridge is based on the investment expenditures and creates only a part of the whole price.
Such parts of the construction are assessed by aggre-gated price items, e.g. a bridge’s pillar consists of building up of the boarding and its disposal, armature and concrete.
A designer knows prices valid at the moment of desi-gn and evaluates the bridge according to them. The future repairs are evaluated as a percentage of the total price for particular parts of a bridge. Furthermore the time stages are taken into consideration, i.e. information when it will be necessary to realize a particular repair and how many percent of the whole volume must be repaired.
The system works with three calculation levels. The first level assures the control of designer’s eva-luation. Actually it is plain multiplication of physical vo-lumes and prices involved in the price database approved by the Ministry of Transport of the Czech Republic. This control calculation serves to the verification of the price of a bridge. Chiefly the price of one m2 is extremely important because it is the immediate and first indicator of a draft.
The next level lies in calculation of the total inves-tment expenditures. In the course of this calculation the price of design works is simultaneously calculated. The calculation is generated from the price list.
The third level of calculation is based on the cycles of repairs of a bridge according to the blocks, which en-compasses initial price. The duration of the first cycle be-fore the first necessary repair is for instance 20 years and at the same time the range of a necessary repair is mentioned (e.g. 80%). Then next repair comes where already better and much more quality insulation with longer lifetime is assumed. The duration of the next repair is therefore as-sumed longer (e.g. 28 years), a range of necessary repair smaller (e.g. 60%). Besides the information regarding du-ration of cycles and the range of necessary repairs the price is always stated. Outcomes are without inflation taken into consideration, with 3% and 6%.
The definition of cycles and the range of repairs is a part of the methodology for assessment of bridges in their life cycle. The life cycles and the range of repairs were determi-ned on the basis of observation of incidents connected with the necessity to repair bridges (databases) and further on the experiences of designers, specialists from the Czech Techni-cal University in Prague and professionals from practise.
For the assessment of bridges in Life-Cycle Costs (LCC) it is possible to exploit adjusted application software Buildpass initially drawn up for building construction (Be-ran, Dlask 2007). The application is used in practise by the Road and Motorway Directorate of the CR for prepared va-riants of bridges drafts in cases when supposed investment expenditures exceed 4 million EUR. The main feature is the possibility to simulate the required investment expenditures and assumed needed funds in the course of the bridge’s li-fespan. The modelling of repair needs is realized for the ba-sic time period of 100 years but simultaneously it is possi-ble to realize the modelling in a shorter cycle, more general approach is shown in (Dlask 2015).
Generally placement of a new traffic road is selected with the aim to minimize a number of bridges which make the traffic road extremely expensive. In the course of the designing process the total expenditures are optimized i.e. traffic roads are priced inclusive objects of bridges. For such work there are utilized price normatives which are regularly up-to-dated from the level of the Ministry of Transport of the Czech Republic,
The time factor, i.e. durability and lifetime of a cons-truction is included in a standard regulation for designing of concrete constructions Model Code in a form of Euro-pean standards.
For the assessment of a bridge’s construction the divi-sion of a bridge into several parts is important followed by their pricing and defining of future requirements on repairs and maintenance inclusive their range. The application tool BUILDPASS has defined for each construction solutions partial segments and subsequently and compared designed variants with each other taking into consideration the life-cycle costs as mentioned above.
For the assessment of bridges in the their lifespan it is necessary to calculate for every drafted variant not only the initial investment expenditures but other expenditu-res also, i.e. inclusive costs on a project, exploration, costs connected with the placement of a construction, reserves etc. The amount of investment expenditures is confronted with commonly valid price ratios concerning bridges ba-sed on calculations per square meter.
required in the future and last but not least for an investor to be able to secure necessary funding for their realization.
The used technical solution, i.e. from the construction and used materials point of view, differs and every single bridge is more or less an original (Šelih et al. 2008). Each single contractor focused on bridges is oriented on parti-cular technologies. Not every contractor has its own manu-factory of prefabricated bridge’s elements and so on. A draft prepared by a designer and agreed by an investor is there-fore subsequently a subject of the marketing approach and
professional orientation of contractors. For an investor de-cision-taking process there is crucial a selection of the most appropriate variant of a bridge and monitoring of initial in-vestment expenditures and following costs arisen during the lifespan. For a contractor on the other side there is a priority as for used technology because that is the main contributor in a process of gaining new contracts inclusive bridges.
The current practise is as follows: a designer drafts some real variants of a bridge (Figs 5–10), calculates phy-sical volumes and calculates a price per each variant. This
Fig. 5. Bridge variant 1
Fig. 6. Bridge variant 2
Fig. 7. Bridge variant 3
Fig. 8. Bridge variant 4
Fig. 9. Bridge variant 4.1
price must reflect specific technical details such as com-plexity of the foundations etc. An investor considers this price and compares it with its own price database. By that the price differences in basic costs are eliminated. The
comparison of several variants is very often a subject of many differences, e.g. different length of fields and con-sequently a number of fields and supports.
Investors using the application assess all variants with regard to investment expenditures and maintenance costs within the whole lifespan of a bridge up to the commonly settled lifespan. In such a way an investor can demonstrate that the cheap variant (from the investment expenditures point of view) will be finally proved as the worse one (in the course of its lifespan) than expected. The software ap-plication is devised relatively freely for a user and it is pos-sible to adjust the process of data entering and updating in compliance with user’s needs. The application enables to create the different graphical representation, comparison of variants and the other data processing. The set of informa-tion called Schedule of repairs shows the nearest term of planned repair or renewal of a particular part. For moni-toring of detailed costs which are summarized in balance sheet there is a set of information called Repairs in a parti-cular period or Repairs in a partiparti-cular period – timetable. 4. Outcomes of the LCC study of bridge variants The subject of the study is the assessment of 6 drafts of bridg-es not only from the point of view of invbridg-estment expenditurbridg-es but inclusive future costs of maintenance and repairs.
The methodology sets approximate evaluation of li-fespan costs for each single technical solution which is helpful for an investor in the decision-making process re-garding the most appropriate variant.
A designer drafted 6 real technical and constructional variants of a bridge, calculated physical volumes and made out a price of each single technical variant.
This evaluation includes all important technical and constructional aspects with the impact on the price. The costs of all bridge variants calculated by a designer – con-sisting of all functional components of a bridge inclusive their prices (supports, a deck, railings etc.) are the basic data for the LCC calculation.
Constructional solutions of particular variants are as follows:
−coupled bridge constructions: Variants 1, 2, 3, 4,
and 4.1
−monolithic bridge, prestressed concrete construc-tions: variants 4.1, and 5.
In the case of the variant 4.1 there are two different types of a bridge construction and that is the reason why are these two types solved separately and for the final as-sessment again summarized. The construction of bridges is pictured on Figs 5–10.
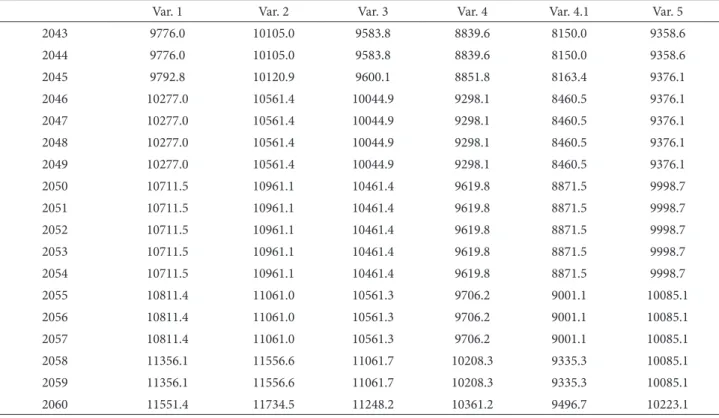
SW data processing of all variants provides us with the total amount and the development of life cycle costs. These costs adjusted to the current prices are available in Table 2. and Fig. 11. The amount of costs visible in the sum line of lifespan enables to make the responsible decision regarding the most suitable variant from the lifespan point of view.
Figures 14 and 15 picture the connecting lines of trends of the LCC costs development. Table 3 gives the mentioned growth rates of lifespan costs for particular variants.
Fig. 11. Graph – cumulated costs (thousands EUR) of all variants for the period of 50 years (in current prices)
Fig. 12. Graph – the course of cumulated costs (thousands EUR) of all variants for the period of 50 years (the price index of 3%)
Fig. 13. Graph – the course of cumulated costs (thousands EUR) of all variants for the period of 50 years (the price index of 6%)
From the calculated balance of the construction in the considered period of lifespan (50 years) and the graphically interpreted line (consisting of the initial investment expen-ditures and reconstruction and maintenance costs in time cycles) it is apparent that the Variant 4.1 seems the most effective. Its lowest investment expenditures and the second lowest LCC growth rate rank this variant number one.
The Variant 5 is ranked, despite of quite high inves-tment expenditures, as the second best because of the low LCC costs (the best LCC costs growth rate) which will im-prove its position in the future.
The third position is occupied according to inves-tment expenditures and LCC costs by the Variant 4,
which has the second lowest investment expenditures but Fig. 15.(thousands EUR) of variants – part II Graph – trends of the LCC costs development
Table 2. Cumulated costs (thousands EUR) of all variants for the period of 50 years (in current prices)
Var. 1 Var. 2 Var. 3 Var. 4 Var. 4.1 Var. 5
2010 8362.2 8754.2 8241.7 7645.6 7054.9 8741.4
2011 8362.2 8754.2 8241.7 7645.6 7054.9 8741.4
2012 8362.2 8754.2 8241.7 7645.6 7054.9 8741.4
2013 8362.2 8754.2 8241.7 7645.6 7054.9 8741.4
2014 8362.2 8754.2 8241.7 7645.6 7054.9 8741.4
2015 8362.2 8754.2 8241.7 7645.6 7054.9 8741.4
2016 8362.2 8754.2 8241.7 7645.6 7054.9 8741.4
2017 8362.2 8754.2 8241.7 7645.6 7054.9 8741.4
2018 8362.2 8754.2 8241.7 7645.6 7054.9 8741.4
2019 8362.2 8754.2 8241.7 7645.6 7054.9 8741.4
2020 8388.2 8779.1 8267.1 7662.0 7077.4 8770.2
2021 8388.2 8779.1 8267.1 7662.0 7077.4 8770.2
2022 8751.4 9109.5 8600.8 7996.8 7300.3 8770.2
2023 8751.4 9109.5 8600.8 7996.8 7300.3 8770.2
2024 8751.4 9109.5 8600.8 7996.8 7300.3 8770.2
2025 8817.9 9176.1 8667.3 8054.4 7386.7 8827.8
2026 8817.9 9176.1 8667.3 8054.4 7386.7 8827.8
2027 8817.9 9176.1 8667.3 8054.4 7386.7 8827.8
2028 8817.9 9176.1 8667.3 8054.4 7386.7 8827.8
2029 8817.9 9176.1 8667.3 8054.4 7386.7 8827.8
2030 9195.2 9522.7 9028.8 8336.3 7721.2 9234.0
2031 9195.2 9522.7 9028.8 8336.3 7721.2 9234.0
2032 9195.2 9522.7 9028.8 8336.3 7721.2 9234.0
2033 9195.2 9522.7 9028.8 8336.3 7721.2 9234.0
2034 9618.9 9908.1 9418.0 8726.8 7981.2 9234.0
2035 9618.9 9908.1 9418.0 8726.8 7981.2 9234.0
2036 9618.9 9908.1 9418.0 8726.8 7981.2 9234.0
2037 9618.9 9908.1 9418.0 8726.8 7981.2 9234.0
2038 9618.9 9908.1 9418.0 8726.8 7981.2 9234.0
2039 9618,9 9908.1 9418.0 8726.8 7981.2 9234.0
2040 9776.0 10105.0 9583.8 8839.6 8150.0 9358.6
2041 9776.0 10105.0 9583.8 8839.6 8150.0 9358.6
in contrast to the Variant 5 it has markedly worse LCC growth rate, which is the main reason for the position of this variant in this ranking.
The Variants 1, 2 and 3 are construction of the same type of design with only minor differences (e.g. Variant 2 – supports). On their assessment of the Life-Cycle Costs parti-cipate mainly investment expenditures and trends of the LCC development are in this case nearly similar but the highest among all variants.
Into the calculations a temporary item was also in-cluded which accounts for 10% of the investment expen-ditures. This approach slightly favours bridges with lower
investment expenditures because they gain the greater price difference when they are compared with bridges bea-ring higher investment expenditures. The assessments are based on recalculation of current prices which are stated in Table 2 and graph – Fig. 11. For the insight into the area of actually drawn amounts of money during the lifespan see the disposal graphs in Figs 12–13, which (by the determi-ned price ratio) show how much money is spent without taking into consideration the present value of each vari-ants’ expenses.
The resulting assessment of variants (ranking): 1) Variant 4.1;
2) Variant 5; 3) Variant 4; 4) Variant 3; 5) Variant 1; 6) Variant 2.
The outcomes are the basis not only for more complex decisions on the particular technical variant of a bridge but also the basis for planning future repairs including neces-sary financial sourcing for their realization.
Graphic forms of outcomes are very variable. The necessary sourcing in the future is shown in Fig. 16. It is apparent that maintenance and renewal costs of a bridge exceed a share of investment costs.
Continued Table 2
Var. 1 Var. 2 Var. 3 Var. 4 Var. 4.1 Var. 5
2043 9776.0 10105.0 9583.8 8839.6 8150.0 9358.6
2044 9776.0 10105.0 9583.8 8839.6 8150.0 9358.6
2045 9792.8 10120.9 9600.1 8851.8 8163.4 9376.1
2046 10277.0 10561.4 10044.9 9298.1 8460.5 9376.1
2047 10277.0 10561.4 10044.9 9298.1 8460.5 9376.1
2048 10277.0 10561.4 10044.9 9298.1 8460.5 9376.1
2049 10277.0 10561.4 10044.9 9298.1 8460.5 9376.1
2050 10711.5 10961.1 10461.4 9619.8 8871.5 9998.7
2051 10711.5 10961.1 10461.4 9619.8 8871.5 9998.7
2052 10711.5 10961.1 10461.4 9619.8 8871.5 9998.7
2053 10711.5 10961.1 10461.4 9619.8 8871.5 9998.7
2054 10711.5 10961.1 10461.4 9619.8 8871.5 9998.7
2055 10811.4 11061.0 10561.3 9706.2 9001.1 10085.1
2056 10811.4 11061.0 10561.3 9706.2 9001.1 10085.1
2057 10811.4 11061.0 10561.3 9706.2 9001.1 10085.1
2058 11356.1 11556.6 11061.7 10208.3 9335.3 10085.1
2059 11356.1 11556.6 11061.7 10208.3 9335.3 10085.1
2060 11551.4 11734.5 11248.2 10361.2 9496.7 10223.1
Table 3. Growth rates (thousands EUR per year) – costs of lifespan for each single variant
Var. 1 Var. 2 Var. 3 Var. 4 Var. 4.1 Var. 5
Rate 63 405 59 699 59 919 53 667 48 977 31 095
Financial resources for construction of transport objects including bridges are gained from several sources as graphically interpreted in Fig. 17.
For information the comparison of construction work price is mentioned. The price level of the cons-truction works (engineering conscons-truction) in the Czech Republic are on the lower level of prices applied in the Eu-ropean Union (EU).
Table 4 shows the price index compared to the base 100% for the EU ranks the CR to the lower level (84 %). The public opinion in the Czech Republic leans to the view that building of roads and bridges is too expensive. The above mentioned data shows the opposite.
5. Conclusion
1. The evaluation of bridges from a viewpoint of costs in-curred during the lifespan and application of suitable meth-ods is beneficial for the costs optimization and for the sus-tainable development of the transport infrastructure. The costs of bridges cohere closely with a tender. It is common practice that an investor announces a tender for design-ing works for a particular part of a motorway in which a bridge is involved too. In this case, if in the documentation for contractual proceeding a condition that the specializa-tion on designing of bridges is required is not included, a contract can be gained by a designer/contender who has no required specialization. Another example could be the situation when a sub-contractor with such specialization is hired but the price for design works is limited. As a conse-quence the sub-contractor is not able to prepare thoroughly several variants and to optimize them. This issue coheres with commonly applied huge volumes of construction works, which are a subject of tenders, with a big influence on both an investor and a designer. In spite of this common practice it is apparent that very often a more expensive pro-ject with professionally prepared two or three variants can bear (based on the optimization) significant savings just in the investment expenditures inclusive future costs.
2. The main investor’s target is the selection of a thrifty, effective and useful variant of a bridge using all accessible databases of existing bridges and with the use of applications regarding decision-taking methods. The approach of an investor must be oriented on complex de-cision about a chosen variant mainly by taking into consi-deration planning of repairs and maintenance in the futu-re inclusive funding of these works. It is optimal to design such technologies and particular parts of a construction to be possible co-ordinate works on repairs with respect to the lifespan of each construction element. As well as inflation must be taken into account. The information gained from the existing database applications and decision-making methods is for an investors a suitable resource for the in-vestments‘ preparation and as well as for drawing funds (to cover financial needs of transport constructions) from the European Investment Bank, Cohesion Fund or structural funds. The application of the supportive systems is in accordance with many items of the general plan of trans-port infrastructure development which assigned the main
targets of the transport policy for the area of transport inf-rastructure and inclusive effective approaches.
3. Already in the course of designing process it is vital to take into consideration costs which occur within their lifetime. With the usage of software Buildpass every bridge is assessed in its life cycle and by such a way the financing of a bridge becomes effective. A bridge is for the assess-ment in its life cycle divided into parts and these parts are priced by aggregated items. Furthermore the time stages are assigned in which it will be necessary to realize a re-pair and which particular part will need such rere-pair (e.g. insulation). In the procedure the range of repairs is obser-ved (percentage of the whole volume of a particular part of a construction) and cycles are defined. The assessment of bridges in the life cycle inclusive the model of repair’s cycles was prepared on the basis of data regarding repairs available in databases and further on consultations with specialists from the Czech Technical University in Prague and professionals from practise. The time cycles and the range of repairs result from the long-term evaluation of bridges and are undoubtedly beneficial in the process of their designing. The suggested assessment of bridges in their life cycle is very important in the process of selecting the different variants of drafts and it is a suitable tool utili-zed in the field of traffic infrastructure development. Acknowledgement
This paper is originated as part of a Czech Technical Uni-versity in Prague, Faculty of Civil Engineering research
Fig. 17. Graph – available resources in the Czech Republic
Table 4. The price index base (100% = average of the EU)
Country The price index for the EU base
avg. 100 % Country
The price index for the EU base
avg. 100 %
Denmark 164 Germany 103
Luxembourg 149 Estonia 100
Finland 147 Malta 99
Holland 130 Lithuania 97
Latvia 127 Romania 92
Poland 125 Greece 90
Austria 124 Spain 90
Ireland 122 Slovakia 89
France 115 Portugal 85
Slovenia 110 Czech Republic 84
project on the Management of Sustainable Development in the Life Cycle of Buildings, Building Enterprises and Territo-ries (MSM 6840770006), financed by the Ministry of Edu-cation, Youth and Sports of the Czech Republic.
References
Beran, V.; Dlask, P. 2007. Nonlinear Optimisation and Rational Cash Flow, Engineering, Construction and Architectural Management 14(3): 277–292. http://dx.doi.org/10.1108/09699980710744917
Dlask, P. 2015. Simulation Model Based on Regional Develop-ment and Virtual Changes, Acta Polytechnica 55(5): 291–300.
http://dx.doi.org/10.14311/AP.2015.55.0291
Christensen, P. N.; Sparks, G. A.; Kostuk, K. J. 2005. A Method-Based Survey of Life Cycle Costing Literature Pertinent to In-frastructure Design and Renewal, Canadian Journal of Civil Engineering 32(1): 250–259.
http://dx.doi.org/10.1139/l04-077
Gode, K.; Paeglitis, A. 2014. Concrete Bridge Deterioration Caused by De-Icing Salts in High Traffic Volume Road En-vironment in Latvia, The Baltic Journal of Road and Bridge Engineering 9(3): 200–207.
http://dx.doi.org/10.3846/bjrbe.2014.25
Heralová, R. S. 2014. Life Cycle Cost Optimization within Deci-sion Making on Alternative Designs of Public Buildings, Pro-cedia Engineering 85: 454–463.
http://dx.doi.org/10.1016/j.proeng.2014.10.572
Koh, H. M. 2011. Reliability, Performance and Integrity Assess-ment for Bridge Design and Maintenance, Structure and In-frastructure Engineering 7(7–8): 455–456.
http://dx.doi.org/10.1080/15732479.2010.500814
Lee, S. Y.; Park, W.; Ok, S. Y.; Koh, H. M. 2011. Preference-Based Maintenance Planning for Deteriorating Bridges under Multi-Objective Optimisation Framework, Structure and In-frastructure Engineering 7(7–8): 633–644.
http://dx.doi.org/10.1080/15732479.2010.501565
Lee, K. M.; Cho, H. N. 2006. Life-Cycle Cost-Effective Optimum Design of Steel Bridges Considering Environmental Stressors, Engineering Structures 28(9): 1252–1265.
http://dx.doi.org/10.1016/j.engstruct.2005.12.008
Lozano-Galant, J. A.; Payá-Zaforteza, I.; Turmo, J. 2015. Effects in Service of the Staggered Construction of Cable-Stayed Bridg-es Built on Temporary Supports, The Baltic Journal of Road and Bridge Engineering 10(3): 247–254.
http://dx.doi.org/10.3846/bjrbe.2015.31
Lozano-Galant, J. A.; Ruiz-Ripoll, L.; Payá-Zaforteza, I.; Turmo, J. 2014. Modifications of the Stress-State of Cable-Stayed Bridg-es Due to Staggered Construction of their Superstructure, The Baltic Journal of Road and Bridge Engineering 9(4): 241–250.
http://dx.doi.org/10.3846/bjrbe.2014.30
Macek, D.; Dobiáš, J. 2014. Buildings Renovation and Mainte-nance in The Public Sector, Procedia Engineering 85: 368–376.
http://dx.doi.org/10.1016/j.proeng.2014.10.562
Okasha, N. M.; Frangopol, D. M. 2009. Lifetime-Oriented Multi-Objective Optimization of Structural Maintenance Consider-ing System Reliability, Redundancy and Life-Cycle Cost Us-ing GA, Structural Safety 31(6): 460–474.
http://dx.doi.org/10.1016/j.strusafe.2009.06.005.5
Öncan, T. 2013. Heuristics for the Single Source Capacitated Multi-Facility Weber Problem, Computers & Industrial Engi-neering 64(4): 959–971.
http://dx.doi.org/10.1016/j.cie.2013.01.005
Padgett, J. E.; Dennemann, K.; Ghosh, J. 2010. Risk-Based Seis-mic Life-Cycle Cost-Benefit (LCC-B) Analysis for Bridge Retrofit Assessment, Structural Safety 32(3): 165–173.
http://dx.doi.org/10.1016/j.strusafe.2009.10.003
Soliman, M.; Frangopol, D. M. 2015. Life-Cycle Cost Evaluation of Conventional and Corrosion-Resistant Steel for Bridges, Journal of Bridge Engineering 20(1): 06014005.
http://dx.doi.org/10.1061/(ASCE)BE.1943-5592.0000647
Šelih, J.; Kne, A.; Srdić, A.; Žura, M. 2008. Multiple-Criteria Deci-sion Support System in Highway Infrastructure Management, Transport 23(4): 299–305.
http://dx.doi.org/10.3846/1648-4142.2008.23.299-305