By Michael Grupe and Charles DiRocco
Improving stability in
the real estate
market, compelling
market values, and
the search for less
volatile investments
in a turbulent market
environment have all
prompted investors
to give REITs a
second look.
A GUIDE TO INVESTING IN
REAL ESTATE INVESTMENT TRUSTS
Real estate investment trusts (REITs) are outperforming most other sectors of domestic equity markets so far this year following two years of negative returns. The NAREIT (National Association of Real Estate Investment Trusts) composite index of total returns for all publicly traded equity, mortgage, and hybrid REITs through the end of September was up 21.6%.
What has changed?
Short-run investment performance may be affected by many factors. How-ever, long-run performance eventually must reflect the level and growth of corporate earnings and the discount rate applied to those earnings.
Changes in the real estate market have produced an improved view of the overall stability of the real estate sector. Investors appear more convinced that the commercial real estate sector is less prone to episodes of speculative building. For years, commercial real estate was almost entirely owned and financed by private investors, including partnerships, pension funds, and wealthy individuals, and proprietary information often held the key to suc-cess. However, in the early 1990s, property owners turned to public markets for capital, and the decision-making process became more transparent and subject to the scrutiny of analysts, investors, and regulators.
In addition, the commercial real estate economy has recovered from the collapse of real estate prices in the early 1990s and by 1997 entered a period of relative equilibrium. REIT earnings growth slowed in 1998 and 1999, and price-earnings multiples contracted, but average earnings growth remained positive. Earnings reports in 2000 suggest that the slowdown of earnings growth has stabilized, and year-over-year earnings growth picked up on average in the second quarter of 2000.
The current volatile market environment has also shifted investor attention to companies characterized by more predictable cash flows, higher dividends, and lower multiples.
Finally, investors have responded to the values that shares of REITs and other publicly traded real estate companies offered in late 1999. The average dividend yield of all equity REITs reached 9.28% on December 16, 1999, its highest level since December 1990, and nearly three percentage points above the yield on 10-year Treasury securities. Since then, share prices of equity REITs on average have increased 23.7% through the end of September.
All of these factors have prompted many investors to take another look at REITs and publicly traded real estate companies. However, these firms have distinct investment characteristics that individual investors should become familiar with when evaluating prospective REIT investments.
LONG-TERM PERFORMANCE
REITs and other publicly traded real estate companies are total return investments that provide high dividends plus potential for moderate,
long-Michael Grupe is vice-president and director of research and Charles J. DiRocco is director of industry analysis, both at the National Association of Real Estate Investment Trusts (NAREIT), a national trade association for REITs and publicly traded real estate companies. NAREIT is based in Washington DC. More information on REITs can be found at the website www.nareit.com.
term capital appreciation. Because of their high dividends and moderate growth potential, the long-term total returns of REIT stocks should be somewhat less than the returns of high-growth stocks and somewhat more than the returns of bonds. Because most REITs also have a small-to-medium equity market capitalization, their returns also should be comparable to other small- to mid-sized companies.
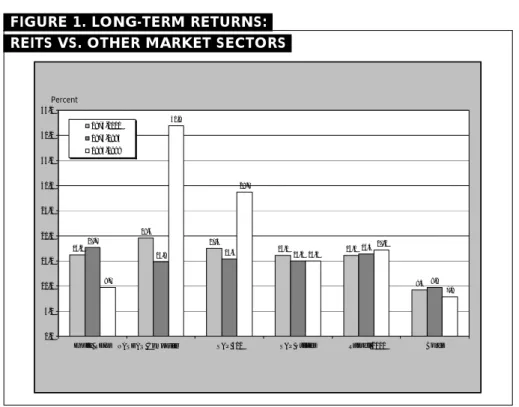
Figure 1 compares the average annual returns of different invest-ment sectors over the period 1975– 2000. Stocks in the Nasdaq Com-posite index recorded the highest average annual returns over the entire period. The average return of stocks in the NAREIT Equity REIT index fell between the returns of large-cap stocks and bonds, and were about the same as the returns of small-cap stocks and utilities.
Day-to-day, as well as long-term performance of REITs and publicly traded real estate stocks can be tracked at www.nareit.com.
PORTFOLIO DIVERSIFICATION
Investing in REITs and other publicly traded real estate companies also provides diversification benefits
because the correlation of REIT returns with the returns of other market sectors is relatively low.
Individual investors also should recognize that homeownership is not necessarily a substitute for commer-cial real estate in a diversified portfolio. A house is an expenditure as much as an investment, particu-larly when financed with a sizable mortgage. It does not produce income, but rather requires monthly mortgage interest payments and other occasional expenditures to be properly maintained. Some houses in some markets over certain periods have appreciated greatly in value. However, an index of house prices published by the Federal Home Loan Mortgage Corporation shows that house prices on average across the U.S. increased over the past 25 years by a compound annual rate of only 5.6% (ignoring both the benefits and costs of mortgage financing).
REIT OPERATING BASICS
REITs are public companies that, in most respects, operate like all other public companies, and the shares of most REITs are listed on the New York Stock Exchange. However, rather than manufacturing
computer chips or light bulbs, or providing services like banking or insurance, REITs deliver real estate services to individuals and busi-nesses. Thus, all of the skills that individual investors use to evaluate the stocks of public companies in general can easily be used to evalu-ate the stocks of REITs.
Most REITs should not be viewed as closed-end funds, that is, passive vehicles for collecting rents on a portfolio of properties and passing those rents through to shareholders. Although REITs were originally prohibited from both owning and operating their properties, that restriction in most cases was re-moved in 1986. Today, investors should evaluate REITs and other publicly traded real estate companies as genuine operating businesses. As such, REITs both own and operate their properties, actively manage their liabilities to reduce their costs of capital, exploit scale economies and other efficiencies in order to expand operating margins, and develop additional sources of
revenue by delivering new services to their tenants and others.
Like other public companies, the corporate officers and professionals that manage REITs are accountable both to their boards of directors as well as to their shareholders and creditors. In addition, most REITs became public companies within the past 10 years, often transforming to public ownership what previously had been private enterprises. In many cases, the majority owners of these private enterprises became the senior officers of the REIT and rolled their ownership positions into shares of the new public companies. Thus, the senior management teams of many REITs today own a signifi-cant portion of the company’s stock.
CHANGING FUNDAMENTALS
Historically, income-producing commercial real estate often was financed with high levels of debt, both because the properties provided tangible security for mortgage
FIGURE 1. LONG-TERM RETURNS: REITS VS. OTHER MARKET SECTORS
(Average annual total returns through August 20 00)
16.2
19.6
17.5
16.1 16.1
9.3 17.7
14.8 15.4 15.0
16.4
9.8 9.7
41.9
28.7
15.0
17.2
7.8
0.0 5.0 10.0 15.0 20.0 25.0 30.0 35.0 40.0 45.0
Equity REITs S&P 500 S&P Utilities Russell 2000 Bonds 1975-2000
1975-1994 1995-1999
NASDAQ Composite
financing, and because the rental income from those properties was a clear source of revenue to pay the interest expense on the loan. Prior to the real estate recession of the early 1990s, it was not uncommon for individual properties to carry mortgages of over 90% of their estimated market value or cost of construction. Occasionally, loan-to-value ratios went even higher.
Today, properties owned by REITs are financed on average with far less debt. The average REIT debt ratio (total debt divided by the sum of debt plus common equity market capitalization) never moved much above 50% even as stock prices declined in 1998 and 1999, and it has moved lower this year as stock prices have risen.
Investors also commonly evaluate a company’s ability to meet its debt obligations by dividing its cash flow, as measured by earnings before interest, taxes, depreciation and amortization expenses, by either its interest expense or interest expense plus other fixed charges such as dividends on preferred stock. For REITs, these coverage ratios on average currently exceed 2.5 and 3.0, respectively.
REITs are required by law to distribute each year to their share-holders at least 95% of their taxable income (although this will be reduced to 90% starting in January). Thus, as investments, REITs tend to be among those companies paying the highest dividends. The dividends come primarily from the relatively stable and predictable stream of contractual rents paid by the tenants who occupy the REIT’s properties, and since rental rates tend to rise during periods of inflation, REIT dividends tend to be protected from the long-term corrosive effect of rising prices.
DIVIDEND DISTRIBUTIONS
For REITs, dividend distributions for tax purposes are allocated to ordinary income, capital gains and return of capital. Because each of
these components may be taxed at a different rate, all public companies, including REITs, are required to provide their shareholders early in the year with information clarifying how the prior year’s dividends should be allocated among these components for tax filing purposes. This information is distributed by each company to its list of share-holders on IRS Form 1099-DIV.
A return of capital distribution is defined as that part of the dividend that exceeds the REIT’s taxable income. At first, some investors are puzzled that any company can pay out more than its income in the form of dividends. However, because real estate depreciation is such a large non-cash expense that likely over-states the decline in property values, the dividend rate divided by funds from operations (FFO—a measure of income unique to the real estate industry that we’ll cover later in this article) is used as a more appropriate measure of a REIT’s dividend-paying ability. Thus, a dividend rate that is 80% of FFO can easily exceed 100% of earnings and profits.
A return of capital distribution is not taxed as ordinary income. Rather, the investor’s cost basis in the stock is reduced by the amount of the distribution. When shares are sold, the excess of the net sales price over the reduced tax basis is treated as a capital gain for tax purposes. Alternatively, if the distribution exceeds the shareholder’s tax basis in the stock, the excess is treated as a capital gain. As long as the appro-priate capital gains tax rate is less than the investor’s marginal ordinary income tax rate, a high return of capital distribution may be especially attractive to investors in higher tax brackets.
REIT RISKS
Like all public companies, REITs face the general risk that overall market conditions will drag down all stocks.
REITs also face industry risk that is specific to the commercial real
estate business. For example, REITs operate according to certain provi-sions of the U.S. tax code. Therefore, changes to those provisions pose greater risks for REITs than they do for most other companies. In addition, state and municipal governments may from time to time change property tax rates or land-use policies that pertain to commer-cial real estate.
Specific risks also include changes in management or strategic direc-tion, accounting irregularities, mergers and acquisitions, and other economic events.
The economics of owning and managing commercial properties also may be affected by develop-ments in other industries. For example, the Internet is likely over the long run to affect how consum-ers shop for goods and services, thereby affecting how retailers conduct their businesses. New communications technologies, including broadband communica-tions services, will change to some degree the nature of how office space is occupied and managed. However, such changes are common in our dynamic economy, and all companies must respond to them from time to time.
ECONOMIC RECESSION
A slowdown in the economy is likely to affect all public companies to some degree, including REITs and publicly traded real estate compa-nies. When economic growth slows, growth in the demand for space may slow or decline, causing building occupancy rates to drop and market rents to weaken. However, such developments are unlikely to affect all REITs equally. Some geographic regions may experience greater economic weakness than others, and the businesses of some tenants may suffer more than others. Thus, certain REITs may withstand the effects of a temporary economic slowdown more effectively than other REITs.
office and industrial properties are usually written for longer periods than for other types of properties, thereby providing some protection from a sudden and unexpected decline in market rents. Retail property REITs often structure their leases in a manner that enables the REIT to participate in store revenues if such revenues exceed certain preset levels. If an economic reces-sion reduces these revenues, the REIT may be adversely affected.
EVALUATING REIT STOCKS
In most respects, investors evaluate the stocks of REITs and other publicly traded real estate companies using the same tools and techniques they use to assess the stocks of other public companies. Commonly used indicators of performance and value include earnings growth rates, earnings multiples, dividend yields, and net asset values. However, there are certain issues that are unique to the evaluation of real estate compa-nies that individual investors should be aware of.
Corporate earnings are one measure of how efficiently a com-pany uses its resources to create economic value for its shareholders. They also help to determine the
market value of the firm, and they provide the cash flow required for paying dividends.
Like all other public companies, REITs report their net income and earnings per share using generally accepted accounting principles (GAAP). However, GAAP requires commercial property owners to depreciate the cost of their proper-ties to zero even though well-located and well-maintained properties continue to be highly valuable after 20, 30, or 40 years. Therefore, most REIT analysts and investors consider this measure of net income to be inadequate for properly evaluating the operating performance of real estate companies because the large depreciation charges are widely believed to significantly overstate expenses and understate earnings.
To account for this shortcoming, NAREIT in 1991 adopted funds from operations (FFO), to promote an industry-wide measure of REIT operating performance that would not have this drawback. FFO is intended to be a supplemental measure of earnings and adds back certain depreciation and real estate amortization charges to net income while it excludes gains (or losses) from property sales.
Investors may obtain current and
historical FFO information from company press releases and at company Web sites. Further infor-mation pertaining to FFO, including links to individual company Web sites, is also available at
www.nareit.com.
SOURCES OF GROWTH
Rapid earnings growth is an important attribute of successful companies. However, consistent earnings growth is also important and highly valued by investors. When buying common stocks, investors should focus on future earnings growth, as much as on past performance, and ask themselves where future earnings growth will come from.
In REITs, growth in funds from operations typically comes from several sources, including higher revenues, lower costs, and new business opportunities. The most immediate sources of revenue growth are higher rates of building occupancy and increasing market rents. As long as the demand for new properties remains well bal-anced with the available supply, market rents tend to rise as the economy expands. Low occupancy rates in under-utilized buildings can also be increased when skilled owners upgrade facilities, enhance building services, and more effec-tively market properties to new types of tenants.
Property acquisition and develop-ment programs also create growth opportunities, provided the eco-nomic returns from these invest-ments exceed their cost of financing. Today, for example, some industrial REITs are developing specialized processing and distribution facilities that more effectively meet the business and location requirements of new Internet-based companies.
Like other public companies, REITs and publicly traded real estate companies also grow earnings by improving efficiency and taking advantage of new business opportu-nities. Investors should look for
FIGURE 2. TRAILING PRICE MULTIPLES FOR REITS AND THE S&P 500 (1994-2001)
0.0 2.0 4.0 6.0 8.0 10.0 12.0 14.0 16.0 18.0 20.0
S&P 500 Price-to-Cash Flow Multiples NAREIT Price-to-FFO Multiples Ratio
1
Based on consensus analyst estimates from First Call. Source: National Association of Real Estate Investment Trusts®
, Salomon Smith Barney.
20001
20011
1999 1998 1997 1996 1995 1994
companies that increase their operat-ing (profit) margins by runnoperat-ing their businesses more efficiently and by taking advantage of economies of scale.
Investors should also watch for companies that effectively develop new business activities in conform-ance with the recently enacted REIT Modernization Act. The laws under which REITs operate limit them to providing only those services that were long accepted as being “usual and customary” landlord services, and they were restricted from offer-ing more cuttoffer-ing-edge services provided by other landlords. The REIT Modernization Act, which goes into effect January 1, 2001, allows REITs to create subsidiaries that can provide the important, competitive services that many of today’s tenants desire.
PRICE-EARNINGS MULTIPLES
Another measure commonly used by investors to compare individual stocks is the ratio of the stock price to the company’s most recent or projected annual earnings per share. When evaluating REIT stocks, the appropriate ratio is the stock price divided by FFO per share.
The price-earnings ratio (or price multiple) measures how much current buyers of the stock are willing to pay for each dollar of expected earnings. In general, companies with more rapid or consistent earnings growth tend to be rewarded with higher stock price multiples. Stocks trading at lower multiples are often viewed as providing investors with better value because each dollar of earnings can be purchased for a lower price.
Figure 2 shows the average price-to-FFO per share multiple for REIT stocks using end-of-year stock prices and annual FFO per share for the previous four quarters. The data show that REIT stock-price multiples contracted in 1998 and 1999 as the pace of REIT earnings growth slowed. The data also compare REIT stock price multiples with those of companies in the S&P 500, with S&P
multiples calculated as the ratio of stock price divided by four-quarter trailing cash flow per share, a more appropriate proxy than earnings per share for FFO.
DIVIDEND YIELDS
Investors often look at the dividend yield—the dividend rate divided by the share price—to compare the income-producing ability of alternative investments or to determine which sectors or individual stocks are relatively over-or undervalued. At the end of September 2000, the average dividend yield for all equity REITs was 7.4%, roughly 1.6% above the yield on 10-year Treasury securities. As share prices this year have increased, the yield spread has narrowed but remains wider than its 0.80 percentage point average since the beginning of 1990.
Of course, an extraordinarily high dividend yield may be a sign that, owing to certain problems facing a particular company, investors demand an additional risk premium in their required return. Thus, when evaluating the dividend yield, investors should inquire about a company’s long-term capacity to generate sufficient revenue both to meet and consistently grow its current dividend rate. REIT divi-dends have grown at an average annual rate of 6.6% since 1992, a rate that has exceeded the rate of consumer price inflation each year.
REIT analysts and investors also look at the payout ratio—the ratio of the dividend rate divided by FFO per share—to determine how much of a company’s available cash flow is being used to pay the dividend. REIT payout ratios on average have declined from more than 85% in 1994 and 1995 to 65% in the second quarter of 2000. While maintaining a dividend rate of at least 95% of taxable income during this period, REITs have been reducing the proportion of total available cash flow they use to pay their dividend, thereby increasing
the cushion available to meet current dividend rates.
NET ASSET VALUES
Investors often judge the relative value of a stock by dividing the market price of the stock by the book value per share of the com-pany. A company’s book value is the difference between the company’s assets and liabilities or the sum of retained earnings plus other items under stockholder’s equity. In its simplest terms, this yardstick is used to determine how much more or less investors are willing to pay for the book net worth of the company and the earnings capacity that the net worth represents. When the price-to-book ratio exceeds 1.0, the stock is said to trade at a premium to book value. When the ratio is below 1.0, the stock trades at a discount. Stocks that trade at a discount often are viewed as offering investors more value than stocks priced at a pre-mium, although investors are well-advised to be especially cautious of stocks trading at unusually large premiums or discounts.
Most REIT analysts and investors consider price-to-book value ratios as inappropriate when evaluating REITs. Because a REIT’s real estate assets are valued at their original purchase price less accumulated depreciation, book value accounting may significantly understate the current market value of the REIT’s properties and the genuine earnings capacity of the company. Thus, most REIT analysts and investors use current real estate prices to estimate a REIT’s net asset value as a surro-gate for book value. Many of these analysts also argue that a REIT’s stock ordinarily should be priced above its net asset value to reflect the franchise value created by management. For individual inves-tors, however, estimating net asset values for a REIT would be ex-tremely difficult. Although there is no cost-free source for net asset value, price-to-net asset value figures are available through the industry
publication Realty Stock Review, (published by Rainmaker Publica-tions, 732/493-1999; $269/year).
SECTOR COMPARISONS
For each major property sector of the REIT industry, Table 1 summa-rizes the various quantitative mea-sures commonly used by analysts and investors to evaluate REIT stocks. Sector comparisons provide investors with a starting point when screening for individual stock selections.
Individual investors can find current information on investment performance and operating funda-mentals, at both the sector and company level, in NAREIT’s monthly publication, REIT Watch, AAII’s Stock Investor Pro stock database, REIT research reports available from their brokers, and the financial press.
REAL ESTATE FUNDAMENTALS
Because investors often compare current stock prices to net asset values, investors should be aware of
how well-balanced the supply of new buildings is with the demand for new space. When new construc-tion adds space more rapidly than it can be absorbed, building vacancy rates increase and rents and property values decline, thereby depressing net asset values.
In a strong economy, growth in employment, capital investment, and household spending increases the demand for new office buildings, apartments, industrial facilities, and retail stores. Population growth also boosts the demand for apartments. However, the economy is not always equally strong in all geographic regions, and economic growth may not increase the demand for all property types at the same time. Thus, investors should compare the locations of properties owned by different companies with the relative strength or weakness of real estate markets in those locations. Informa-tion on company properties is available at their Web sites, while information on local and regional real estate markets is available in the financial press.
WHAT TO LOOK FOR
What should individual investors seek in a REIT?
The market usually rewards companies that demonstrate consis-tent earnings and dividend growth with higher price-earnings multiples. Thus, investors should look for REITs and publicly traded real estate companies with the following characteristics:
· Look for companies with a demonstrated ability to grow their earnings in a reliable manner—for example, companies with proper-ties in which rents are below current market rents. Such
properties provide upside potential in equilibrium markets and downside protection when eco-nomic growth slows.
· Seek firms with management teams able to quickly and effec-tively reinvest available cash flow.
· For firms with the ability to develop new properties, look for companies that are able to
consistently complete new projects on time and within budget.
F F O Debt N A V F F O Dividend Payout Dividend 2000 Growth Ratio Premium* Multiple** Yield*** Ratio Growth Property Sector (thru 9/29) (%) (%) (%) (X) (%) (%) (%) Industrial/Office 30.1 11.7 45.4 na 9.3 6.5 62.6 8.8
Office 32.2 10.9 46.7 –25.0 9.0 6.4 62.9 9.8
Industrial 26.2 12.9 43.3 –5.9 9.9 6.2 62.9 3.6
Mixed 27.2 13.0 42.9 –19.7 9.1 7.0 61.1 11.4
Retail 13.4 7.5 54.0 na 7.7 8.5 68.9 3.8
Shopping Centers 9.9 4.0 47.7 na 8.1 8.9 72.4 4.3
Regional Malls 19.0 11.7 61.4 –17.2 7.3 8.1 64.9 3.1
Free Standing 5.9 5.0 42.7 na 7.9 8.8 81.4 na
Residential 24.9 12.4 45.2 na 9.9 6.6 66.9 7.1
Apartments 26.5 12.9 45.5 –16.0 9.9 6.5 66.3 7.1
Manufactured Homes 7.7 6.9 41.2 –17.0 9.8 7.2 73.2 na
Diversified 20.4 0.1 45.4 –16.4 8.9 9.5 69.5 5.3
Lodging/Resorts 35.9 9.2 55.0 –31.1 5.6 10.1 48.3 0.0
Health Care 25.4 –3.7 50.3 na 6.7 9.9 84.3 5.4
Self Storage 10.0 0.2 45.6 –26.5 8.8 5.8 50.1 0.9
Specialty –18.7 –1.8 31.1 na na 7.0 na 9.6
TABLE 1. INVESTMENT CHARACTERISTICS OF REIT SECTORS (THROUGH SECOND QUARTER 2000)
*As of first quarter 2000.
**Based on annual 2000 FFO analyst estimates and prices as of August 31, 2000. *** Through September 30, 2000.
Source: National Association of Real Estate Investment Trusts, Salomon Smith Barney, First Call.
· Be alert for creative man-agement teams with sound strategies for developing new revenue opportunities under the REIT Moderniza-tion Act.
· Finally, investors should look for companies with strong management and operating characteristics. Such characteristics include effective corporate gover-nance procedures, conserva-tive leverage, widely
accepted accounting practices, strong tenant relationships, and a clearly defined operating strategy for succeeding in competi-tive markets.
All of these characteristics inspire confidence in the marketplace and are the same characteristics that individual investors should use when evaluating all companies. ✦