R E S E A R C H
Open Access
Postprandial glycemic response in a
non-diabetic adult population: the effect of
nutrients is different between men and
women
María González-Rodríguez
1*, Marcos Pazos-Couselo
1,2, José M. García-López
1,2, Santiago Rodríguez-Segade
3,
Javier Rodríguez-García
3, Carmen Túñez-Bastida
4and Francisco Gude
5Abstract
Background:There is a growing interest in the pathopysiological consequences of postprandial hyperglycemia. It is well known that in diabetic patients 2 h plasma glucose is a better risk predictor for coronary heart disease than fasting plasma glucose. Data on the glycemic response in healthy people are scarce.
Objective:To evaluate the effect of macronutrients (carbohydrates, fats, and proteins) and fiber on postprandial glycemic response in an observational study of a non-diabetic adult population.
Design:Cross-sectional study. 150 non-diabetic adults performed continuous glucose monitoring for 6 days. During this period they recorded food and beverage intake. The participants were instructed not to make changes in their usual diet and physical exercise.
Variables analyzed included clinical parameters (age, sex, body weight, height, body mass index, blood pressure, and waist measurement), meal composition (calories, carbohydrates, fats, proteins, and fiber) and glycemic postprandial responses separated by sexes.
The study period was defined from the start of dinner to 6 h later.
Results:A total of 148 (51% women) subjects completed all study procedures. Dinner intake was higher in males than in females (824 vs 531 kcal). Macronutrient distribution was similar in both sexes. No significant differences were found in fiber intake between men and women (5.5 g vs 4.5 g).
In both sexes, the higher intake of carbohydrates corresponded to a significantly higher glycemic response (p= 0.0001 in women,p= 0.022 in men). Moreover, in women, as fat intake was higher, a flattening of the postprandial glycemic curve was observed (p= 0.003). With respect to fiber, a significantly lower glycemic response was observed in the group of women whose fiber intake at dinner was higher (p= 0.034).
Conclusions:Continuous glucose monitoring provides important information about glucose levels after meals. In this study, the postprandial glycemic response in women was different from that of men, and carbohydrates were the main determinant of elevated postprandial glucose levels.
Keywords:Postprandial glycemic response, Continuous glucose monitoring, Non-diabetic population, Healthy population
© The Author(s). 2019Open Access This article is distributed under the terms of the Creative Commons Attribution 4.0 International License (http://creativecommons.org/licenses/by/4.0/), which permits unrestricted use, distribution, and reproduction in any medium, provided you give appropriate credit to the original author(s) and the source, provide a link to the Creative Commons license, and indicate if changes were made. The Creative Commons Public Domain Dedication waiver (http://creativecommons.org/publicdomain/zero/1.0/) applies to the data made available in this article, unless otherwise stated. * Correspondence:[email protected]
1Department of Endocrinology and Nutrition, Complejo Hospitalario
Universitario de Santiago de Compostela, Travesía da Choupana, s/n, 15706 Santiago de Compostela, Spain
Background
There is a growing interest in the pathopysiological con-sequences of postprandial hyperglycemia. It is well known that in diabetic patients 2 h plasma glucose is a better risk predictor for coronary heart disease than
fast-ing plasma glucose [1]. Also normoglycemic subjects
with higher levels of 2 h plasma glucose had higher risk of devoloping diabetes [2].
Clinical trials have shown the importance of maintain-ing blood glucose levels after meals within the normal range in patients with type 2 diabetes to prevent its complications and mortality [1,3,4].
The glycemic response to meals has been studied widely in patients with diabetes mellitus, especially in type 1 [5–12]. However, data on the glycemic response to meals in healthy people are scarce. In most previous works, the population samples were small and capillary blood samples were used to analyze glucose levels, resulting in a limited view of the glycemic patterns in free-living conditions. The previous studies were focused on the influence of some nutrient or food on glycemic re-sponse, and they were conducted in controlled conditions or during hospitalization. Few studies have considered the pattern of regular intake that is typically part of daily life, and they do not use continuous glucose monitoring (CGM) as a blood glucose measurements system [13–16].
Continuous monitoring of interstitial blood glucose pro-vides an opportunity to better understand the alterations of glucose metabolism in healthy individuals. It is currently rec-ognized as a good tool to identify glycemic excursions in pa-tients with type 1 and type 2 diabetes mellitus. However, few data are available regarding CGM in healthy people [17]. Un-like capillary blood glucose meters, CGM provides informa-tion about a period of time and can even give informainforma-tion in “real time” about the glucose value, speed, and direction. The inability to detect glycemic fluctuations is another limi-tation of traditional capillary glycemia.
Glycemic fluctuations in the non-diabetic population are closely controlled by physiological mechanisms. Dietary factors also influence glycemic excursions, espe-cially during the postprandial period. Therefore, dietary interventions represent an important strategy to attenu-ate these oscillations and improve postprandial glycemia. The aim of this study was to evaluate the effect of dif-ferent macronutrients (carbohydrates, fats, and proteins) and fiber on postprandial glycemic response in an obser-vational study of a non-diabetic adult population.
Subjects and methods
The present work was carried out within the
epidemiological study “A Estrada Glycation and
Inflammation Study” (AEGIS; trial NCT01796184 at
https://clinicaltrials.gov/ct2/show/NCT01796184?term =NCT01796184&rank=1), a cross-sectional study that
was performed in the municipality of A Estrada, in North-western Spain. An age-stratified random sample of the population aged 18 years and older was drawn from Spain’s National Health System Registry. A total of 1516 subjects agreed to participate in the study, which com-prised an interviewer-administered structured question-naire that included demographic and anthropometric data, a lifestyle description (physical exercise, alcohol con-sumption and smoking), and fasting venous blood sam-pling. In addition, 622 study subjects consented to undergo a 6-day period of CGM [18].
A subsample was taken from the total of monitored pa-tients. The first 150 individuals (75 men and 75 women) who met the following criteria were included: (a) not pre-viously diagnosed with type 2 diabetes, (b) glycated hemoglobin < 6.5% and/or a fasting blood glucose < 126 mg/dL, (c) ability to perform CGM system, and (d) ability to provide informed written consent.
The protocol was as follows: All subjects were succes-sively convened for one day in the Primary Care Center for evaluation, including: (a) an interviewer-administered structured questionnaire that included demographic and anthropometric data, (b) fasting venous blood sampling, and (c) a 6–day period of CGM.
CGM procedures
At the start of each monitoring period, a research nurse inserted a sensor (Enlite™Medtronic) subcutaneously into the abdomen of each participant and instructed them in the use of the device (iPro™2 Medtronic). The sensor con-tinuously measures interstitial glucose levels in the sub-cutaneous tissue, recording values every 5 min, within a range of 40 to 400 mg/dL (2.2–22.2 mmol/L). Participants were provided with a conventional glucometer (One Touch Verio Pro; LifeScan, Milpitas, CA, USA) as well as compatible lancets and test strips for calibrating the CGM device. Subjects were asked to make at least 3 capillary blood glucose measurements (before the main meals).
During the CGM period, participants also monitored their intake of food and beverages.
Dietary record
The individuals recorded in detail everything they ate and drank, indicating the amounts of food and drinks ingested during the monitoring period, preparation mode (ingredients, cooking method, sauces, brand of the products) and meal times.
The participants were instructed not to make changes in their usual diet or their daily routine of work and physical exercise.
research dietitian checked the intake records and asked the participants for additional data if records were in-complete or implausible. In those inin-complete records, the quantification of the amounts of food was made with the help of a visual method, consisting of a book with a series of photographs of food and dishes served, of dif-ferent sizes, through which the participants could indi-cate in visual form the amount of food eaten [19].
The assessment of the dietary record was carried out using the software Dietowin® 7.1.
Ethical considerations
The present study was reviewed and approved by the Clinical Research Ethics Committee from Galicia, Spain
(CEIC2012–025). Written informed consent was
ob-tained from each participant in the study, which con-formed to the current Helsinki Declaration.
Data analysis
Variables analyzed included clinical parameters (age, sex, body weight, height, body mass index, blood pressure, and waist measurement), meal composition (carbohy-drates, fats, proteins, fiber, and calories) and glycemic postprandial responses.
The study period was defined from the start of dinner to 6 h later. The glycemic responses separated by sexes were compared according to intake of carbohydrates, fats, proteins and fiber.
Those subjects who met the prediabetes criteria according to the American Diabetes Association (fasting glucose≥100 mg/dL and/or glycated hemoglobin≥5.7%) were taken into account when performing the multivariable analysis [20].
Statistical analysis
Generalized additive mixed-effects models (GAMMs) were used to describe changes over time in the glucose levels, which are modeled as penalized splines with ran-dom coefficients. As mixed models permit the incorpor-ation of autocorrelincorpor-ation structures in residuals, GAMMs with the incorporation of autoregressive and moving aver-age structures (as suggested by the exploratory analysis) were also investigated. Because of differences in behaviors of males and females, to assess changes in glucose levels, a nonlinear mixed-effects model was performed separately for each gender with the following structure:
g μij ¼Xiθþfið Þ þx1i fið Þ þx2i fiðx3i;x4iÞ þ…þεijþZijαi;
where μij≡E(Yij),Yij is the response variable (glucose),
X
i is the arrow in the matrix for the parametric compo-nent model, θ is the corresponding parameter vector, the f(x)´s are smooth functions of the covariates, εijare N(0, σ2) measurement errors, and Zijαi areN(0,D(σ2))
random effects [21].
All analyses were performed in R (version 3.4.3) using the packages“mgcv”,“nmle”and “gamm4.” These pack-ages are freely available in R project (cran.r-project.org).
Results
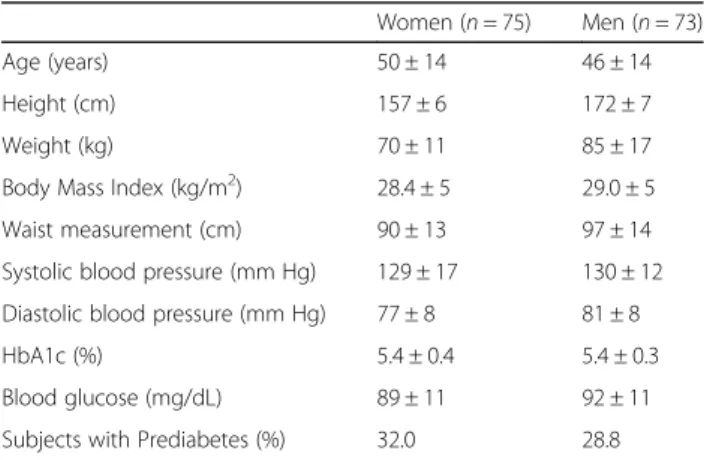
A total of 150 subjects (75 men and 75 women) with a complete continuous glucose monitoring were included. Those individuals for whom the CGM was incomplete (whether by sensor signal loss during the test or lack of capillary blood glucose data) were previously excluded. Among this initial sample, participants who had an un-reliable dietary record were not included. Finally, 148 in-dividuals (51% women) successfully completed all study procedures. Clinical parameters are detailed in Table1.
A total of 888 dinners were analyzed (6 dinners for each individual). The mean energy intake at dinner was 680 ± 385 kcal. The intake was higher in males than in females (824 vs 531 kcal). Macronutrient distribution was similar in both sexes (19% proteins, 44% drates and 37% fats in men; 20% proteins, 44% carbohy-drates and 36% fats in women). There were no significant differences in the amount of fiber between men and women (5.5 g vs 4.5 g).
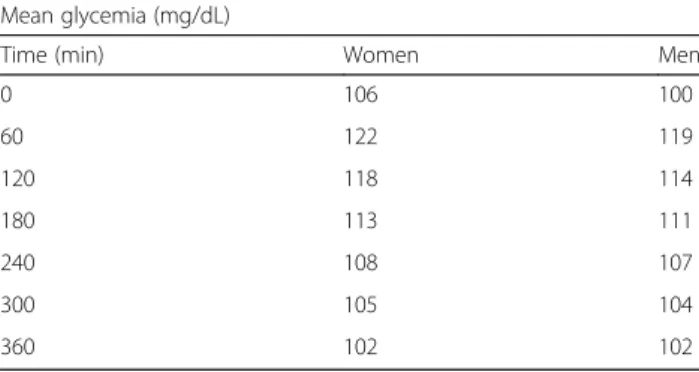
The average duration of all CGM was 5.8 days (139.2 h), which means 1670 individual interstitial measurements. The mean blood glucose level before starting dinner in-take was 106 mg/dL in women and 100 mg/dL in men. The mean glycemia measurements of each hour during the observation period (6 h) are shown in Table2.
The percentage of values over the range of normal gly-cemia (> 140 mg/dL) in the postprandial period analyzed (6 h) was 9.7% in women and 7.1% in men.
Glycemic response curves separated by sexes are shown in Fig.1.
Glycemic response in women
Those women who started with higher blood glucose levels before analyzed meal and those who had prediabetes
Table 1Clinical characteristics (mean ± standard deviation)
Women (n= 75) Men (n= 73)
Age (years) 50 ± 14 46 ± 14
Height (cm) 157 ± 6 172 ± 7
Weight (kg) 70 ± 11 85 ± 17
Body Mass Index (kg/m2) 28.4 ± 5 29.0 ± 5
Waist measurement (cm) 90 ± 13 97 ± 14
Systolic blood pressure (mm Hg) 129 ± 17 130 ± 12
Diastolic blood pressure (mm Hg) 77 ± 8 81 ± 8
HbA1c (%) 5.4 ± 0.4 5.4 ± 0.3
Blood glucose (mg/dL) 89 ± 11 92 ± 11
presented a statistically higher postprandial glycemic response (Tables 3 and4).
In relation to the nutrients analyzed, we found that carbohydrates, lipids, and fiber affect the postprandial glycemic response in women, although in different ways.
With regard to the influence of carbohydrates on postprandial glycemia, we observed that higher intakes correspond to a significantly higher glycemic response (Tables3and4, Fig.2). Women who ingested more carbo-hydrates at dinner had a higher glycemic peak, and they took longer to return to basal glycemic values (Fig.2).
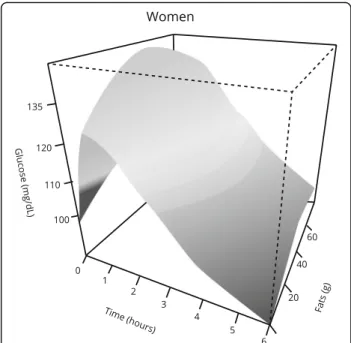
With regard to the effect of fats, women who ingested more lipids at dinner had longer lasting high glucose values, and they took longer to return to pre-meal glycemia. As fat intake was higher, a “flattening” of the postprandial glycemic curve was observed (Table 3 and 4, Fig. 3).
With respect to fiber intake, a significantly lower gly-cemic response was observed in the group of women whose fiber intake at dinner was higher (Tables3 and4,
Fig.4). Women who consumed a higher amount of fiber
at dinner showed a lower postprandial glycemic peak as compared with those who hardly took any fiber.
Glycemic response in men
As in the group of women, men who had a higher inter-stitial glucose values before dinner showed a higher postprandial glycemic response (Tables5and6).
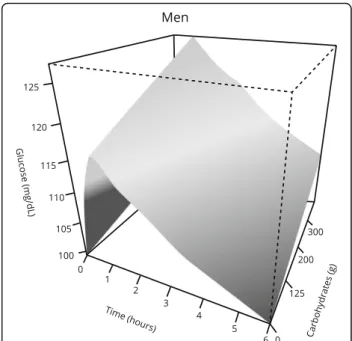
In relation to effects of nutrients analyzed, there were no significant differences in glycemic responses related to the amount of fats, proteins or fiber. Only intake of carbohy-drates showed a significant influence on postprandial glucose values. Thus, subjects who consumed a higher quantity of carbohydrates at dinner showed a greater statis-tically significant glycemic response (Tables5and6, Fig.5).
Table 2Mean glycemia during the postprandial period
Mean glycemia (mg/dL)
Time (min) Women Men
0 106 100
60 122 119
120 118 114
180 113 111
240 108 107
300 105 104
360 102 102
Fig. 1Glycemic response curves. Total glycemic response curves (mg/dL glucose) of the population sample (separated by sex) after dinner (6 h– postprandial period). The white line in the middle represents the mean
Table 3Multivariable analysis: Postprandial glycemic response
in women
Coefficient Standard Error pvalue
Basal glycaemia (mg/dL) 0.0060 0.0003 0.0000
Carbohydrates (g) 0.0005 0.0002 0.0094*
Fiber (g) −0.0028 0.0013 0.043**
Prediabetes (yes) 0.0692 0.0238 0.0037
The data in the table show the variables whose effect on the postprandial glycemic curve reached statistical significance
Discussion
The present study shows that CGM is a tool that allows a better understanding of glycemic response to meals. One of the advantages of using this system is that volun-teers were in free-living conditions and it is likely to reflect a more representative situation than a laboratory setting. There are few studies that allow participants to maintain their usual routine of meals and exercise. Most studies are conducted under controlled conditions, and in some of them, the studies are done under hospital admission.
The average duration of the monitoring period in our study was 5.8 days. Previous studies were carried out with shorter monitoring periods [22,23].
We analyzed 148 individuals. Thus far, published works used smaller populations that rarely exceeded 100 individuals [22–25].
In relation to the percentage of time in the hyperglycemia range, the results of previous works were variable, ranging from 1.8% [24] to 13% [21], and always referring to the ana-lysis of 24 h a day, not just the postprandial period.
Carbohydrate is the dietary component that primarily influences blood glucose response. Previous studies have confirmed that the total intake of carbohydrates,
either as a “snack” or main meal, can consistently
Table 4Multivariable analysis: Postprandial glycemic response
in women
Edf pvalue
Time (min) 8.901 0.0000
Fats (g) 1.731 0.04*
*See Fig.4for a better understanding edf: estimated degrees of freedom R2
= 0.38
Fig. 2Effect of carbohydrates on the postprandial glycemic curve over time in women. Significantly different glycemic response was observed in those women who consumed more carbohydrates.p< 0.05 using generalized additive mixed-effects models (GAMMs)
Fig. 3Effect of fats on the postprandial glycemic curve over time in women. Significantly different glycemic response was observed in those women who consumed more fats.p< 0.05 using generalized additive mixed-effects models (GAMMs)
predict the concentrations of glucose in the postpran-dial period. Wolever et al. concluded that carbohydrate content and glycemic index together explained about 90% of the variation in the glycemic response [26].
In the present study, the results showed that the gly-cemic response was significantly higher in those individ-uals who consumed a greater amount of carbohydrates at dinner, in both sexes.
The influence of fats on the postprandial glycemic pro-file was different in women compared with men. In the group of women, the glycemic response was significantly different in those who consumed more fat. In more de-tail, it a“flattening”of the glycemic curve was observed.
In a study in which 11 healthy subjects were selected to evaluate the effect of adding fat to a meal, the findings are consistent with ours. Thus after intake of a high-fat meal, both the glycemic response (incremental area under the curve) and the glycemic peak were lower [27].
In one of the last published works that refer to this issue, the authors also observed the same effect. In that study, the glycemic response (capillary blood glucose up to 3 h) was evaluated in a sample of 12 healthy subjects after adding peanut oil to a white rice meal. A significant decrease occurred in the incremental area under the curve and glycemic peak [28].
The amount of dietary fat is one of the main factors that modify the glycemic response after ingestion of mixed meals. This is probably because of a delay in ab-sorption of glucose in the small intestine, secondary to inhibition of gastric emptying produced by the presence of fat. Furthermore, the fat content of meals produces an increased incretin secretion, which also implies a reduc-tion of the glycemic response [29].
Another explanation for flattened blood glucose in women could be their lower muscle mass and higher
total body fat that will produce a lower glucose uptake in the muscle cells. As women have lower muscle mass they will have lower lipoprotein lipase activity and a less effective triglycerides mechanism removal [30]. Besides, lipid accumulation in skeletal muscle impairs insulin sig-naling and then contributes to the flattened blood glu-cose response [31].
The differences found between men and women could also be related with gonadal hormones. Women and men of similar age have no differences in insulin sensitivity but after menopause there is a decline in insulin sensitivity and an increase in fat mass [32]. A significant amount of women in our study are probably in the menopause period. That circumstance could have influenced the glu-cose response to fat intake. Also estradiol has a positive influence on insulin sensitivity and beta cells pancreatic function that could be loss after menopause [33].
In relation to the effect of fiber, in our group of women, a significantly lower postprandial glycemic re-sponse was observed in those who consumed more fiber at dinner. By contrast, in the group of men, no different glycemic responses were found depending on fiber in-take at dinner.
Potter analyzed blood glucose (3 h) after eating 4 meals with the same amount of macronutrients and dif-ferent fiber content. The biggest difference was observed between 30 and 60 min postprandially, where food with less fiber produced a higher peak. At 3 h after ingestion of food with more fiber, glucose was lower [34]. Brynes et al. found that fasting blood glucose, mean blood
Table 5Multivariable analysis: Postprandial glycemic response
in men
Coefficient Standard Error pvalue
Basal glycaemia (mg/dL) 0.0064 0.0004 0.0000
Carbohydrates (g) 0.0003 0.0001 0.0186*
Fibra (g) −0.0004 0.0011 0.7157
Prediabetes (yes) 0.0254 0.0232 0.2726
The data in the table show the variables whose effect on the postprandial glycemic curve reached statistical significance
*See Fig.5for a better understanding
Table 6Multivariable analysis: Postprandial glycemic response
in men
Edf pvalue
Time (min) 8.932 0.0000
Fats (g) 1.000 0.553
edf: estimated degrees of freedom R2
= 0.33
glucose, and the AUC were lower after increasing fiber intake for a week (13.5 g vs 22.3 g) in the diet of 9 healthy subjects. The analyzed period was 24 h, and the participants used the CGM system [14]. Similar results were obtained by Sun et al., who compared the glycemic response after ingestion of two meals with same amount of carbohydrates and different fiber content (rice with and without vegetables) [28].
Dietary fiber has also been reported to modify gly-cemic response. This effect may be due to the delay pro-duced by fiber in the following processes: starch digestion in the stomach, transition of stomach contents into the duodenum, hydrolysis of the polysaccharides in the duodenum, and absorption time of monosaccharides [35]. In addition, fiber intake is associated with increased sensitivity to insulin, resulting in lower levels of plasma insulin and lower blood glucose levels [36].
In females, those who are in a prediabetes situation had a significantly higher postprandial glucose levels. The same fact was observed in the group of males, but without reaching statistical significance. However, the effect of nu-trients on the postprandial glycemic response was not modified by this factor in either of the two groups.
In sum, the postprandial glycemic response in women was different from that of men. The causes of the differ-ences in glucose control are not clearly understood, al-though gender-related differences in body fat distribution and hormones as well as slower absorption in women may contribute to the observed gender dimorphism [37,38].
Several epidemiological studies revealed sex-specific dif-ferences during the oral glucose tolerance test (OGTT), such as a higher prevalence of glucose intolerance in fe-males. To date, the gender-related differences in the inci-dence of impaired glucose tolerance (IGT) are still under debate. Sicree et al. [39] reported higher IGT prevalence in Australian women in comparison with men and as-cribed this observation to differences in height between both genders. In addition, they supposed that taller per-sons (mostly males) have more muscle mass, which is the major tissue involved in glucose uptake.
Anderwald et al. [37] found that females showed lower fasting endogenous glucose production and decreased plasma glucose levels during the early course of the OGTT but higher plasma glucose concentrations from 120 to 180 min. They also observed that the glucose ab-sorption rates were higher in males in the initial phase of the OGTT and elevated in females in the final part of the 180 min OGTT. The best-suited value to de-scribe OGTT glucose absorption velocity is the half-life of glucose in the gut, which was prolonged in fe-males in comparison with fe-males. Thus, these differ-ences in glucose absorption could serve to explain higher glucose concentrations at the end of the OGTT in females [37].
Furthermore, glucose levels also depend on other vari-ables, such as insulin sensitivity, insulin secretion, hep-atic glucose absorption and release of glucagon and incretins. Some of these variables were shown to differ
between men and women [40].
There are some limitations in our study. It should be taken into consideration that in the dietary record indi-viduals may forget some information or underestimate the intake. In addition, physical activity could affect the glycemic response and it was not taken into account when performing the analysis, because it was not the ob-jective of the study. Otherwise, the fact of having done the study in free living conditions and in a large number of subjects, gives an external validity and the results could be generalized to other groups of populations.
Future studies are necessary to study in depth how gender affects the postprandial glycemic responses. In-crease knowledge of glucose response to meals can con-tribute to better management of diseases related to glucose metabolism.
Conclusions
We conclude that glycemic response to meals is differ-ent in men and women. Meal carbohydrates are the main determinants of elevated postprandial glucose levels and the glycemic response. In women, fat content of meal is linked to higher postprandial glucose values and a flattening of postprandial glycemic response; and fiber produces a decreased glucose response. No effect of protein content was observed in either sex.
Abbreviations
CGM:Continuous Glucose Monitoring; GAMM: Generalized Additive Mixed-effects Models; IGT: Impaired Glucose Tolerance; OGTT: Oral Glucose Tolerance Test
Acknowledgments
Not applicable.
Authors’contributions
The authors’contributions were as follows: FG and JMGL designed the research; MGR, MPC, SRS, JRG and CTB conducted the research; FG analyzed the data and performed the statistical analysis; MGR, MPC, JMGL and FG wrote the manuscript; JMGL and FG had primary responsibility for final content. All authors read and approved the final manuscript.
Funding
This research project was supported by grants from Spain’s Carlos III Institute of Health (Instituto de Salud Carlos III/ISCIII) (PI11/02219, PI16/01395) and the European Regional Development Fund (FEDER). This work was also supported by a grant from Medtronic Ibérica.
Availability of data and materials
All data generated or analysed during this study are included in this published article.
Ethics approval and consent to participate
Consent for publication
Not applicable.
Competing interests
The authors declare that they have no competing interests.
Author details
1Department of Endocrinology and Nutrition, Complejo Hospitalario
Universitario de Santiago de Compostela, Travesía da Choupana, s/n, 15706 Santiago de Compostela, Spain.2Psychiatry, Radiology and Public Health
Department, University of Santiago de Compostela, Santiago de Compostela, Spain.3Department of Biochemistry and Molecular Biology, University of
Santiago de Compostela, Santiago de Compostela, Spain.4Primary Care
Center of A Estrada (CTB), Santiago de Compostela, Spain.5Clinical
Epidemiology Unit, Complejo Hospitalario Universitario de Santiago de Compostela, Santiago de Compostela, Spain.
Received: 8 February 2019 Accepted: 18 June 2019
References
1. DECODE Study Group, the European Diabetes Epidemiology Group. Glucose tolerance and cardiovascular mortality: comparison of fasting and 2-hour diagnostic criteria. Arch Intern Med. 2001;161:397–404.
2. Abdul-Ghani MA, Williams K, DeFronzo R, Stern M. Risk of progression to type 2 diabetes based on relationship between postload plasma glucose and fasting plasma glucose. Diabetes Care. 2006;29:1613–8.
3. Haffner SM. Can reducing peaks prevent type 2 diabetes: implication from recent diabetes prevention trials. Int J Clin Pract Suppl. 2002;129:33–9. 4. Knowler WC, Fowler SE, Hamman RF, Chistophi CA, Hoffman HJ, Brenneman
AT, et al. Diabetes prevention program research group. 10–year follow-up of diabetes incidence and weight loss in the diabetes prevention program outcomes study. Lancet. 2009;374:1677–86.
5. Lee SE, Cao M, Sajid S, Hayes M, Choi L, Rother C, et al. The dual-wave bolus in feature in continuous subcutaneous insulin infusion pumps controls prolonged post-prandial hyperglycaemia better than bolus in type 1 diabetes. Diabetes Nutr Metab. 2004;17:211–6.
6. Lodefalk M, Amant J, Bang P. Effects of fat supplementation on glycaemic response and gastric emptying in adolescents with type 1 diabetes. Diabet Med. 2008;25:1030–5.
7. O’Connell MA, Gilbertson HR, Donath SM, Cameron FJ. Optimizing postprandial glycemia in pediatric patients with type 1 diabetes using insulin pump therapy: impact of glycemic index and prandial bolus type. Diabetes Care. 2008;31:1491–5.
8. McDonald K, Lowe JM, Barker D, Mensch M, Attia J. Effect of popular takeaway foods on blood glucose levels in type 1 diabetes mellitus patients on intensive insulin therapy. Int J Clin Pract. 2009;63:189–94.
9. Lindholm-Olinder A, Runefors J, Smide B, Kernell A. Post-prandial glucose levels following three methods of insulin bolusing: a study in adolescent girls and in comparison with girls without diabetes. Pract Diabetes Int. 2009;26:110–5. 10. Borie-Swinburne C, Sola-Gazagnes A, Gonfroy-Leymarie C, Boillot J, Boitard
C, Larger E. Effect of dietary protein on post-prandial glucose in patients with type 1 diabetes. J Hum Nutr Diet. 2013;26:606–11.
11. Smart CEM, Evans M, O’Connell SM, McElduff P, Lopez PE, Jones TW, et al. Both dietary protein and fat increase postprandial glucose excursions in children with type 1 diabetes, and the effect is additive. Diabetes Care. 2013;36:3897–902.
12. García - López JM, González - Rodríguez M, Pazos - Couselo M, Gude F, Prieto -Tenreiro M, Casanueva F. Should the amounts of fat and protein be taken into consideration to calcúlate the lunch prandial insulin bolus? Results from a randomized crossover trial. Diabetes Technol Ther. 2013;15:166–71.
13. Freckmann G, Hagenlocher S, Braumstark A, Jendrike N, Gillen RC, Rössner K, et al. Continuous glucose profiles in healthy subjects under everyday life conditions after different meals. J Diabetes Sci Technol. 2007;1:695–703. 14. Brynes AE, Adamson J, Dornhorst A, Frost GS. The benefitial effect of a diet
with low glycaemic index on 24h profiles in healthy young people as assessed by continuous glucose monitoring. Br J Nutr. 2005;93:179–82. 15. Chlup R, Peterseon K, Zapletalová J, Kudlová P, Seckar P. Extended prandial
glycemic profiles of foods as assessed using continuous glucose monitoring enhance the power of the 120-minute glycemic index. J Diabetes Sci Technol. 2010;4:615–24.
16. Black RN, Spence M, McMahon RO, Cuskelly GJ, Ennis CN, McCance DR. Effect of eucaloric high- and low-sucrose diets with identical macronutrient profile on insulin resistance and vascular risk. Diabetes. 2006;55:3566–72.
17. Derosa G, Salvadeo S, Mereu R, D’Angelo A, Ciccarelli L, Piccinni MN, et al. Continuous glucose monitoring system in free-living healthy subjects: results from a pilot study. Diabetes Technol Ther. 2009;11: 159–69.
18. Gude F, Díaz-Vidal P, Rúa-Pérez C, Alonso-Sampedro M, Fernández-Merino C, Rey-García J, et al. Glycemic variability and its association with demographics and lifestyles in a general adult population. J Diabetes Sci Technol. 2016;11:780–90.
19. Russolillo Femenías G, Marques-Lopes I. Guía visual de alimentos: Álbum fotográfico de porciones de alimentos; 2011.
20. American Diabetes Association. Standards of medical care in diabetes. Diabetes Care. 2019;42(Suppl 1):S16–7.
21. Wood SN. Generalized additive models. An introduction with R. 1sted.
Chapman & Hall/CRC. In: Taylor and Francis group; 2006.
22. Hill NR, Oliver NS, Choudhary MD, Levy JC, Hindmarsh P, Matthews DR. Normal reference range for mean tissue glucose and glycemic variability derived from continuous glucose monitoring for subjects without diabetes in different ethnic groups. Diabetes Technol Ther. 2011;13:921–8. 23. Nomura K, Saitoh T, Kim GU, Yamanouchi T. Glycemic profiles of healthy
individuals with low fasting plasma glucose and HbA1c. ISRN Endocrinology 2011, 435047 (DOI: doi:https://doi.org/10.5402/2011/435047).
24. Borg R, Kuenen JC, Carstensen B, Zang H, Nathan DM, Heine RJ, et al. ADAG Study Group. Real-life glycaemic profiles in non-diabetic individuals with low fasting glucose and normal HbA1c: the A1C derived average glucose (ADAG) study. Diabetologia. 2010;53:1608–11.
25. Wijsman CA, van Heemst D, Hoogeveen ES, Slagboom PE, Maier AB, de Craen AJ, et al. Ambulant 24-h glucose rhythms mark calendar and biological age in apparently healthy individuals. Aging Cell. 2013;12:207–13. 26. Wolever TM, Yang M, Zeng XY, Atkinson F, Brand–Miller JC. Food glycemic index, as given in glycemic responses elicited by composite breakfast meals. Am J Clin Nutr. 2006;83:1306–12.
27. Hätonen KA, Virtamo J, Eriksson JG, Sinkko HK, Sundvall JE, Valsta LM. Protein and fat modify the glycaemic and insulinaemic responsed to a mashed potato-based meal. Br J Nutr. 2011;106:248–53.
28. Sun L, Ranawana DV, Leow MKS, Henry CJ. Effect of chicken, fat and vegetable on glycaemia and insulinaemia to a white rice-based meal in healthy adults. Eur J Nutr. 2014;53:1719–26.
29. Collier G, O’Dea K. The effect of coingestion of fat on the glucose, insulin, and gatric inhibitory polypeptide responses to carbohydrate and protein. Am J Clin Nutr. 1983;37:941–4.
30. Freese EC, Gist NH, Cureton KJ. Effect of prior exercise on postprandial lipemia: an updated quantitative review. J Appl Physiol. 2014;116:67–75. 31. Samuel VT, Shulman GI. The pathogenesis of insulin resistance: integrating
signaling pathways and substrate flux. J Clin Invest. 2016;126:12–22. 32. Carr MC. The emergence of the metabolic syndrome with menopause.
J Clin Endocrinol Metab. 2003;88:2404–11.
33. Mauvais-Jarvais FJ, Clegg DJ, Hevener AL. The role of estrogens in control of energy balance and glucose homeostasis. Endocr Rev. 2013; 34(3):309–38.
34. Potter JG, Coffman KP, Reid RL, Krall JM, Albrink MJ. Effect of test meals of varying dietary fiber content on plasma insulin and glucose response. Am J Clin Nutr. 1981;34:328–34.
35. Nishimune T, Yakushiji T, Sumimoto T, Taguchi S, Konishi Y, Nakahara S, et al. Glycemic response and fiber content of some foods. Am J Clin Nutr. 1991;54:414–9.
36. Giacco R, Clemente G, Riccardi G. Dietary fibre in treatment of diabetes: myth or reality? Dig Liver Dis. 2002;34(Suppl 2):S140–4.
37. Anderwald C, Gastaldelli A, Tura A, Krebs M, Promintzer-Schifferl M, Kautzky-Willer A, et al. Mechanism and effects of glucose absorption during an oral glucose tolerance test among females and males. J Clin Endocrinol Metab. 2011;96:515–24.
38. Geer EB, Shen W. Gender differences in insulin resistance, body composition and energy balance. Gend Med. 2009;6:60–75.
40. Kautzky-Willer A, Brazzale AR, Moro E, Vrbíková J, Bendlova B, Sbrignadello S, et al. Influence of increasing BMI on insulin sensitivity and secretion in normotolerant men and women of a wide age span. Obesity (Silver Spring). 2012;20:1966–73.
Publisher’s Note