METHODOLOGIES FOR DETERMINING
CONSTRUCTION CONTRACT TIME AND EVALUATING
CONTRACT TIME EXTENSIONS
FINAL REPORT
SCDOT Research Project 652:
Construction Contract Time/Construction Contract Time Extension
Barton Lee Stoll, James Edward O’Reilly, and
Lansford C. Bell
Department of Civil Engineering
Clemson University
ABSTRACT
This study summarizes research conducted for the South Carolina Department of Transportation on procedures for determining construction contract time and evaluating contract time extensions. The objectives of this research were to identify best practice approaches to project time duration estimates, to evaluate the current methods being used, to recommend changes to improve SCDOT’s current process without significantly increasing cost of construction, and to recommend changes to improve the process for calculating contract time extensions.
It has been documented by the Transportation Research Board that there has been a shift in the type of highway construction being performed and that current projects tend to have a greater impact on the traveling public. Keeping construction times short on heavily traveled roads is important to minimize economic impact and delays to public users. Currently many states are working to improve the procedures they use for determining contract times. Several methods are being used which range from manual estimation techniques using spreadsheets, to specially developed computer systems which use critical path scheduling techniques.
This study discusses methods being used by state Departments of Transportation for determining contract time and evaluating contract time extensions. It also examines using commercially available scheduling software in conjunction with production rate data for calculating contract completion dates. Previously completed projects are used as case studies to compare the current estimating method to the scheduling software
estimation and actual project completion date. Several of these projects were also used evaluate scheduling software’s ability to evaluate contract time extension.
The finding of this research indicate that commercially available scheduling software can be used to consistently estimate contract time durations and evaluate requests for contract time extensions. Computer generated contract time estimations are comparable to the method currently being used and can be used on multiple project types with favorable results. Computer scheduling software can also be used to estimate contract time extensions and evaluate the impact of granting extension on the project as a whole.
TABLE OF CONTENTS Page TITLE PAGE ... i ABSTRACT... ii LIST OF TABLES... v LIST OF FIGURES ... vi CHAPTER 1. INTRODUCTION ... 1 Background ... 1 Research Objectives... 8 Research Methodology ... 9 2. CURRENT PRACTICES ... 15
Current Practices Survey... 15
General Findings and Survey Results ... 16
Specific Practices for Contract Time Determination ... 27
Specific Practices for Contract Time Extensions... 31
3. CPM SCHEDULING... 35
Logic Development... 35
Primavera Capabilities ... 35
Using Primavera to Calculate Contract Time ... 37
Using Primavera to Evaluate Time Extensions ... 46
Primavera Templates ... 49
4. CASE STUDIES... 51
Case Study Methodology... 51
Case Study Summery of Results... 53
Case Study Results for Evaluating Contract Time Extensions ... 71
Findings... 76
Primavera User Survey Results ... 88
5. CONCLUSION AND RECOMMENDATIONS ... 93
Table of Contents (Continued)
Research Limitations ... 94
Conclusion ... 95
Recommendations... 99
APPENDICES ... 101
Appendix A. Survey of Current Practices... 102
Appendix B. Primavera User Survey... 116
Appendix C. Project Type Logic Diagrams ... 120
Appendix D. Case Study Data Sheets ... 140
Appendix E. SCDOT Working Day Conversion Tables ... 165
LIST OF TABLES
Table Page
2.1: Current Practices Survey Results for Question 2... 17
2.2: Current Practices Survey Results for Question 3... 18
2.3: Current Practices Survey Results for Question 5... 20
2.4: Methods Used for Determining Production Rate Values ... 21
2.5: Percentage of DOT’s Using Detailed Analysis ... 22
2.6: Circumstances that Alter Standard Approach to Determining Contract Time ... 23
2.7: Current Practices Survey Results for Question 1... 24
2.8: Current Practices Survey Results for Question 6... 26
2.9: Maryland’s Project Categories and Quantity of Work Items ... 29
3.1: Primavera Time Extension Results... 48
4.1: Resurfacing Project Completion Date Summery... 54
4.2: Resurfacing Project Working Day Difference... 54
4.3: Bridge Replacement Project Completion Date Summery ... 58
4.4: Intersection Improvement Project Completion Date Summery... 60
4.5: Intersection Improvement Project Working Day Difference... 60
4.6: Secondary Improvement Project Completion Date Summery... 64
4.7: Secondary Improvement Project Working Day Difference... 64
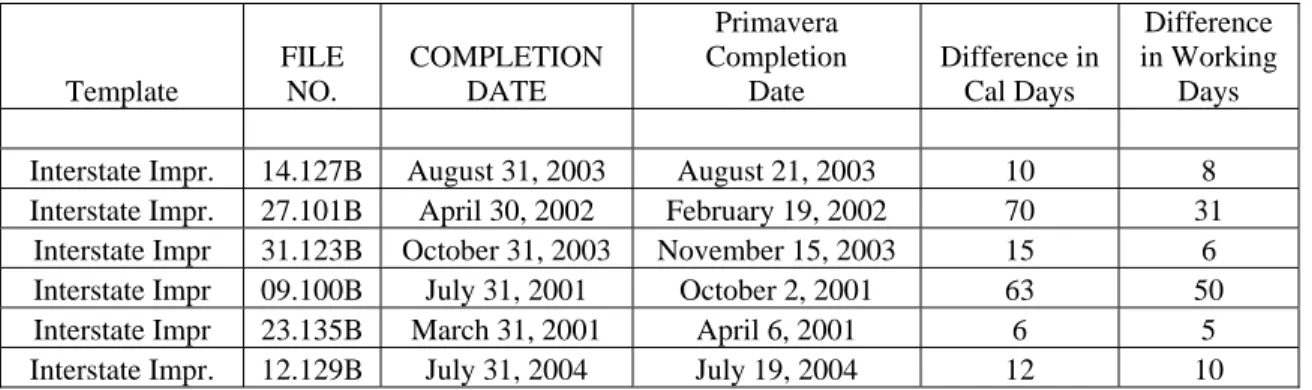
4.8: Interstate Improvement Project Completion Date Summery... 67
4.9: Interstate Improvement Project Working Day Difference... 67
4.11: Completion Dates Comparison with Modified Letting Date for
Contract Extensions ... 72
4.12 Estimated Total Number of Working Days ... 78
4.13 Estimated and Actual Completion Dates ... 80
4.14 Calendar Day Difference Between Primavera Estimation and Project Substantial Completion Date ... 82
4.15: Primavera User Survey Results for Questions 1 Through 9 ... 90
D.1: Bridge Activity Worksheet for 42.471A... 146
D.2: Bridge Worksheet for 29.106B ... 148
D.3: Bridge Worksheet for File No. 26.100B ... 150
E.1: SCDOT Working Day Conversion Chart... 165
LIST OF FIGURES
Figure Page
2.1: Time Requirement by Project Type... 20
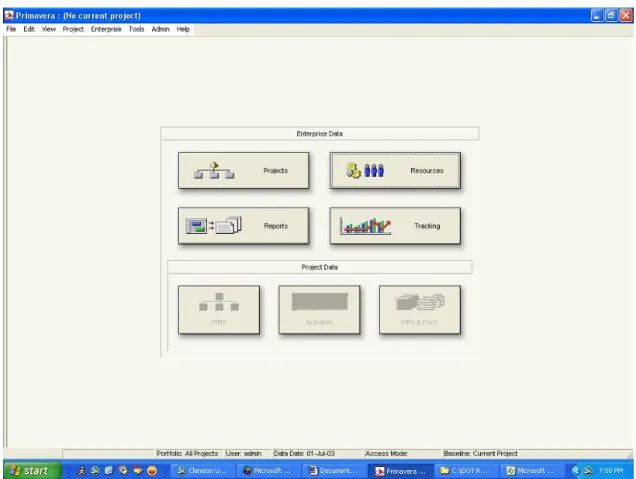
3.1: Primavera’s “No Current Project” Screen ... 39
3.2: Primavera’s Default Import Project Screen ... 40
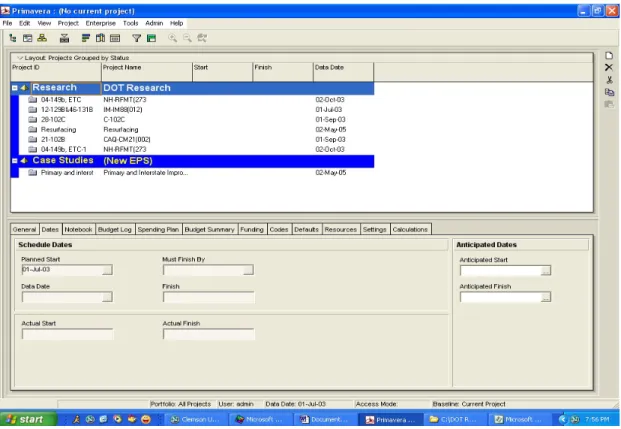
3.3: Primavera’s Renamed Project Screen... 40
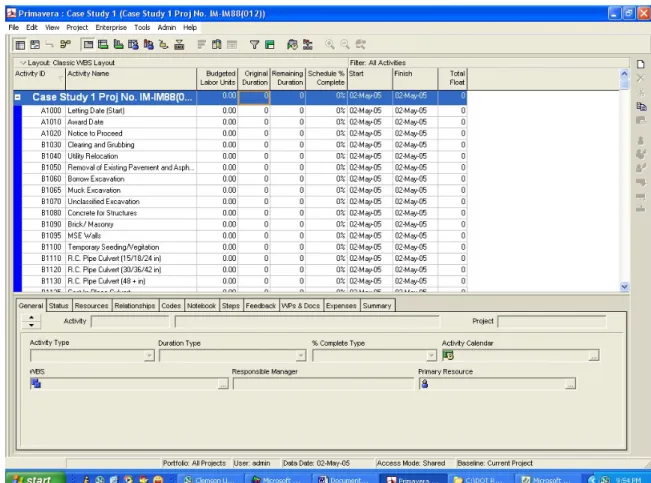
3.4: Primavera’s Activity Table View ... 41
3.5: Primavera’s Calendar Association... 42
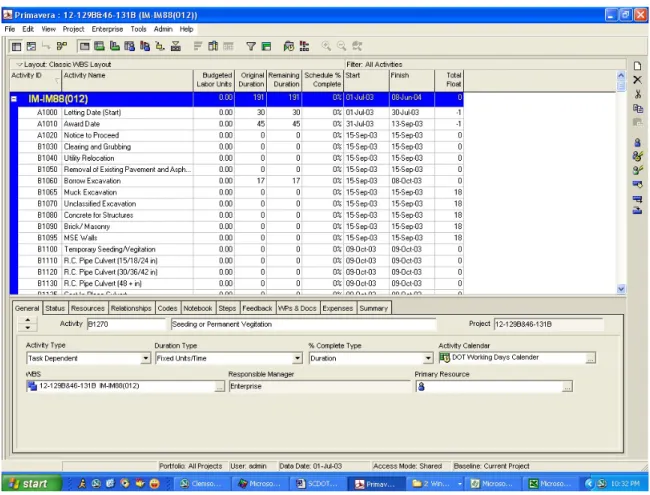
3.6: Primavera’s Updated Project Completion Date... 43
3.7: Primavera’s Gantt Chart View... 44
3.8: Primavera Logic Diagram... 45
3.9: Adding Float Columns... 47
C.1: Resurfacing Logic Part 1... 120
C.2: Resurfacing Logic Part 2... 121
C.3: Bridge Replacement Logic Part 1 ... 122
C.4: Bridge Replacement Logic Part 2 ... 123
C.5: Bridge Replacement Logic Part 3 ... 124
C.6: Bridge Replacement Logic Part 4 ... 125
C.7: Bridge Replacement Logic Part 5 ... 126
C.8: Bridge Replacement Logic Part 6 ... 127
C.9: Bridge Replacement Logic Part 7 ... 128
C.10: Bridge Replacement Logic Part 8 ... 129
C.12: Intersection Improvements Logic Part 2 ... 131
C.13: Intersection Improvements Logic Part 3 ... 132
C.14: Intersection Improvements Logic Part 4 ... 133
C.15: Secondary Road Improvements Logic Part 1... 134
C.16: Secondary Road Improvements Logic Part 2... 135
C.17: Primary and Interstate Improvements Logic Part 1 ... 136
C.18: Primary and Interstate Improvements Logic Part 2 ... 137
C.19: Primary and Interstate Improvements Logic Part 3 ... 138
C.20: Primary and Interstate Improvements Logic Part 4 ... 139
D.1: Case Study Data Sheet for 20.106B... 140
D.2: Case Study Data Sheet for 20.109B... 141
D.3: Case Study Data Sheet for 20.2001 ... 142
D.4: Case Study Data Sheet for 20.2001.1 ... 143
D.5: Case Study Data Sheet for 04.149B... 144
D.6: Case Study Data Sheet for 42.471A ... 145
D.7: Case Study Data Sheet for 29.106B... 147
D.8: Case Study Data Sheet for 26.100B... 149
D.9: Case Study Data Sheet for 30.779 ... 151
D.10: Case Study Data Sheet for 26.994.1 ... 152
D.11: Case Study Data Sheet for 26.994 ... 153
D.12: Case Study Data Sheet for 21.102B... 154
D.13: Case Study Data Sheet for 27.100C... 155
D.15: Case Study Data Sheet for 13.107B... 157
D.16: Case Study Data Sheet for 13.113C... 158
D.17: Case Study Data Sheet for 14.127B... 159
D.18: Case Study Data Sheet for 27.101B... 160
D.19: Case Study Data Sheet for 31.123B... 161
D.20: Case Study Data Sheet for 9.100B... 162
D.21: Case Study Data Sheet for 23.135B... 163
CHAPTER 1 INTRODUCTION
Background
As documented in a research report prepared by the University of Kentucky for the Kentucky Transportation Cabinet (Hancher and Werkmeister, 2000), some states utilize manual approaches to determining contract time, whereas others utilize CPM software. At the time the report was issued, Florida and Indiana had comprehensive manual systems in place. Texas utilized a computer based system utilizing software packages Lotus 1-2-3, Flash Up, and Super Project. The report stated that the Louisiana DOT developed a computer system similar to the system which was implemented in Texas.
The report authored by Hancher and Werkmeister, describes in detail the computer system that was developed for the Kentucky Transportation Cabinet. The developed system was comprised of six project templates corresponding to the following project classifications: reconstruction limited access, reconstruction open access, new route, relocation, bridge rehabilitation, bridge replacement. A working committee was formed to establish critical path controlling activities for each project classification, activity logic relationships, and activity production estimates. There were a total of approximately 40 critical path controlling activities for each category template. A range of activity production rates were determined considering such factors as project location, soil conditions and topography,
and project complexity. The system was incorporated into sets of Microsoft Excel and Microsoft Project Templates.
Other reports and research documents have been developed for the purpose of identifying methods for determining contract time for highway construction projects. The National Cooperative Highway Research Program has examined this topic on two occasions. The first document, Synthesis of Highway Practice 79 (Transportation Research Board, 1981), was authored in October 1981 and provided basic suggestions to improve the methods being used to determine contract times. This report also suggested methods for improving contract time determination in the future. Most notably was the suggestion for developing historical data to be used in determining production rates and accounting for environmental impacts. The report also stressed the importance of uniformly enforcing contract deadlines and monitoring work progress. In the following years many changes to the highway construction industry caused a need for updated information. In 1995 the National Cooperative Highway Research Program published an updated report on this subject (Herbsman & Ellis, 1995). The second document, Synthesis of Highway Practice 215 (Herbsman & Ellis, 1995), provided updated information intended to improve the methods being used to determine contract times.
Synthesis of Highway Practice 215 (Herbsman & Ellis, 1995) was created by the Transportation Research Board to identify the methods being used by DOTs to determine contract time for highway construction projects. The report was based on a review of literature current through the early 1990’s as well as interviews with practicing project schedulers, construction contractors, and responses to a detailed questionnaire from 43 state and provincial DOTs in the United States and Canada. The report identified the
most frequently used techniques and contracting methods. It also touched on the satisfaction level of the estimators and the accuracy of the techniques being used.
The Synthesis Practice 215 report specifically noted that there has been a shift in the type of highway construction being performed and that current projects tend to have a greater impact on the traveling public. Keeping construction times short on heavily traveled roads is important to minimize economic impact and delays to public users. Estimating project durations requires knowledge of construction and an understanding of the uncertainties associated with a project. Some of the influencing factors identified by DOT practitioners in Synthesis 215 are:
Geophysical o Weather o Location o Environmental Construction Operations o Mobilization o Materials o Utility Relocation o Conflicting Operations o Traffic o Night/Weekend Work Project Characteristics o Project Type o Dominant Operations Economic/Legal o Budget o Letting Time o Permits Miscellaneous o Project Size o Operation Overlays o Project Urgency o Community Events
It is suggested that each of these factors must be taken into consideration when estimating contract time for a highway construction project.
State Departments of Transportation utilize a variety of techniques for estimating contract time. The most popular are bar charts, CPM, and spreadsheets. Some DOTs use simplified procedures for rapid determination of contract time for small or routine projects. The most basic of these procedures uses a predetermined list of controlling operations for which durations are estimated. The sum of the durations is then used as the contract time. The scheduler will then adjust the schedule based on judgment and convert the contract time to working days, calendar days, or a completion date as appropriate using some conversion factor.
DOTs are currently using variations to their contracting practices to reduce contract times. The most common practices are:
Incentive/Disincentive – the contractor is rewarded for early completion and penalized for late completion. The incentive is generally based on the road user cost.
Bidding Cost and Time A+B – Contracts are awarded based on a combination of the bid cost and the contractor’s schedule. In this case the contract time is determined by the contractors bid.
Lane Rental – The contractor must rent the lane of traffic they will be closing. The cost is included in the bid and finishing early results in higher profit for the contractor.
Flex time – The contractor is given a flexible start date.
According to Synthesis of Highway Practice 215 most practitioners interviewed expressed satisfaction with their current contract time determination procedures but indicated interest in making improvements. The synthesis survey found little evidence of objective assessment of experience with contract time estimation. New Hampshire compared 20 percent of completed projects from 1985 to 1991 with estimated contract
times. They determined that 63 percent of these projects under ran the estimated contract time.
The report concluded that although DOTs expressed satisfaction with their contract time determination procedures, they are generating durations longer than may be required for actual project construction. There is evidence that innovative contracting methods can be useful in shortening contract times. There are substantial benefits to the public and lowered financial risk if contract time can be more accurately estimated. The report suggests that the transportation agencies should pool data on construction project durations and the factors which are likely to affect the durations in order to produce new and accurate predictive models. The report indicated that a statistical data base is needed for contract time estimation and that expert systems may be developed in the future to help supplement the strong reliance on professional judgment as a factor for determining contract durations.
Research on the subject has also been conducted by the Iowa and Texas departments of transportation in an effort to develop better contract determination procedures (Hancher et Al., 1992). Both states found that there were many methods being employed to determine contract time. The most popular methods identified in the reports were chart schedules based on production rate data and judgment of senior personnel.
More recent research conducted by individual states has generally led to contract time being determined with the aid of computer software. Improvements to computer technology and the available software have made computer aided scheduling possible for most agencies and it appears that many departments of transportation are adopting
contract time determination techniques which include the use of computer scheduling software. The use of computer scheduling software has also made it possible to more easily evaluate requests for contract time extensions. Using scheduling software state departments of transportation are able to compare requests for time extensions with the original plan to help determine if a delay results in a change to the critical path of work.
Time extension claims are common throughout the highway construction industry, and often both the contractor and supervising engineers spend a considerable amount of time substantiating and analyzing claims. There are multiple techniques and approaches that can be used to analyze and review delays. Often, the contractor will submit a claim for a time extension based on one or more methods and techniques available, upon which the engineer will assess the claim. The engineer will then evaluate the claims for excusable delays, and then analyze the impact on the project completion date, using one of multiple approaches. The following are several delay analysis techniques that are currently in use throughout the construction industry.
The global impact technique is a summarization technique whereby all delays are plotted on a bar chart. The format displays the sum of all the delay durations for each individual activity (Bramble, Barry, & Callahan, Michael, 2004). This method is simplistic, and can therefore often overestimate the actual amount of delay on a project. Because many activities are executed in parallel with others, there is no way to determine concurrent delays using this method.
Another delay analysis technique currently used in the industry is the net impact technique. This is a bar chart summarization format, where all suspensions, delays and disruptions are plotted on the as-built schedule (Bramble, Barry, & Callahan, Michael,
2004). This method takes into account concurrent delays when estimating the net effect of all the delays. Time extensions are requested based on the comparison of the completion dates of as-planned vs. as-built.
The ‘as built but for’ delay analysis technique is used to analyze non-excusable delays which are entered into the as-built schedule. This modified schedule is then used to update the expected project completion date. Once completed, the as-built is compared to the as-planned CPM schedule. For the party that accepts the responsibility for the delays, the adjusted schedule would show the completion date what could have been achieved ‘but for’ the party-caused delays (Alkass, Mazerolle, & Harris, 1996). The difference in calendar or working days is then attributable to the contractor. This method does not take in consideration the possibility for changing critical paths throughout the project life cycle.
The time impact technique is another method used for analyzing delays in the construction industry. In this method delays and their effects are analyzed during the progress of construction. Each delay is then scheduled in with the activity at the stage of construction in which it falls. The delay calculated is the difference between the projected completion date and the delayed completion date for that stage. The total delay of the project is the sum of all the delays for each stage during the project. This is intended to show a ‘stop action picture’ of the project both before and after a delay (Alkass, Mazerolle, & Harris, 1996). This method does not take into consideration the possibility of concurrent delays.
The snapshot technique method is similar to the time impact technique, in that it compares the as-planed to the modified as-built schedules during the life cycle of the
project. The snapshot technique however does not merely focus on specific delays, it divides the total project duration into several time periods. These time periods, or snapshots, coincide with major project milestones (Alkass, Mazerolle, & Harris, 1996). Within the snapshot period, the relationships and durations of the as-built schedule are overlapped with the as-planned schedule. The remaining durations that follow this snapshot are still maintained in the process. The extended project completion date is compared to the original as-planned completion date before the snapshot technique was implemented. The difference in completion dates is the amount of time delay that occurred to the entire project due to the delayed activities in that specific snapshot period. Theoretically, the more snapshots used, the greater the accuracy is for evaluating the time extensions.
The final technique is the adjusted as-built CPM technique. It involves an as-built schedule that is developed using the Critical Path Method (CPM) format. Delayed activities are depicted as new activities and are linked to the specific delayed work activity within the network. The critical paths are then depicted twice; first as the as-planned schedule, the second as the as-built schedule. The difference between the two completion dates would be the time that a claimant would request compensation.
Research Objectives
The overall objective of the research described herein was to identify best practice approaches to project time duration estimates and project time extension evaluations. A CPM based methodology was to be developed and compared to the current method being
used within the South Carolina Department of Transportation (SCDOT). The SCDOT Research Problem Statement upon which the research was based, listed four specific research objectives as follows:
1. Identify the best practices to calculate construction time. 2. Evaluate current methods in use.
3. Recommend changes to improve SCDOT’s process for calculating construction contract time without significantly increasing cost of construction.
4. Recommend changes to improve the process for calculating construction time extensions.
The following section outlines the process which was utilized to meet these objectives.
Research Methodology
In order to meet the project objectives, the following research methodology was followed. A literature review was conducted to identify relevant material relating to highway agency practices for determining contract time and evaluating contract time extensions. With this information and input from a SCDOT Research Steering Team, a survey was developed. The survey was intended to help identify current practices being used by other states. The survey was also used to identify the effectiveness of each system and its advantages and disadvantages.
Basic critical path logic templates were developed with the help of the research steering team for 5 broad project types. The templates utilized production rate data which is currently available, and project activities which are considered to be critical. The template logic was incorporated into commercially available scheduling software and
used to evaluate projects which have already been completed. Template execution logic was compared to the original estimate and actual project completion dates. A demonstration of the software was presented to SCDOT scheduling personnel and feedback was gathered about its potential usefulness and implementation. The following paragraphs describe the research methodology in greater detail.
A meeting with the SCDOT Research Steering Team and other SCDOT personnel was held September 24, 2004 to discuss current SCDOT practices for determining construction contract time and construction contract extensions. The meeting was also used to brainstorm specific questions about how other states were determining construction contract time and construction contract time extensions. Results from this meeting were used to develop a survey which was distributed to each state. A copy of the survey can be found in Appendix A and the results are summarized in the current practices section of this report.
A meeting and work session with the SCDOT road design schedulers was held October 11, 2004 to examine the method currently being used to determine contract time. Currently SCDOT is estimating approximately 30 projects per month. The method being used is an integrated system using Microsoft Access and Excel software. Depending on the complexity of the project being scheduled it will be assigned to one of two persons. The less complex projects schedules are forwarded to an entry level estimator with a job classification of CE1. The more complex projects are given to a more experienced estimator with classification of CE2. The simple projects tend to be resurfacing and rehabilitation. The CE1 will take general information about the project and the quantities of work that need to be performed and enter them into a standardized spreadsheet. The
spreadsheet automatically detects the work items that have been designated as controlling and places them into an appropriate workbook page. The estimator then runs a Visual Basic program which queries an access database and extracts production rates for each controlling item. The estimator will then narrow the retrieved data based on the date and engineering district. The spreadsheet then retrieves an average production rate and places it into the estimating worksheet. The computer automatically determines the time required by each work item based on the quantity and production rate. The spreadsheet automatically sums the time required to perform all of the controlling items. This time is then multiplied by a concurrency factor to account for work that can be simultaneously performed. The total adjusted time is used in conjunction with a working days chart to determine a completion date for the project based on the letting month. The working days chart takes into account weather conditions which are generally encountered and allows a specific number of working days for each month. A copy of the working day conversion charts can be found in Appendix E. Generally 20-25 of the schedules prepared each month will fall into this category. More complex projects are completed in much the same way. However it is more time consuming since the scope of these projects is much broader and there are a greater number of controlling work items. The CE2 will usually be assigned ten of these projects per month.
During this meeting concerns were voiced that any changes recommended would need to be applicable without significantly raising the amount of time required to generate an estimate construction contract time. Additionally it was desired that production rates could still be automatically queried and filtered from the existing database.
A meeting with the SCDOT Research Steering Team and other SCDOT personnel was held 11 April 2005 to develop logic relationships for critical path scheduling. Five critical path templates were created based on SCDOT pay items and project types that are typically encountered. The five templates developed were for the following project categories: Bridge Replacement, Intersection Improvement, Primary and Interstate Improvements, Resurfacing, and Secondary Road Improvements. The CPM logic relationships developed at this meeting are reproduced in Appendix C.
Following the April 11, 2004 meeting the Research Steering Team provided project information from previously completed projects to use as case studies in comparing the use of scheduling software to their current method. The case studies were used to determine how close the CPM logic came to the actual project completion dates. The case studies were also used to determine the amount of manpower needed to develop construction contract time using scheduling software. Initially four case studies were entered into two software packages. The software packages used were Microsoft Project 2003 and Primavera Project Management. Results generated from both packages were the same. Eighteen additional case studies were examined using the Primavera software package. Primavera was chosen since SCDOT personnel are more familiar with it and some employees have received training on its use.
A meeting was held September 9, 2005 with members of the Research Steering Team to discuss the case study results and demonstrate how scheduling software can be used to determine contract time and evaluate requests for contract time extensions. Initially a brief PowerPoint presentation was given to outline how Primavera is used to create templates, generate schedules, and examine time extension. A demonstration of
the procedure was then given using different templates and the case study data. The five templates demonstrated were based on the five project categories; primary, secondary, bridge replacement, and intersection improvement. The presentation demonstrated how to import the templates, enter in the activity durations, and interpret the scheduled results. The demonstration also included case studies where modifications were needed, to demonstrate the ease inserting activities and modifying the logic. Such modifications included, adding activities, changing calendars, modifying logic, and filtering activities based on durations and whether they were on the critical path.
A case study was also opened to demonstrate the process for determining time extensions for delayed projects. Three scenarios were selected to demonstrate Primavera's ability to determine if a contractors request for an extension is justified. The first scenario was an activity that became critical due to a delay, which caused an extension in the project completion date. SCDOT personnel were instructed how to determine available float remaining and how to view the Gantt chart and distinguish the critical activities from the non critical activities. The second scenario consisted of an activity that was delayed, but did not cause a delay in the project completion date. This was used to determine that an extension to the overall project duration was not justified. The final scenario involved multiple activities that were delayed and how Primavera was able to calculate the new project completion date.
After completion of the demonstration a general discussion about the software's potential usefulness was conducted. There was a discussion about the bridge template being used and how it should be modified to fit the department’s needs. The bridge construction team brought some additional data for the bridge replacement templates and
one case study was modified during the meeting. The results were favorable and data was furnished for two additional case studies. User surveys were distributed to those in attendance to help identify the perceived difficulty of using the software and its potential usefulness in determining contact time and evaluating contract time extensions. The survey is reported in Appendix B and the results are summarized in the Primavera user survey results section in Chapter 4.
CHAPTER 2 CURRENT PRACTICES
Current Practices Survey
Clemson University Construction Engineering and Management graduate research assistants created a survey to address one of the objectives of the Contract Time and Contract Time Extension research project. The survey was intended to help identify current practices being used by other state departments of transportation for determining contract time as well as their methods for evaluating contract time extensions. The survey was forwarded to the SCDOT Steering Committee in January 2005 for approval and revision, and was then transmitted to individual personnel at each of the 50 state DOT’s.
The primary objective of the survey was to solicit information from state DOT’s related to their methods for determining contract time and contract time extensions. Each DOT was asked to rate the effectiveness of their system and comment about its advantages and disadvantages. They were also asked to rate aspects of other commonly used systems. Questions were asked to determine the quantity of personnel that are involved with their scheduling activities and the amount of time being spent for various types of projects. Each survey asked the respondents to rate commonly faced issues related to determining contract time and granting time extensions. In addition, each respondent was asked to identify the personnel responsible for granting time extensions, and whether they have written policies on this procedure other than what is cited in their Standard Specifications. A copy of the distributed survey appears as Appendix A.
General Findings and Survey Results
Of the fifty surveys distributed, only 10 were completed and returned. Information was gathered from the responding DOT’s describing their contract time and time extension systems and procedures. The first question of the survey was used to determine the type of system each state was using. Of the ten surveys received, seventy percent indicated they were using a manual method to determine contract time. These manual methods include worksheets and spreadsheets where the estimator would enter production rate data and estimate the contract completion date. The states using scheduling software were Wyoming, Oregon, and Maryland. Wyoming uses Primavera’s Suretrak software. Oregon uses a specially developed system called AMS which is integrated with other state and DOT systems. Maryland uses a specially developed excel program with functionality that is different than a standard spreadsheet. The following paragraphs summarize the survey responses and give a general overview of the methods being used by responding agencies.
The second question of the survey was used to evaluate general perceptions about using manual methods, scheduling software, and integrated computer systems. This question consisted of twenty six statements which were to be rated from 1 to 5 where 1 indicated strong disagreement, 3 indicated no opinion, and 5 indicated strong agreement. The questions and their average response are shown in Table 2.1. It can be seen that respondents agreed that manual methods were easily adaptable, and easy to learn, but that they felt these methods rely heavily on the judgment of the estimator. There was a neutral response concerning the time and resources required to use these methods, and the probability of human error. The questions relating to scheduling
Table 2.1: Current Practices Survey Results for Question 2 Current Practices Survey Question 2:
Please rate the advantages and disadvantages of each system listed below.
Question Avg
2.01
Manual methods are easily adaptable to different types and sizes of
projects 4.11 2.02 Manual methods are easy to learn and understand 3.78 2.03 Limited resources are needed to implement manual methods 3.44 2.04 Manual methods require long periods of time to complete 2.78 2.05 Manual methods have a high probability of human error 2.78 2.06 Manual methods rely heavily on the judgment of the estimator 4.11 2.07 Manual methods can be easily changed to meet changing needs 3.56 2.08 Scheduling software is easy to use 3.25 2.09 Scheduling software allows multiple users to easily adjust the schedule 3.25 2.10 Scheduling software is easily implemented 2.75 2.11 Scheduling software is accurate 2.88 2.12 Scheduling software helps ensure nothing is left out of the estimate 2.63
2.13
Scheduling software is easy to integrate with other systems such as
databases 3.00
2.14
Scheduling software requires considerable training before it can be
efficiently used 3.63
2.15 Scheduling software requires less man-hours than manual methods 3.00
2.16
Scheduling software is difficult to adapt to different types and sizes of
projects 2.13
2.17
scheduling software can be modified to meet the changing needs of the
user 3.00 2.18 Integrated computer systems are easy to use 2.71
2.19
Integrated computer systems are easily adapted to different types and
sizes of projects 2.86
2.20
Integrated computer systems are easily accessed and used by multiple
users 3.00
2.21
Integrated computer systems require less manpower to generate
schedules than manual methods 2.86
2.22
Integrated computer systems require less manpower to generate
schedules than scheduling software 2.71 2.23 Integrated computer systems are difficult to develop 3.29 2.24 Integrated computer systems require special training to use efficiently 3.29 2.25 Integrated computer systems are accurate 2.43
2.26
Integrated computer systems can be modified to meet the changing
needs of the users 2.86
software solicited responses that were primarily neutral. However, it was indicated that scheduling software was not difficult to adapt to different types and sizes of projects. The survey did show a perception from the states which do not use scheduling software
that it takes considerable training before it can be efficiently used. The average rating for question 2.14 from states using manual methods was 4.00. States that do use scheduling software had a neutral response and did not indicate considerable training was required. All survey responses were neutral concerning the use of integrated computer systems.
The third survey question was intended to determine how each state rated the system they are currently using. This question was broken into five parts which were to be rated from 1 to 5 where 1 indicated not effective, 3 indicated no opinion, and 5 indicated very effective. The questions and average responses can be seen in Table 2.2. It can be seen that respondents felt their system was effective in generating accurate contract times which are being achieved on most projects. The responses also indicated that both manual methods and scheduling software methods were easily applied to multiple sizes and types of projects and that respondents felt that they were effective in accounting for work items which are performed concurrently. There was a neutral response pertaining to the difficulty of learning either type of system.
Table 2.2: Current Practices Survey Results for Question 3 Current Practices Survey Question 3:
Please rate the effectiveness of the system you are using in the following areas
Question Avg
3.01 The system is easy to learn 3.50
3.02
The system generates contract times which are being achieved on
most projects 4.00
3.03 The system is easily applied to multiple types and sizes of projects 4.60
3.04
The production rates used are effective in generating accurate
contract time 3.90
3.05
The system accounts for work items which will be performed
The fourth survey question asked survey respondents if their system was utilizing work activity production rate estimates. Work activity production rates are numeric values which describe the rate at which work can be performed and are used to estimate the time required to complete work tasks based on estimated quantities of work. Ninety percent of responses mentioned that they utilize work activity production rate estimates. Four agencies indicated that their production rates are listed in a production rate table with low and high ranges. Seven agencies indicated their mean or high/low values were obtained from historical data. Only two respondents reported using contractor input to help determine production rates.
Question five was asked to determine the number of hours and manpower requirements for generating schedules for various types of projects. Eight survey responses included the number of people being used to generate contract time while only five listed the number of hours required. Six of eight responses indicated that one person is used to generate contract time regardless of the type. One response stated two people are used to generate all contract times and one response stated three or four people are used depending on the project type. There was a wide variation in time required to generate contract time for each category. The category types and response range can be seen in Table 2.3 and a graphical representation of the data can be seen in Figure 2.1. The large standard deviation for large primary and large bridge are primarily caused by survey respondent 4 who indicated more time to estimate these types of projects. Survey respondent 1 and survey respondent 5 also contributed to the wide range since they indicated less time was needed for each project type. It is possible that survey
respondents interpreted this question differently and included or excluded steps used in their entire process for determining contract time.
Table 2.3: Current Practices Survey Results for Question 5 Current Practices Survey Question 5:
Please indicate the time in a range of hours that is required to generate a schedule using your current system for the following
project types
Question Project Type Range (hours) Average
Standard Deviation 5.01 Large Primary 2 - 40 14.20 14.70 5.02 Small Primary 1 - 16 6.40 5.94 5.03 Secondary .5 - 8 4.73 3.38 5.04 Rehabilitation 1 - 8 3.80 3.01 5.05 Large Bridge 5 - 24 8.60 8.98 5.06 Small Bridge .75 - 3 2.65 2.04
Figure 2.1: Time Requirement by Project Type
Time Requirement by Project Type
0 5 10 15 20 25 30 35 40 45 Larg e P rima ry Sm all P rimary Seco ndar y Reha bilit atio n Larg e B ridge Sma ll Br idge Project Type Hour s Survey 1 Survey 2 Survey 3 Survey 4 Survey 5
Question six asked if production rates were used only for what is judged to be schedule controlling work items. Eight of survey respondents indicated that that this was the case. The two responses which did not indicate using production rates were both using scheduling software.
Question seven was intended to identify if production rate data was being stored in data files by project category. Only one response indicated production rates were being stored in this manner. Other respondents indicated the use of production rate tables and databases containing all production rate data.
Question eight was used to determine how each state determines their production rate values. All responding agencies indicated that their production rates were based on historical data. State agencies were also adjusting their production rate estimates on engineering judgment, contractor input, and Industry data. The percentage of respondents using each of these sources can be seen in Table 2.4.
Table 2.4: Methods Used for Determining Production Rate Values Production Rate Basis DOT Survey Practice Numbers
Historical Data 10
Engineering Judgment 8
Contractor Input 5
Manufacture/Industry 1
Question nine asked respondents if production rates extracted from historical data should be based on the number of previously completed projects. One survey indicated that a greater number of projects improve the credibility of the data. Another response indicated that it was taken into consideration but not based upon it. Responses from all surveys were split with five stating it should and five stating it should not.
The next question asked survey respondents if a concurrency factor was being applied to the estimated number of working days. A concurrency factor is a number between 1 and 0 which is used to lower the total number of working days for a project. The concurrency factor is intended to account for activities which may be happening simultaneously. Two surveys indicated that this method was being used while seven indicated they were not. Both states using this method were employing manual methods to determine contract time. One response indicated the concurrency factor was adequate and the other had no strong feelings about its adequacy.
The survey also asked respondents if there was a process for converting estimated time into “contract working days.” Responses were split with 5 indicating yes and 5 indicating no. Several methods were being used for this conversion including weather charts, set number of working days per month, and set number of working days per year. This question asked if a detailed analysis was used which takes into account weather, holidays, and the time of year. The following Table 2.5 shows the percentage of respondents which use more detailed analysis for each of these factors.
Table 2.5: Percentage of DOT’s Using Detailed Analysis Current Practices Survey Question 11:
Is There a More Detailed Analysis that Takes into consideration
Question Number of DOT’s Using a More Detailed Analysis 11.01 Anticipated Weather 6 11.02 Holidays 5 11.03 Time of Year 7
The last question related to contract time determination was used to determine what circumstances would alter the standard approach agencies use for determining
contract time. This question was broken into five parts which were to be rated from 1 to 5 where 1 indicated barely alter, 3 indicated neutral, and 5 indicated strongly alter. Table 2.6 shows the average survey response for this question. Incentive contracts with tight schedules, complex coordination involving utilities, unusual traffic conditions, and time of day restrictions were listed as events that would strongly alter the standard approach. Concurrent projects were not indicated as something which would alter the standard approach. It can be seen that many common problems require special consideration when determining the contract time.
Table 2.6: Circumstances that Alter Standard Approach to Determining Contract Time
Current Practices Survey Question 12:
Which of the following circumstances would alter the standard approach to determining contract time?
Question Avg
12.01 An incentive contract with a tight schedule 4.50 12.02 Concurrent Projects 3.50 12.03 Complex coordination involving utilities 4.00 12.04 Unusual traffic conditions 3.80 12.05 Time of day restrictions 4.30
For the contract time extension portion of the survey a list of potential problems was presented and the respondent was asked to rate the relative delay frequency. This question was divided into eleven sections where each were to be rated from 1 to 5, where 1 indicated a rare occurrence for time extensions, 3 indicated a neutral response, and a 5 indicated a frequent problem which required time extensions. The question and the data collected from the survey responses are listed in Table 2.7. The most frequently cited problem was identified as utility relocations, which was rated higher than other responses. The second most frequently cited problem was major unanticipated work that
affects the schedule completion. As seen in Table 2.7, industry wide labor boycotts were not commonly encountered by the responding DOT’s, therefore it had a low level of consideration for time extensions.
Table 2.7: Current Practices Survey Results for Question 1 Current Practices Survey Question 1:
Please rate the potential problems considered for time extensions based on rates of occurrence
Question Avg
1.01 3rd party delays not disclosed in contract documents 2.9 1.02 Existence of facility owned or operated by a 3rd party 2.6
1.03
Additional approvals, permits ,regulations, not attributable to a
contractors submission 2.6
1.04
Restraining orders issued by court not caused by a contractors
submission 2
1.05 Labor boycotts 1.6
1.06 Material shortages 2.8 1.07 Unusually severe storms 2.6
1.08
Determinations of the dept to open certain sections of the project before
entire completion 2.9
1.09
Major unanticipated work that affects the schedule completion in the
contract 3.3
1.10
Failure of state to provide individual rights-of-ways parcels for a period of
the time beyond that indicated in the contract 2.3 1.11 Utility relocations 3.7
In addition to the list of potential problems considered for time extensions, the survey asked if there were other commonly faced items that were not mentioned within the survey. One state indicated that design errors were commonly encountered and cause delays for many projects.
When asked if significant items of work overrun the bid quantities, seven indicated that only under conditional agreements would the overruns result in contract time extensions. The survey also asked the states to identify if time extension days are computed as some percentage of the cost of extra work. Responses were split with five saying yes and five saying no. Respondents using this approach were asked for comments. One response stated that time extensions are calculated based on the dollar
value of the additional work and as a ratio of the original contract amount to the original contract time. Another response identified the use of a negotiated number of days for time extensions based on a supplemental agreement. The supplemental agreement is for unanticipated extra work, where there are no existing pay items. Extra time is added based on the actual time required to do the extra work if it is determined to be controlling or a critical operation.
Survey responses concerning the effectiveness of liquidated damages in insuring project completion time were inconclusive. Several states gave liquidated damages a high effectiveness rating of 5, while others indicated a rating of 1. From this information, a rating of 3 was averaged. Responses indicating a high level of effectiveness did not mention their liquidated damages clause, or comment on why their measures are so effective. One response mentioned that their liquidated damages are higher than the majority of states, causing money issues for long delays. Another state mentioned that often the standard rate of liquidated damages are too low and need to be adjusted to represent road user costs.
When asked if there were any internal policies or documents not fully explained in the Standard Specifications that give guidance to engineers when determining contract time extensions, seven of respondents said that they do have internal policies. Three DOT’s reported that they have construction administration manuals that are used as a guideline to follow for determining contract time extensions.
State DOT’s were asked to rate the overall effectiveness of their system for determining contract time extensions. Several subsections to the question were rated on a
scale of 1 to 5, where 1 was considered not effective, 3 was neutral, and 5 was very effective. The questions and the state DOT’s average responses can be seen in Table 2.8.
Table 2.8: Current Practices Survey Results for Question 6 Current Practices Survey Question 6:
Overall how would you rate the effectiveness of your states system to determine contract time extensions?
Question Avg
6.01 Easy to learn? 3.6
6.02
The system generates contract extension times which are being
achieved on most projects. 3.9
6.03
The system is easily applied to multiple types and sizes of
projects. 4.1
6.04
The production rates used are effective in generating accurate
contract time 3.2
6.05
The system accounts for work items which will be performed
concurrently. 3.0
When asked to rate the overall effectiveness of each state DOT’s system to determine contract time extensions, responses were rated neutral to very effective. The highest rated aspect of the responding states system was that they are easily applied to multiple types and sized of projects. The lowest rated section of this question was that the system accounts for work items that are performed concurrently. Comments regarding this low rating include that there is often no CPM schedule to analyze the data, and that time extensions are granted based on engineering judgment.
Two of the survey responses stated that time extensions are only granted for work items on the critical path. This low percentage is based on the responding states and their method for determining contract time extensions. Eight of the states that responded to the survey do not utilize CPM scheduling software or techniques to analyze delay claims, therefore this question did not apply.
A general question was asked in the survey about possible improvements that could be made to the current methods for determining contract time extensions. There were several responses which included updating production rates, better field documentation, and requiring CPM scheduling for all contracts. One response indicated that an improvement to their system would be to require all contractors to submit and maintain a CPM schedule, and to tie contract extensions to the critical path. Two states indicated that better documentation in the field would be relative to determine when extra work was performed. They also mentioned that interim milestones should be used to document project performance and to follow the time allowed for completion.
The following are summaries of additional information gathered from specific survey responses that were determined to be relevant to the research objective. The following paragraphs briefly describe the survey response and current practices of responding states.
Specific Practices for Contract Time Determination
The Oregon DOT is using a scheduling software program that is integrated with other DOT and State Systems. It was described as a ‘specially developed computer system’ which was developed in-house, in coordination with other DOT’s. The survey response showed that they did not approve of the manual methods low accuracy or the long man hours needed to complete. They rated scheduling software higher in accuracy, and adaptability with low man hours. The system Oregon is using was listed as difficult to use, and has only moderate accuracy, although it is easy to apply to multiple projects and accounts for concurrency.
Much like SCDOT, Oregon’s system uses work activity production rates with low and high values based on historical data. They do not use contractor input in determining production rates. The personnel required to generate contract time for typical projects was one person. The time requirement for this system was not indicated.
Wyoming uses Primavera Suretrak specifically for determining their contract time. The survey indicated that their specific scheduling software was rated highly in ease of use, concurrency issues, and achievable contract times. Survey responses indicated that they believed manual methods took too long to complete, and have a large probability of human error.
Their Primavera Suretrak software system utilizes work activity production rates with low and high values which are based on historical data. They also use contractor input when determining their production rates and use it to help verify the accuracy of their historical data. For work items that have little or no historical data, they will use engineering judgment. Wyoming does not use a concurrency factor to modify the project working days due to overlapping activities. Wyoming uses one person to generate typical project schedules. All bridge, rehabilitation, secondary and small primary projects schedules required approximately 2 hours to generate, while large primary schedules took 8 hours to complete.
Maryland uses an in-house MS Excel program as their main software system to determine contract time. Survey responses did not rate their opinions on the other methods for determining contract time. Ratings for scheduling software were high, including its level of accuracy, ease of use, and ability for modification. They rated their In-house Excel program high in its ease of use, and applications, but “not effective” for
overall accurate results. Their Excel software does use work activity production rates, but the software does not include low and high values of production. They also do not use contractor input to determine production rates. Typically engineering judgment is used when listing the production rates for work items. Their production rates are stored in a data file by project category as shown in Table 2.9.
Table 2.9: Maryland’s Project Categories and Quantity of Work Items
Category # of Work Items Preliminary 4 Grading 7 Drainage 23 Structures 34 Paving 23 Shoulders 25 Landscaping 12 Utilities 34
The Maryland DOT uses one person to generate contract times. The range of hours required to generate a schedule for many typical project types seemed much greater than other state survey responses. For example, a large primary project would take approximately 40 hours to complete, while the next highest response was 12 hours. It appears that Maryland’s in-house software requires more time to generate schedules than other scheduling methods.
Currently Arkansas uses a manual method to determine contract times for the majority of their projects. It is assumed this is accomplished in either a spreadsheet or worksheet format, which was not specified. They rated the manual method as having multiple advantages compared to the other more advanced techniques. The survey response showed that their manual method does not take much time to learn, is easily
adaptable, has low amounts of human error, and does not take extended amounts of time to produce results. This was the highest rated manual method received from all the survey responses. Their manual method does use historical data with mean/low/high values of production rates for determining contract time, and they do not utilize contractor input.
According to Arkansas, the range of hours typically required to generate schedules using the manual method were quite low. For example, a large primary project would take approximately 2-4 hours to complete using one person, and a small bridge project would take approximately 45 minutes using one person. Contract time is established quickly and consistently by using the previously completed projects upon which work items are based. One comment in the Arkansas survey mentioned that the initial production rate research is very time consuming, but after being implemented several times, the man hours needed to generate a schedule are reduced. They also indicated a problem related to utilizing historical rates is that contractors are continually improving their work force efficiency, forcing constant historical production rate data readjustments.
Currently Georgia uses a manual method to determine contract times for the majority of their projects. This is done in either a spreadsheet or worksheet format, which was not specified. They rated the manual method as easy to learn and adapt to different projects, but indicated a high level of human error. The manual method relies greatly on the judgment of the estimator and requires experienced personnel. Their system utilizes work activity production rate estimates based on historical data with ‘low’ and ‘high’ ranges which are similar to SCDOT’s production rate data. Instead of using a
concurrency factor, Georgia uses engineering judgment, to account for the complexity and scope of different projects.
Currently Iowa uses a manual method to determine contract times for the majority of their projects. This is accomplished in either a spreadsheet or worksheet format, which was not specified. They rate their system as accurate and easily applicable to multiple types of projects. Iowa’s DOT uses historical data, engineering judgment, and contractor input to determine production rate values. There is one person assigned to work on generating schedules using the manual method, but they did not mention the time requirement for generating a schedule, or how this varies depending on project type.
Specific Practices for Contract Time Extensions
The Oregon survey showed a low indication of problems considered for contract time extensions. The only problems that were rated medium potential included right-of-way troubles, and utility relocations. Oregon does not compute time extensions as a percentage of the cost of the extra work, and their survey response indicated that liquidated damages do not provide an effective impact to insure projects are completed on time. There are written policies which are not included in the Oregon Standard Specifications that help give guidance to engineers for determining time extensions, but those publications were not listed.
The Wyoming survey identified several problems that had a high potential of occurrence for contact time extensions. These included third party delays, weather, material shortages, right-of-way delays, and utility relocations. Wyoming will grant contract time extensions due to overruns, depending on the original pursuit of work.
Their survey indicated they believe liquidated damages do help insure project completion times.
Wyoming’s Construction Administration Manual provided guidance to engineers that was not listed in the Standard Specifications when defining the process of granting time extensions and change orders. Their DOT only granted time extensions for items that were on the critical path, but Wyoming made exceptions for instances where the delayed item was newly critical based on a readjusted CPM schedule.
Survey responses from the Maryland DOT indicated that problems including third party delays, third party owned facilities, severe weather, and utility relocations were all considered as having a very high potential for occurring and requiring contract time extensions. Significant items of work were only given a contract time extension under the condition that the work item has overrun the bid quantities by a specified percentage. The Maryland survey expressed dissatisfaction with the effectiveness of liquidated damages in insuring completion time.
Maryland indicated no internal written policies other than the Standard Specifications that explained the methods for determining contract time extensions. Their method was rated overall as neutral, meaning there was no outstanding dissatisfaction with their process.
Survey responses from Arkansas indicated that the main problems with high potential for requiring contract time extension included an industry wide material shortage, the department deciding to open certain sections of the project before completion, and utility relocations. The Standard Specifications for Arkansas list the occurrences that result in a possible contract time extension. Time extension
determinations are typically handled by the construction field engineer. Often, additional work is authorized by change orders in the field. Additional contract time is frequently included in these agreements. The only internal written policies not listed in the Standard Specifications that give guidance to engineers when determining contract time extensions are for fixed day contracts. Field engineers use a ‘historical average number of working days per month’ document, similar to the SCDOT working days conversion chart shown in Appendix E.
Survey responses from Georgia indicated that the main problems with high potential for requiring contract time extension included third party owned facilities, major unanticipated work, and utility relocations. Standard liquidated damages are rated as being too low, and on projects where liquidated damages could be modified to represent road user costs, survey respondents believe this approach should be taken. The survey also indicated that current methods could be improved by removing the amount of political constraints that exist.
The survey response from the Iowa DOT indicated that the main problems with high potential for requiring contract time extension included additional permits, right-of-way issues, and utility relocations. Iowa does not have any written policies other than the Standard Specifications to give guidance to engineers when determining contract extensions. They suggested improvements could be made by implementing an automated method to reduce errors associated with the time extension process.
The survey forwarded to personnel at each of the 50 state DOT’s was intended to provide information relevant to the methods being used for determining contract time and contract time extensions. A limited number of responses were received, and from these
responses, some measures of system effectiveness, disadvantages, and advantages were obtained. Respondents also provided information that involved the common problems that are encountered that are often considered for contract time extension. Additional information was disclosed about the internal written policies and procedures used when determining their contract time extensions.
CHAPTER 3 CPM SCHEDULING
Logic Development
To address the objectives of the research, described herein, it was decided that critical path scheduling should be investigated with the aid of computer software for determining contract time and examining contract time extension issues. The current method being used by SCDOT to determine contract time involved querying production rate data from a centralized database, and filtering it based on the date and engineering district where the project was to be performed. The data being retrieved in this process was for work tasks, which were considered to be critical activities. In an effort to integrate the current method and continue using the historical data, logic networks were developed for critical path scheduling using pay items from the existing database. These items were used to develop generic logic diagrams which could describe the order of work for several different types of projects that are typically encountered. Logic diagram templates were developed for the following five project categories: bridge replacement, intersection improvement, primary and interstate improvements, secondary road improvements, and resurfacing. Logic diagram templates for the five project categories, as utilized in Primavera, appear in Appendix C.
Primavera Capabilities
Primavera Project Management is a flexible scheduling software package with many capabilities. The software is easy to learn and has a user interface similar to many
other windows based programs. Primavera software is available in enterprise and stand alone versions which make it versatile for use by single or multiple users. Primavera uses Dynamic Data Exchange (DDE) and Object Linking and Embedding (OLE) to allow users to insert data, graphs, tables, and figures from other applications. It will also allow users to create project templates, which can be stored and used for future projects. The program can also be used to group and view multiple projects at the same time.
Primavera provides the ability to view the project in Gantt or PERT format. When viewing a Gantt chart, it will allow the user to roll up project activities to an appropriate level of detail, and filters can be applied to show only specific types of activities. Primavera also allows the user to customize colors and text to highlight pertinent information. Additionally the ranges and units can be adjusted to create custom views. The PERT view allows the user to focus on an activities predecessors and successors. Primavera offers a split screen view which displays the activities and adjacent activities in one window, and the entire network in the other window. Primavera supports the standard logic relationships: finish to start, start to finish, finish to finish, start to start, and is capable of showing lead and lag in these relationships.
Primavera has a number of features which allow it to track costs, schedules, and resources. The software can be used to compare the completed work to the original schedule, and can identify when resources are stretched beyond availability. Primavera is capable of applying different work calendars to activities within the same project. This helps account for activities which may have different work schedules and days off. Primavera supports the use of three types of calendars: global, project, and resource. The global calendar is applied to all projects. The project calendar is applied to the specific
project and the resource calendar applies only to a resource. The calendar feature is especially useful for converting working days into calendar days.
Primavera features the ability to manage earned value through user input of the percent complete for specific projects. The software will calculate: Budgeted Cost of Work Scheduled (BCWS), Budgeted Cost of Work Performed (BCWP), Actual Cost of Work Performed (ACWP), Schedule Variance (SV), Cost Variance (CV), Budget at Completion (BAC), Costs Performance Index (CPI), Schedule Performance Index (SPI), and Estimate at Completion (EAC). Each of these values is useful for project control and can be incorporated into standardized or customized reports.
Primavera has multiple capabilities, which are in excess to what is required by SCDOT to determine contract time. Additionally, using the software can improve estimate accuracy and can be used to develop more accurate production rates for future estimates. Collecting completed project data and entering it as a separate baseline on the estimated schedule can easily show work items which may need adjustment. Additionally, use of the Primavera Project Management software calendar feature eliminates the need to manually determine project completion dates.
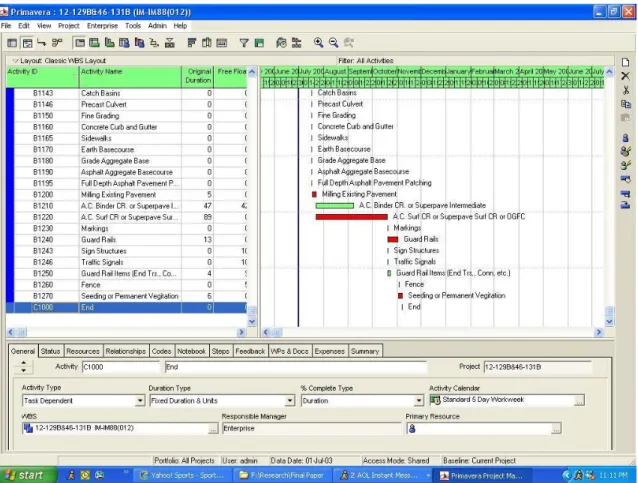
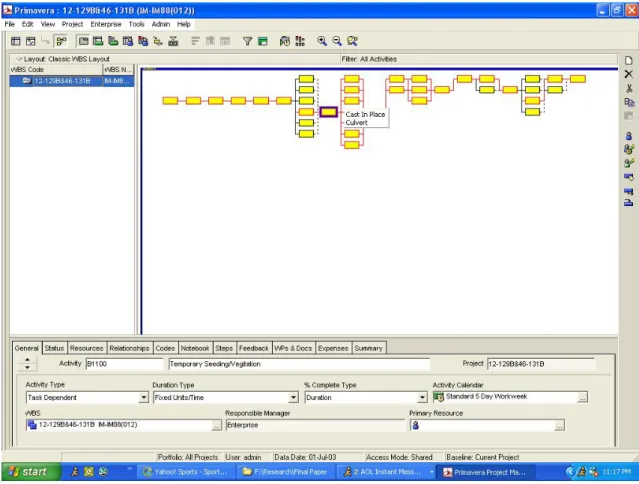
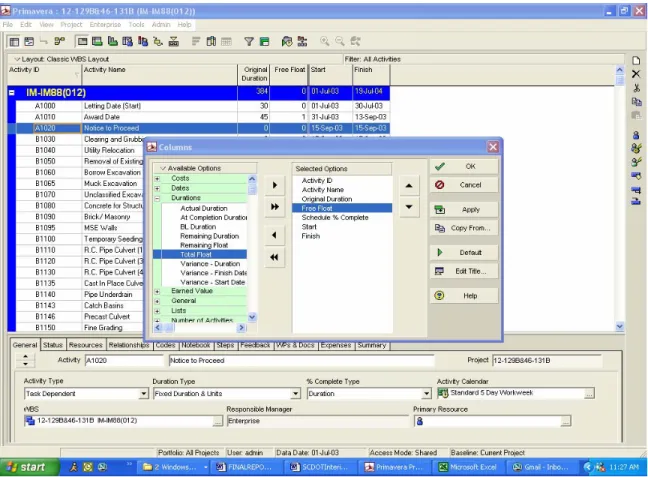
Using Primavera to Calculate Contract Time
The following paragraphs outline how Primavera can be used to determine project completion times and evaluate requests for contract time extensions. The example utilizes a case study which was examined and includes screenshot graphics most applicable to the research effort.