Does Corporate Governance Affect Firm Value?
Evidence from Korea
†BERNARD S. BLACK*
Stanford Law School
HASUNG JANG**
Korea University Business School
WOOCHAN KIM***
KDI School of Public Policy and Management First draft: May 8, 2002
This draft: February 2003
† Earlier versions of this paper were presented at the Second Asian Conference on Corporate Governance
(2002), 8th Mitsui Life Symposium on Global Financial Markets (2002), International Monetary Fund (2003), KAEA (Korea America Economic Association) annual meeting (2003), Korea Fair Trade Commission (2002), Korea Association of Industrial Organization (2002), KDI School of Public Policy and Management (2002), Korean Financial Association (2002), and [to come]. We thank Stephen Bainbridge, Harold Demsetz, John Donohue, Miyajima Hideaki, Ji-Sang Jang, Simon Johnson, E. Han Kim, Florencio Lopez-de-Silanes, Jun Qian, Hyun-Han Shin, and [to come] for comments.
*
Professor of Law, Stanford Law School, Stanford, California U.S.A. 94305. Tel: (+1) 650-725-9845, fax (+1) 650-725-0684, e-mail: bblack@stanford.edu
**
Professor of Finance, Korea University Business School, Anam-Dong, Sungbuk-Ku, Seoul, Korea 136-701. Tel: (+82-2) 3290-1929, fa x: (+82-2) 929-3405, e-mail: jangya@chollian.net
***
Professor of Finance, KDI School of Public Policy and Management, Chongyangri-Dong Dongdaemun-Ku, Seoul, Korea 130-868. Tel: (+82-2) 3299-1030, fax: (+82-2) 968-5072, e-mail: wc_kim@kdischool.ac.kr
Abstract
We report evidence that corporate governance is an important factor in explaining the market value of Korean public companies. We construct a corporate governance index (0~100) for 526 companies based primarily on responses to a Spring 2001 survey of all listed companies by the Korea Stock Exchange. The index is based on six subindices for shareholder rights, board of directors in general, outside directors, audit committee and internal auditor, disclosure to investors, and ownership parity. A moderate 10 point increase in the corporate governance index predicts a 5% increase in Tobin’s q and a 14% increase in market/book ratioin ordinary least squares (OLS) regressions. A worst-to-best change in the index predicts a 38% increase in Tobin's q and a 105% increase in market/book ratio. This effect is statistically strong and robust to choice of performance variable (Tobin's q, market/book, and market/sales) and to specification of the corporate governance index. Each subindex is an individually significant or marginally significant predictor of higher Tobin's q (and other performance variables).
Unique features of Korea's corporate governance rules allow us to use an instrumental variables approach to address two alternate explanations for these results: signaling (firms signal high quality by adopting good governance rules) and endogeneity (firms with high Tobin’s q choose good governance rules). Some important Korean governance rules apply only to firms with assets over 2 trillion Korean won. If the portion of the corporate governance index that is due to these rules predicts higher Tobin’s
q (or other measures of firm value), this cannot be due to signaling or endogeneity. We use both a two-stage (2SLS) and a three-stage (3SLS) least squares approach, using as an instrument a dummy variable for assets over 2 trillion won, with a separate control for ln(assets). The 2SLS and 3SLS coefficients are larger than the OLS coefficients and are highly significant. This is consistent with causation running from the exogenous component of governance rules to higher Tobin’s q (and other performance variables).
Key words: Korea, corporate governance, firm valuation JEL classification: G300
I. Introduction
How do a country’s corporate governance rules, or the corporate governance practices of individual firms within a country, affect overall firm value and performance? A well-known line of research that begins with a series of papers by La Porta, Lopez-de-Silanes, Shleifer and Vishny provides evidence that countries with stronger legal protections of minority shareholders have larger securities markets, less concentrated share ownership, and a higher value for minority shares.1
A separate question is whether variation within a single country in the corporate governance practices of individual firms predicts these firms' market values. This question is central when individual firms – which can change their own practices, but not their country’s rules – must decide whether and how to change their corporate governance practices. To what extent can a firm improve its market value by upgrading its corporate governance practices? Conversely, to what extent is it tied to its home country’s overall reputation?
This second question is cent ral to the usefulness to investors of the new private sector corporate governance rankings. In 2001, Credit Lyonnais Securities Asia (CLSA) published a corporate governance ranking of 495 companies in 25 emerging markets (CLSA, 2001; Gill, 2002). Also in 2001, Standard & Poor’s published a “corporate governance” ranking (based only on disclosure), covering 859 companies in 27 countries (Standard & Poor’s, 2001). In 2000, Deminor published a governance ranking of the 300 European companies in the FTSE-300 index (Deminor, 2000; Coppieters, 2001). Institutional Shareholder Services launched in 2002 a governance ranking for the 3000 U.S. companies in the Russell 3000 index (McGurn, 2002).
If within-country, across- firm governance practices correlate with firm market value, a third question arises: Do good corporate governance practices cause investors to value firms more highly? An alternate explanation is that firms adopt good governance rules to signal that the firm’s insiders intend to behave well; but the signal, not the firm’s practices, affects firm value. A second alternate explanation involves endogeneity – firms with high market values adopt good governance practices, rather than vice versa.
This paper is one of several contemporaneous papers that explore how within-country variation in governance practices affect firm value, primarily in emerging markets. For related research, see Black, 2001 (Russian firms); Durnev and Kim, 2002 (using CLSA and
1 La Porta et al. (1997, 1998, 1999, 2000, 2002). For selected criticisms of this approach, see Coffee
Standard & Poor’s rankings); Klapper and Love, 2002 (using CLSA rankings); Gompers, Ishii and Metrick, 2003 (studying United States firms). Our paper differs from this related research in several ways.
First, we study a full cross-section of all listed Korean firms, both large and small. The other papers on emerging markets either use a small single-country sample (Black) or multicountry samples that contain only the largest firms in each country (Durnev and Kim; Klapper and Love).
Second, our focus on a single important emerging market also allows us to use a more complete set of control variables than are available in a multicountry study.
Third, we use a broad corporate governance index that is based on responses to objective questions. In contrast, the S&P rankings are based only on disclosure; the CLSA rankings are based in significant part on the subjective views of analysts, whose opinions could be influenced by their knowledge of firm performance; and the Gompers et. al rankings are based primarily on takeover defenses. However, disclosure quality correlates strongly with other aspects of corporate governance (see this paper and Black (2001)). Thus, the correlation between firm value and a disclosure ranking such as S&P could largely reflect the effect of omitted corporate governance variables.
Fourth, Korea's corporate governance rules uniquely let us use an instrumental variables approach to address signalling and endogeneity explanations. Some important rules apply only to firms that have assets of at least 2 trillion won (roughly US$2 billion). Below, we refer to these firms as "large" and firms with assets less than 2 trillion won as "small." The variation in exogenously imposed legal rules lets us construct an instrument (an asset size dummy at 2 trillion won) for our corporate governance index, using a separate control variable (ln(assets)) to control for firm size. The asset size dummy variable correlates with our corporate governance index (r = 0.57) and should be a respectable instrument as long as
ln(assets) captures most of the variation in Tobin's q based on firm size. Other studies of within-country, across- firm variation in corporate governance lack plausible instruments. Our results are similar in OLS, 2SLS, and 3SLS specifications, with larger coefficients in the simultaneous equations results. These results strengthen our confidence in the OLS results, are consistent with causation running from good governance to higher firm value, and do not support either the signaling hypothesis or the hypothesis that more highly valued firms adopt better governance rules.
Our corporate governance data is taken from a detailed survey of all companies listed on the Korea Stock Exchange (KSE), conducted by the KSE in Spring 2001. The KSE’s sponsorship of the survey ensures a high response rate (540 of 560 surveyed companies), and
enhances the credibility of the responses, because the KSE has regulatory authority over listed companies. We use the survey responses to construct a corporate governance index (0~100). The index is composed of six subindices, for shareholder rights (subindex A), board of directors in general (subindex B), outside directors (subindex C), audit committee and internal auditor (subindex D), disclosure to investors (subindex E) , and ownership parity (subindex P). Ownership parity is a measure of the lack of a pyramidal or circular ownership structure (Joh, 2003, uses a similar corporate governance measure). The subindices are based on a total of 39 separate elements (38 survey questions plus the ownership parity measure).2
Our results are statistically strong and economically important. Our OLS results imply that a moderate 10-point increase in the corporate governance index, predicts an increase in Tobin’s q of 5% percent of the company’s book asset value or 14% of the company’s book value of common stock. A worst-to-best improvement in corporate governance predicts a 38% increase in Tobin's q and a 105% increase in market/book ratio. Our 2SLS and 3SLS
results predict effects that are roughly three times larger: Turning from the overall index to the subindices, each of the six subindices separately predicts higher firm value. However, much of this effect is because the subindices are positively correlated with each other. The subindices that remain significant in regressions including the remainder of the index are disclosure to investors and ownership parity.
In addition to addressing the general question of whether improved governance can pay off in greater firm value, our results are important for the debate within Korea on the need for corporate governance reforms. Prior to the 1997-1998 financial crisis, Korean corporate governance practices were weak by international standards. Self -dealing by controlling shareholders was common, firms had few outside directors, and audit committees were almost nonexistent. Since the financial crisis, the Korean government has aggressive ly changed its governance rules. A minimum number of outside directors became mandatory (25% for all public companies, 50% for banks and large companies). Audit and nomination committees were introduced and made mandatory for banks and large companies. Chaebol-affiliated firms must disclose consolidated financial statements and obtain board-of-directors approval for self-dealing transactions. The number of shares a shareholder must hold to file a derivative suit or inspect a company’s financial records has been sharply reduced. Accounting rules have been strengthened. The list goes on. However, Korea’s economy has been strong for several years. Chaebol managers oppose further reforms and are seeking to reverse some
2
The survey contains both objective and subjective questions. In this paper, we construct and study an objective corporate governance index based on responses to the objective questions. We plan to construct and study a subjective corporate governance index in separate research.
of the post-crisis reforms. They portray corporate governance regulations as choking off their freedom and creativity, and question the link between corporate governance and firm performance. This paper offers evidence that stronger governance can pay off in higher market values.3
This paper is organized as follows. Part II reviews the literature on the relationship between corporate governance and firm value. Part III describes our data set and how we construct our corporate governance index. Parts IV and V discuss results from ordinary least squares (OLS) and simultaneous equations (two-stage (2SLS) and three-stage (3SLS) least squares) regressions, respectively. Part VI discusses various robustness checks on our results, and Part VII concludes.
II. Related Literature
A. The Effect of Country-Level Variation in Corporate Governance
There is substantial evidence that variation in country level rules predicts various measures of capital market strength, including larger securities markets relative to Gross Domestic Product (GDP), frequency of initial public offerings, less concentrated share ownership, and a higher value for minority shares (LLSV, 1997, 1998, 1999; La Porta, Lopez-de-Silanes and Shleifer, 2002). Consistent with this research, Nenova (2003) and Dyck and Zingales (2001) find evidence of systematic variation across countries in the value of control rights. Modigliani and Perotti (2000) find that a large premium on high- voting shares (suggesting weak protection of minority investors) and the level of corruption both predict a smaller stock market; Levine (1998, 1999) find that the quality of accounting disclosure predicts stock market size. Nenova (2001), in a case study of Brazil, finds evidence that change in the legal protection of minority shareholders can affect the value of control rights .
Lopez-de-Silanes, Shleifer and Vishny (2002) and Durnev and Kim (2002) find evidence that country-level variation in rules affects the market value of individual firms. Klapper and Love (2002) find, however, that this result is not robust in their study.
3 On the politics of Korean corporate governance reform, see Black, Metzger, O'Brien and Shin (2001).
B. The Effect of Within-Country, Across-Firm Variation in Corporate Governance
There is as yet much more limited evidence that variation in corporate governance practices across firms but within a single country importantly affects firm value. In developed countries, even careful studies often fail to find statistically significant effects of corporate governance on firm value or performance. When significant results are found, they are often economically small (Gompers, Ishii and Metrick, 2003, is a recent exception). However, developing countries may offer more fertile ground for study. Black (2001), argues that larger effects are likely to be found in developing countries, because these countries often have weaker rules and larger variations between firms in corporate governance practices; Durnev and Kim (2002) report supporting evidence.
Most of the empirical literature studying the link between corporate governance and firm performance concentrates on particular aspects of governance, such as board composition, shareholder activism, executive compensation, antitakeover provisions, or particular investor protections. To name a few, Millstein and MacAvoy (1998) and Bhagat and Black (2002) investigate the relationship between board characteristics and firm performance. Karpoff, Malatesta, and Walking (1996) and Carleton, Nelson, and Weisbach (1998) link firm performance with shareholder activism. Bhagat, Carey, and Elson (1999) look at the relationship between outside director pay and firm performance. Sundaramurthy, Mahoney, and Mahoney (1997) link firm performance with antitakeover provisions. Gompers, Ishii and Metrick (2003) link firm performance to a corporate governance index based largely on takeover defenses.
In emerging markets, Black (2001) reports a powerful correlation between the market value and corporate governance of Russian firms. A worst-to-best improvement in governance predicts a 700-fold (70,000%) increase in the market value of a Russian firm as a percentage of theoretical Western market value. However, his sample is small (21 firms), and he does not control for endogeneity. Durnev and Kim (2002) find that higher scores on both the CLSA corporate governance index and the S&P disclosure and transparency index predict higher firm value for a sample of 859 large firms in 27 countries, Klapper and Love (2002) find similar results for the CLSA index for a sample of 495 large firms in 25 countries. We discuss in the Introduction the principal differences between our paper and this related research.
A related body of research studies the effect of decisions by firms in emerging markets to cross- list their shares on major world exchanges. Cross- listing generally predicts an increase in share price. An important driver of this increase appears to be compliance by cross-listed
companies with stricter disclosure and other corporate governance rules (e.g., Lang, Lins and Miller, 2003; Doidge, Karolyi and Stulz, 2002; Coffee, 2002).
III. Data and Construction of Corporate Governance Index
A. Data Sources
We construct a corporate governance index based primarily on a 2001 survey by the Korea Stock Exchange (KSE). The KSE sent an extensive survey of corporate governance practices and attitudes to the disclosure officers of all listed companies. The survey was completed between March and July 2001. The response rate was very high: 540 out of the 560 surveyed companies responded. We exclude 5 banks that were wholly owned by the government, leaving a sample of 535 firms.4
We take balance sheet and income statement data from the TS2000 database, maintained by the Korea Listed Companies Association. We take stock market and share ownership data from a KSE database. Share ownership data is available for 526 companies. We take the list of top-30 chaebol companies from press releases by the Korean Fair Trade Commission.
Table 3, Panels B and C show summary statistics and a correlation matrix for selected variables used in this paper.
B. Construction of the Corporate Governance Index
We extract 123 variables from the survey questions. We exclude questions that are subjective (they ask for management's opinions and future plans); lack clear relevance to corporate governance; are ambiguous as to which answer indicates better governance; had minimal variation between firms; overlap highly with another variable; or had very few responses.5 This leaves us with a usable set of 38 elements for our corporate governance index.
We classify these variables into five subindices: (i) shareholder right s (subindex A); (ii) board of directors in general (subindex B); (iii) outside directors (subindex C); (iv) audit committee and internal auditor (subindex D); and (v) disclosure to investors (subindex E). We
4
At the time of the survey, the KSE had 699 listed companies. It did not survey 139 companies that were on a watch list for possible delisting. Consistent with our agreement with the KSE, we do not discuss individual companies in this paper.
5 An English translation of the survey and an explanation of our reasons for excluding variables are
add a sixth one-element subindex for "ownership parity", which measures the extent to which the largest shareholder uses a pyramidal or cross-holding structure to control more votes than the shareholder directly owns (subindex P). These structures increase the incentives and ability of controlling shareholders to engage in self-dealing (Bebchuk, Kraakman, and Triantis, 2000). Ownership parity is defined as 1 - ownership disparity, with ownership disparity defined as ownership by all affiliated shareholders - ownership by the largest shareholder.6
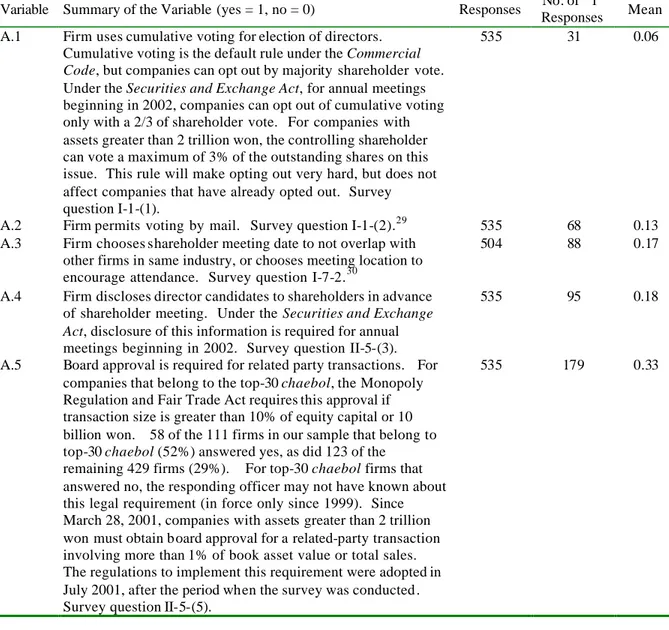
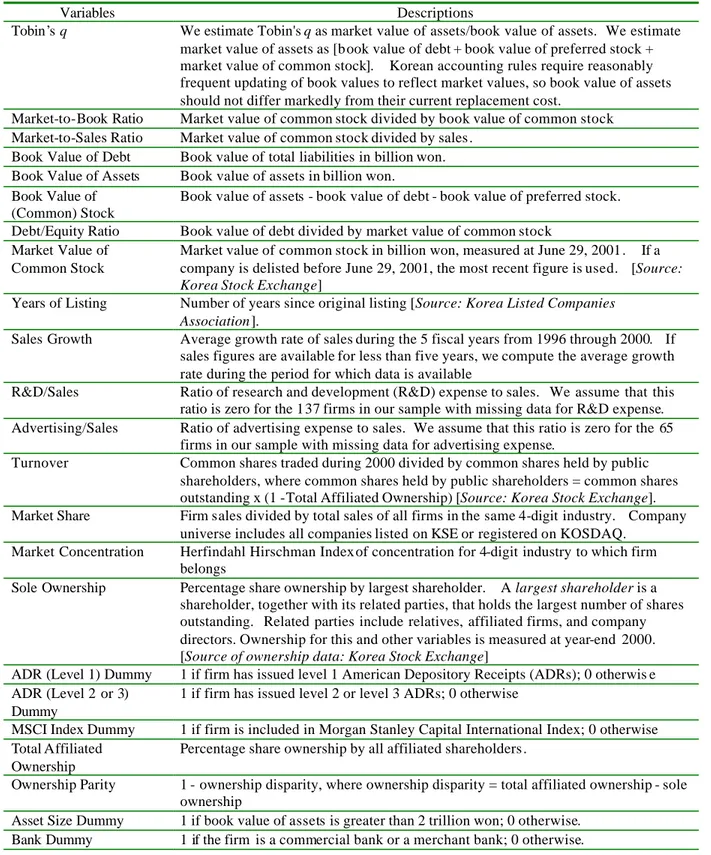
Table 1 describes the variables used in constructing each sub index and provides summary statistics for these variables.
We combine the subindices into an overall corporate governance index as follows. We standardize each subindex to have a value between 0 and 20. Our principal overall corporate governance index (CG1) is constructed as follows:
(
B C)
D E PA
CG1= + + 2+ + + ---(1)
Here, we combine the related B and C subindices into a single board of directors subindex. Thus, the overall corporate governance index has a value between 0 and 100, with better-governed firms having higher scores.
Each element in each subindex is constructed to have a value between 0 and 1. To obtain a subindex, we compute a simple sum over the elements of the subindex and divide by the number of ‘non- missing’ elements.7 We multiply this ratio by 20 so that the subindex takes a value between 0 and 20.
C. Description of the Index
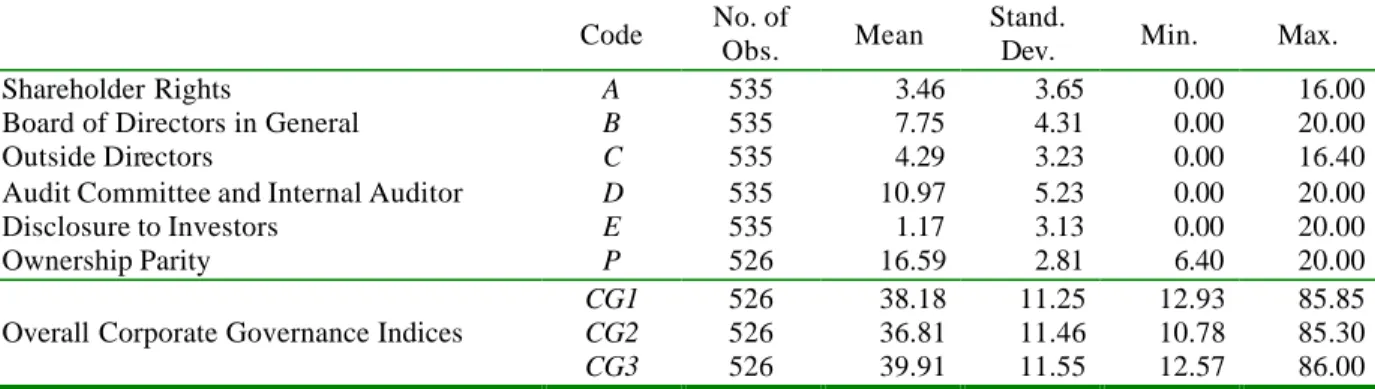
Figure 1 shows a histogram of the overall corporate governance index CG1. A normal distribution curve is superimposed. The distribution of corporate governance index is slightly skewed to the right (long tail to the right).8 Table 3, Panel A provides summary statistics for
6
We use the definition of largest shareholder in the Securities and Exchange Act. According to the Act, the largest shareholder is the shareholder, together with its related parties, that holds the largest number of shares outstanding. Related parties include relatives, affiliated firms, and company directors. Using this definition, the largest shareholder can be either an individual or a firm.
7
Since we compute a ratio based only on nonmissing values , we do not have to worry directly about missing values. However, because mean scores differ across elements, , a firm could score higher or lower under our approach than under an alternate approach where we first normalized the responses to each element and then used the normalized responses to compute the subindices.
the overall CG1 index and each subindex. The index mean (median) is 38.35 (37.72); the minimum is 12.93, and the maximum is 85.85. Table 3, Panel D provides a correlation matrix for CG1 and each subindex.
D. Comparison with Other Corporate Governance Indices
The CLSA corporate governance index (relied on by Durnev and Kim, 2002, and Klapper and Love, 2002) includes 19 firms that are also in our sample. The S&P disclosure index (relied on by Durnev and Kim, 2002) includes 33 overlapping firms. This overlap lets us examine the correlation between our index and these other indices. Table 3, Panel A provides simple statistics on these indices [discussion to come]. Table 3, Panel D shows the correlation between our index and these alternate indices. The correlation is surprising modest, especially for the S&P index. The correlation between CG1 and the CLSA index is 0.32; the correlation between CG1 and the S&P index is only 0.06. Surprisingly, the correlation between the S&P disclosure index and our disclosure subindex (subindex E) is only 0.02. Because of small sample size, we cannot say much about the power of the CLSA and S&P
indices for our sample, although we conduct some crude checks in Part IV.D below.
IV. Corporate Governance and Firm Value : OLS Results
This part presents our OLS results. In all regressions, we identify outliers and drop them from the sample. We treat observations as outliers if a studentized residual obtained by regressing Tobin’s q on CG1 and intercept (without other control variables) is greater than 1.96 or smaller than –1.96.9 This method identifies 29 outliers. Elimination of outliers plus data availability for the control variables described in Section B reduces the number of firms in our regressions from 526 to 489.
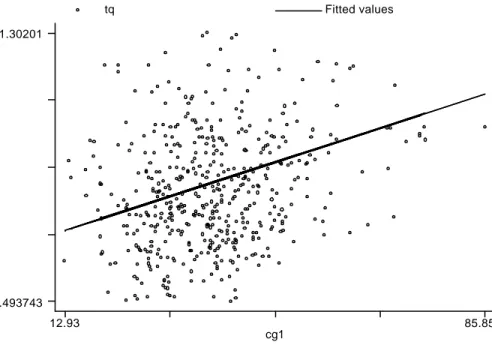
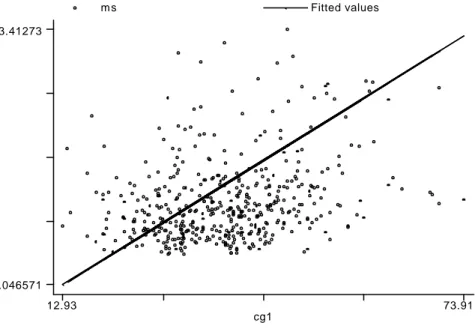
A. Whole Sample Scatter Plots
Figures 2, 3, and 4 show scatter plots for ordinary least squares regressions of our corporate governance index, CG1, against three measures of firm performance: Tobin's q (market value
9
A studentized residual of observation i is a residual obtained from a fitted regression line estimated without observation i divided by the standard deviation of residuals computed without observation i. In the robustness checks in Part VI, we follow the same procedure to identify and exclude outliers for other performance variables (market/book and market/sales).
of assets/book value of assets), market/book (market value of common stock/book value of common stock) and market/sales (market value of assets/sales). In each figure, there is a visually obvious correlation. We confirm below that these correlations survive, essentially unchanged, when we add a battery of control variables and perform various robustness checks.
B. Whole Sample OLS Results and Control Variables
An important strength of an in-depth study of corporate governance in a single country, compared to a multi-country study, is data availability that lets us develop a reasonably thorough set of control variables. This reduces the likelihood that omission of rele vant variables will produce a spurious correlation between corporate governance index and firm value. In Table 4, Panel A, regression (1), we regress Tobin's q against corporate governance index, CG1.. We then progressively add an extensive set of control variables , showing selected results with a partial set of control variables in regressions (2)-(4), and results with a full set of control variables in regression (5).
CG1 is highly significant in each of these regressions.10 Adding control variables scarcely changes the coefficient on CG1. The t-statistic remains strong in all regressions. Regression (5) implies that an increase in corporate governance index by 10 points results in an increase of market capitalization by 10 × 0.0052 = 0.052 (5.2%) of the company’s book asset value. A worst-to-best change in corporate governance, from CG1 = 12.93 to 85.85, predicts a 38% increase in Tobin's q. These are economically important differences.
Our control variables, their rationale, and results from regression (5), with a full set of control variables, are described below. In the regressions described later in this paper, we use the same set of control variables, but to simplify the tables, we often omit coefficients and t -statistics for some variables (ge nerally the insignificant variables).
• We follow the common practice of using ln(assets) to control for firm size (see, e.g., Shin and Stulz, 2000, Durnev and Kim, 2002).11 Ln(assets) is negative and highly significant. We consider the functional form for the dependence of Tobin's q on firm size with more care in Part VI.C because of its importance for our instrumental variable.
10
In this paper, we refer to results as marginally significant if they are different from zero at the 90% confidence level, significant if they are different from zero at the 5% level, and highly significant if if they are different from zero at a 99% or higher level, in each case using a two -tail test.
11 Our results are similar if we use ln(sales) instead of ln(assets) as a control for firm size. This is not
• We control for firm age using ln(years of listing) as a control variable.12 We expect a negative coefficient because more recently listed firms are likely to be faster-growing, and perhaps more intangible asset- intensive. This variable is negative and significant.
• We include a control variable for debt/equity ratio (when we use market/book as a dependent variable, we use debt/assets as a control variable). This control is positive and significant.
• We control for industry with dummy variables based on 2-digit Korea Standard Industrial Classification) (KSIC) codes to capture industry effects. We find similar full-sample results with 4-digit industries.13
• Tobin's q is positively related to a firm's growth prospects and to intangible assets. We control for these effects with control variables for sales growth over the last 5 years, R&D expense/sales, and advertising expense/sales. Sales growth is not significant. R&D/sales and advertising/sales positive and significant, though less so if we use 4-digit industry controls. However, only advertising/sales remains significant in our
2SLS and 3SLS regressions.
• The firm's market share within its industry, as well as overall industry concentration, may affect profitability. We therefore include control variables for market share (the firm's share of sales in its 4-digit industry) and market concentration (the Herfindahl Hirschman index for the firm's 4-digit industry). Market share is (surprisingly)
12
Compare Shin and Stulz (2000), who use a ln(firm age) control. We expect similar results for ln(years listed) and ln(firm age); we use ln(years listed) because of easier data availability.
13
For full sample regressions, coefficients on CG1 were generally simi lar and t-statistics were moderately higher with 4-digit industry controls. Coefficients and t-statistics for CG1 were sometimes weaker with 4-digit industry controls for regressions using smaller subsamples (under 100 firms), perhaps due to loss of degrees of freedom. Summary information on each 2-digit industry with at least one firm in our sample follows.
Code Industry No. of
firms Mean value of CG1 Mean value of Tobin's q 4 manufacturing 376 36.5 0.83
11 financial institutions and insurance 65 47.3 0.93
7 wholesale/retail trade 32 39.2 0.83
6 construction 26 36.8 0.82
9 transportation 13 39.1 0.82
5 electric, gas, water supply 10 39.4 0.77
13 services 7 45.2 1.16
2 fishing 4 27.4 0.51
10 post and telecommunications 3 63.0 1.48
3 mining 2 32.9 0.86
8 hotels and restaurants 1 37.4 0.84
17 recreation, culture, sports 1 25.1 1.84
insignificant. Market concentration is positive and significant, but loses significance in the 2SLS and 3SLS regressions in Table 9.
• The market value of common stock may be higher for firms with more easily traded shares. We control for ease of trading with a measure of share turnover, defined as turnover = total shares traded/(shares held by public shareholders). Turnover is positive and significant. It weakens and becomes only marginally significant in 2SLS
and insignificant in 3SLS.
• We include a control variable for membership in the top 30 chaebol, because other studies report evidence that chaebol firms behave differently than non-chaebol firms (Joh, 2003; Cho and Kang, 2002; Ferris, Kim and Kitsabunnarat, 2003). Chaebol30 is positive and significant, but loses significance in 2SLS and 3SLS, and also in OLS
regressions with 4-digit industries. These neutral-to-positive results contrast with Joh (2003), who finds lower profitability of chaebol- firms prior to the 1997-1998 financial crisis, and Cho and Kang (2002), who find lower market/book for chaebol firms in the post-crisis period from 1998-2000.14
• We include share ownership by the largest shareholder. Other studies find that high insider share ownership predicts higher value for Korean firms (Joh (2003) and Cho and Kang (2002)). In contrast, we find that the coefficient on sole ownership is close to zero. A possible explanation could be that our corporate governance index includes an ownership parity subindex (subindex P), and ownership parity is positively correlated with sole ownership (see Table 4, Panel B, regression (7)).15 However, this explanation is not supported by our data. Sole ownership remains small, insignificant, and of varying sign in regressions of Tobin's q on subindices A through E in Table 4, Panels B and C.
• We control for the existence of level 1, or level 2 or 3 ADRs. Firms with level 2 and 3
ADRs must comply with many of the disclosure rules of the stock exchange and country where they are cross- listed. In contrast, firms with level 1 ADRs are generally not subject to additional disclosure requirements. Other studies report that firms with level 2 or 3 ADRs, have higher Tobin's q (Doidge, Karolyi and Stulz, 2002; Coffee,
14
Ferris, Kim and Kitsabunnarat (2003) also find lower "excess value" (closely related to Tobin's q) for chaebol. firms. However, their results are suspect because chaebol firms are much larger than non-chaebol firms, on average, larger Korean firms have lower Tobin's q (see this paper and Cho and Kang, 2002), and they do not control for firm size.
15 The logic is that omitting a contro l for ownership parity, which correlates positively with both Tobin's
2002). Only 10 firms in our sample have level 1 ADRs, and only 6 firms have level 2 or 3 ADRs. These small numbers make it unlikely that the coefficients on these variables will be significant. In fact, the coefficients on both ADR variables are small and insigificant. in OLS, and turn negative in 2SLS and 3SLS. However, the coefficient on level 2 or 3 ADRs is positive and marginally significant in regressions with CG1 (rather than Tobin's q) as a dependent variable (see Table 9, Panel A, regression (2)).
• We use a dummy variable to control for inclusion in the Morgan Stanley Capital International (MSCI) Index. Inclusion in this index may proxy for foreign investor interest. The MSCI dummy variable is positive and significant. One might surmise that firms in the MSCI Index will have better corporate governance, either due to pressure from foreign investors or perhaps because better governance affects the chance that a firm will be included in this index. This surmise is not confirmed. The MSCI Index dummy is small and insignificant as a predictor of CG1 (see Table 9, Panel A, regression (1)).
• We include a bank dummy variable because banks may behave or be valued differently than other firms. There are only 12 banks in our sample. The coefficient on the bank dummy is small and insignificant. In contrast, the bank dummy is positive and highly significant as a predictor of CG1 (see Table 10, Panel A, regression (1)).
Table 2 provides a more detailed description of each control variable.
C. Subindices
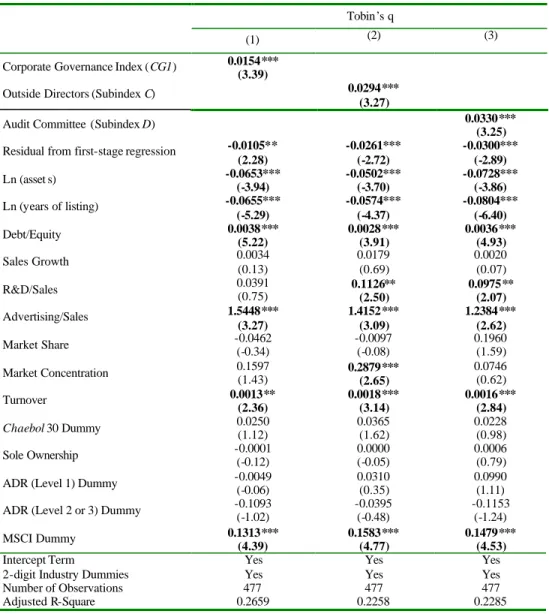
In Table 4 Panel B, we regress Tobin’s q on corporate governance index CG1
(reproducing Panel A, regression (7)), and the six subindices that comprise CG1: A
(shareholder rights), B (board of directors in general), C (outside directors), D (aud it committee and internal auditor), E (disclosure to investors), and P (ownership parity). Each regression uses the control variables developed in Panel A. Each subindex ranges from 0 to 20.
Each individual subindex is statistically significant at the 1% or 5% level. The strongest results are for subindices P (ownership parity), E (disclosure to investors), and A
(shareholder rights), in that order.16 The coefficient of 0.0042 on subindex D, for example,
16 Joh (2003) reports a negative and often (though not always) significant relationship between
implies that an improvement in corporate governance practice concerning the audit committee and internal auditor D, by 10 points predicts a 4.2% of the company’s book asset value.
Since each subind ex is significant, we expect that any weighting scheme will produce an overall index that is statistically significant in explaining the variation of Tobin's q. The coefficients are all similar in magnitude, ranging from a low of .0042 (for subindex D, audit committee and internal auditor) to a high of 0.0167 (for subindex P, ownership parity). Thus, the weighting of the subindices in the overall index is unlikely to greatly affect the coefficient or significance of the overall index. We confirm this intuition in Part VI, where robustness checks show that a number of alternative corporate governance indices produce similar results.
In Table 4 Panel C, Tobin’s q is regressed on each of the individual subindices with an additional control variable that captures the remainder of the index. That is, when regressing Tobin’s q on subindex A, we include the sum of the remaining subindices (B+C+D+E+P) as an additional control variable. Once we do this, only ownership parity (subindex P), disclosure to investors (subindex E), aned shareholder rights (subindex A) remain significant. This is consistent with all subindices being positively correlated (see Table 3, Panel D), and having a cumulative effect on Tobin's q.
D. Comparison with and Other Corporate Governance Indices
To test the power of the CLSA and S&P indices, we rerun our OLS regressions substituting these indices for CG1. Because of the small sample size (19 firms for CLSA; 33 firms for S&P), we try both regressions with all control variables and simpler regressions that use fewer control variables but preserve more degrees of freedom. The CLSA index is positive but insignificant in specifications that omit industry controls, and becomes slightly negative when we add industry controls. In a simple regression of Tobin's q on CLSA index plus constant term, the coefficient is .0074 (r = 0.13; t = 0.66), and is insignificant.
The S&P index is stronger. The coefficient for a simple regression of Tobin's q on S&P index plus constant term is .077 (r = 0.35; t = 2.72), compared to .006 (r = 0.22; t = 6.97) for the CG1 index. The coefficient on the S&P index declines to .054 and becomes only marginally significant when we add a full set of control variables other than industry controls, and declines again to .038 and becomes insignificant (t = 0.73) when we add 2-digit industry controls.
From this partial evidence, the S&P index would likely have predictive value for our full sample. It is possible, though far from certain, that the CLSA index would also have predictive value for our full sample.
E. Individual Corporate Governance Elements
Table 5, Panel A, shows results when Tobin’s q is regressed on each individual element of the corporate governance index. Each regression includes the same sample firms and control variables as in Table 4 Panels B and C. Almost all (35/38) of the coefficients on individual corporate governance elements are positive, and the three negative coefficients are insignificant. At the same time, only 8 out of 38 individual elements are significant at the 5% level. This implies that the elements of the corporate governance index ha ve more predictive power when aggregated into an index than individually.
The individual elements that are positive and significant are summarized in Table 5, Panel B. Some these elements relate to plausibly important governance elements. This conclusion applies to element C1 (firm has at least 50% outside directors); element D1 (firm has an audit committee); element D3 (bylaws governing audit committee or internal auditor exist); element D10 (audit committee or internal auditor meets with the external auditor), and element P (ownership parity, described above). The other three significant elements appear to address less central elements of corporate governance. It is not apparent why these elements were significant, while other elements were not. These elements are A4 (firm discloses director candidates to shareholders in advance of shareholder meeting), E1 (firm conducted investor relations activity in 2000), and E2 (firm website includes resumes of board members). A posssible explanation is that all three elements involve some form of disclosure (even though we include element A4 in the shareholder rights subindex, rather than the disclosure subindex). They likely correlate with and proxy for other measures of disclosure quality. The KSE survey did not ask many questions about disclosure, so we cannot verify this suspicion.
The single strongest coefficient is for element C1 (at least 50% outside directors), which has a coefficient of 0.1679 and a t-statistic of 5.03. The coefficient implies that a firm with 50% outside directors has a higher market capitalization by 17% of book asset value (albeit without controlling for the correlation of this element with other corporate governance elements). This result is in sharp contrast to the weak results found in the United States and other developed countries, where no one has yet found a reliable correlation between board composition and overall firm value or performance, despite many efforts. See Bhagat and Black (2002), and the surveys in Bhagat and Black (1999) and Weisbach and Hermalin (2002). This suggests that board independence is more important in a country where other constraints on insiders are weak. Independent directors could then play a larger role in, for example, controlling self-dealing transactions. An interesting question for future research is whether
the level of self-dealing (investments in or other transactions with affiliated firms, transactions between firms and their controlling shareholders, issuance of shares or convertible bonds to insiders) is in fact lower for firms with 50% (element C1) or more than 50% (element C2) outside directors (which has a positive but insignificant coefficient in Table 5, Panel A).
F. Subsample Results
The governance structure of Korean firms is in significant part determined by legal requirements. Legal requirements, in turn, depend in part on three factors: book asset value, affiliation to banking industry, and membership in one of the top 30 chaebol.
The Securities and Exchange Act sets the minimum ratio and number of outside directors, requires the establishment of audit and nomination committees, and sets the minimum ratio of outside directors in the audit committee. Such minimum ratios and requirements, however, vary according to the company’s book asset value. Listed companies with assets greater than 2 trillion won must have at least three outside directors and at least 50% outside directors. Those below the 2 trillion-won threshold need only to have 25% outside directors. Also, listed companies with assets greater than 2 trillion won must establish audit and nomination committees. When the audit committee is required, two third of its members must be outside directors and the chairperson must be an outside director. Thus, book value of assets is an important determinant of corporate governance in Korea.17
The Banking Act shapes the governance structure of commercial and merchant banks. Most of the requirements in the Securities and Exchange Act that apply to companies with assets greater than 2 trillion won also apply to commercial and merchant banks, regardless of their size. Thus, membership in the banking industry is another factor affecting corporate governance in Korea.18
The Monopoly Regulation and Fair Trade Act shapes the go vernance structure of firms that belong to one of the top 30 chaebol. For these companies, the Act requires board approval for related-party transactions if transaction size is greater than 10% of equity capital or 10 billion won. This requirement was not in effect for non-chaebol firms when the survey
17
The correlation coefficient between corporate governance index CG1 and asset size dummy (=1 if book value of assets > 2 trillion won) in our sample is 0.57 and statistically different from zero at 1% significance level.
18
The correlation coefficient between corporate governance index and banking dummy (=1 if a commercial bank or a merchant bank) in our sample is 0.3993 and statistically different from zero at 1% significance level.
was conducted.19 Thus, membership in the top 30 chaebol is a third factor influencing corporate governance in Korea.20
The fact that corporate governance is positively correlated with book asset value, membership in the banking industry, and membership in the top 30 chaebol raises a concern that the positive correlation in Table 4 Panel A between corporate governance and firm value may be spurious. For instance, if asset size, (or bank membership or top 30 chaebol
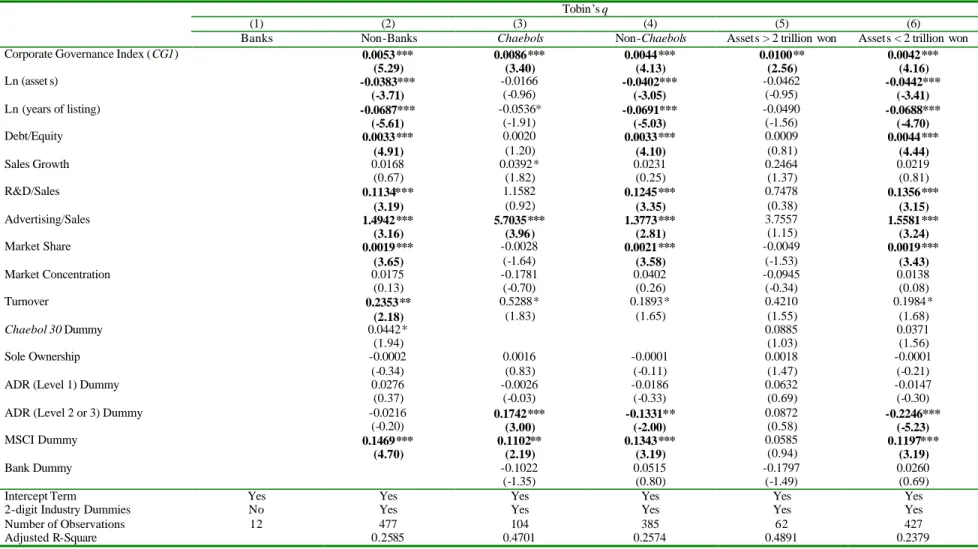
membership) is correlated both with firm value (Tobin’s q) and with our corporate governance index (CG1) because of the way Korean law is written, one would expect to find a positive correlation between CG1 and Tobin’s q even when there is no direct link between the two. The spurious relationship, however, can be checked by running the same regression as in Table 4 Panel A on the following six subsamples: banks (commercial and merchant) versus non-banks; firms belonging to the top 30 chaebol versus firms not so belonging; and firms with assets greater than 2 trillion won versus firms with assets less than 2 trillion won. If we find a positive link between corporate governance and firm value within the subsamples, this is evidence that the relationship is not spurious.
Table 6 shows the results. Notice that corporate governance index, CG1, is still an important factor explaining the variation of firm value in five out of six subsamples. The coefficient on corporate governance is not significant in the bank subsample, but this subsample has only 12 firms. The explanatory power of corporate governance is particularly high for the chaebol subsample. When explaining Tobin’s q, the coefficient on corporate governance index is higher for the chaebol sub sample than for the non-chaebol subsample (0.0094 versus 0.0045). This difference is significant (t-test for difference = 3.15)
19
With the amendment of the Securities & Exchange Act in March 28, 2001, all listed companies with book asset value greater than 2 trillion won must obtain board approval for related party transactions if the size is greater than 1% of book asset value or 1% o f total sales. Such amendment, however, was not in effect at the time when the survey was conducted.
20 The correlation coefficient between corporate governance index and chaebol dummy (=1 if affiliated
V. Corporate Governance and Firm Value: Simultaneous Equations Results
A. Endogeneity and the Effect of Mandatory Versus Voluntary Governance Choices
Two recurring issues in this and other studies of firm- level corporate governance are the potential for our results to be explained by signalling (firms signal high quality by adopting good governance rules, and it is the signal, not the governance rules, that affects firm value); and endogeneity (firms with high market value choose good governance rules, so that causation runs from our dependent variable (firm value) to corporate governance, rather than vice-versa). Firms with high market values could choose better governance structures for several reasons. They could choose better governance structures because (i) the firm's insiders believe that these structures will further raise firm value; (ii) firms with high Tobin's q (or other measure of firm value) benefit from improved governance structures more than other firms; or (iii) the firm's insiders believe that doing so will signal management quality even if the signal (the governance structure) does not in fact affect firm va lue. In the first case (partial reverse causation), there will be a causal connection between corporate governance and firm value, but the OLS coefficient will overstate the connection. In the second case (different firms need different governance structures), there will be a causal connection, but the OLS coefficient will overstate the connection and the causal connection for some firms will not imply that other firms can improve their market values by improvimg their governance. In the third case (signalling), there will be no causal connection at all.
There is evidence of endogeneity in other corporate governance studies. For example, Bhagat and Black (2002) report evidence from OLS regressions of a negative correlation between board independence and measures of firm performance. However, they also find evidence that firms that perform poorly increase the independence of their boards of directors. After controlling for this endogenous effect of performance on board composition, the negative correlation between board independence and firm performance weakens and is not reliably significant. Weisbach and Hermalin (2001) discuss endogeneity issues in board composition studies. Durnev and Kim (2002) develop a simple model in which a firm's choice of corporate governance is endogenously related to its investment opportunities, desire for external financing, and ownership by the controlling shareholder.
One way to assess the robustness of our results in the face of possible endogeneity is to see if they are present for subsamples. We have already confirmed robustness for several plausible subsamples in Table 6.
To test for the endogeneity of corporate governance, we follow the two-step procedure suggested by Wooldridge (2000). First, the possibly endogenous variable (corporate governance index) is regressed on all exogenous variables including the variable proposed to be used as an instrument for the potentially endogenous variable. The residual from this first-stage regression is the portion of the corporate governance index that is not predicted by the instrument or the other control variables, and thus is potentially endogenous. Second, the residual is added to the original equation and OLS is estimated. A significant coefficient on the residual is consistent with corporate governance being endogenous. A positive (negative) residual implies that the dependent variable (firm value) predicts a higher (lower) corporate governance score, and therefore that the OLS regression coefficients are upward (downward) biased.
Table 7 reports our results, using an asset size dummy as the instrument for corporate governance. We explain this choice of instrument below in Section B. The endogenous component of corporate governance is negatively correlated with the error term for Tobin's q. This suggests that the coefficients estimated by OLS in Tables 4, 5, and 6 are downward biased, and once endogeneity is addressed, the coefficient on corporate governance should increase. We in fact observe higher coefficients in the regressions in Table 7, where the coefficient on CG1 (and subindices C and D) can be interpreted as the coefficient on the exogenous component of this variable, and in the 2SLS and 3SLS regressions reported below 21
The negative coefficients on the residuals in Table 7 have several possible interpretations, but none are satisfactory. One interpretation is that more highly valued firms choose worse
corporate governance rules, perhaps because they face less investor pressure to improve their governance. (Compare the evidence in Bhagat and Black (2002) that worse-performing firms increase the independence of their boards of directors.) This interpretation, however, is not confirmed by the 3SLS regressions in Table 9, where Tobin's q takes a positive, albeit insignificant coefficient in regressions with CG1 as the nominally dependent variable.
A second interpretation is that only mandatory corporate governance rules predict higher firm value, while voluntarily chosen rules have the opposite effect. This seems implausible -- why would these rules reduce firm value, and if they did, why would firms choose these rules? This explanation is also inconsistent with the positive, albeit insignificant coefficient on Tobin's
q in the 3SLS regressions with CG1 as the nominally dependent variable. Lacking a good explanation, we leave this question as a puzzle that deserves future research.
21 By construction of the Wooldridge endogeneity test, the coefficients on corporate governance index
B. Instrument Specification
Standard econometric techniques for addressing possible endogeneity require identifying a good instrument. The instrument should ideally be exogenous and not likely to be influenced by the dependent variable of interest (here firm value, measured by Tobin’s q or, in our robustness checks, market/book, or market/sales). The instrument should be correlated, preferably strongly, with the independent variable of interest (corporate governance index) but otherwise uncorrelated with the dependent variable of interest (firm value). That is, the instrument should predict the dependent variable only indirectly, through its effect on the independent variable. For a recent survey of techniques for addressing endogeneity, see Angrist and Krueger, 2001.
To address endogeneity, we use an asset size dummy variable (defined to equal 1 if book value of assets is greater than 2 trillion won; and 0 otherwise) as the exogenous instrumental variable that is correlated with corporate governance, but hopefully does not directly predict Tobin's q (or other measures of firm value).22 We use ln(assets) as a separate control for firm size that hopefully captures most of the way in which firm size directly influences Tobin's q. We use both two-stage (2SLS) and three-stage (3SLS) least squares regressions to estimate the coefficients.23
We do not expect the asset size dummy to be a va lid instrument for banks (which must have an audit committee and at least 50% outside directors regardless of size) or for subindices
A, B, E, or P (which do not include rules for which the 2 trillion won size cutoff is relevant). Thus, in our endogeneity tests in Table 7 and in the 2SLS and 3SLS regressions discussed below, we exclude 12 banks from the sample, leaving a non-bank subsample of 477 firms. When we examine subindices, we study only subindices C and D.
We believe that the asset size dummy is an appropriate instrumental variable for the following reasons. First, as explained above in Part IV.E, the Securities and Exchange Act
22
Other corporate governance rules apply only to banks or only to firms that are part of one of the 30 largest chaebol groups. However, dummy variables for bank or membership in the top 30 chaebol are not satisfactory instrumental variables for corporate governance because they are likely to correlate with Tobin's q for reasons other than the quality of governance. This is obvious for banks, since industry is likely to affect Tobin's q. Firms that belong to a major chaebol group may be different than other firms in various ways, including political connections, access to financing (Shin & Park, 1999), or degree of diversification (Ferris, Kim & Kitsabunnarat, 2003).
23
3SLS, unlike 2SLS, makes use of the covariance matrix computed from the two disturbance terms in the 3SLS simultaneous equations framework. If the regression equations are just identified, the coefficients on 2SLS and 3SLS will be identical. However, the standard errors (and thus the t-statistics) will be different.
makes asset size an important determinant of corporate governance. Korean firms with assets greater than 2 trillion won must have an audit committee, an outside director nomination committee, and at leaset 50% outside directors. The effect of these legal requirements on corporate governance can be safely said to be exogenous.24
Second, once we control for the direct effect of asset size on Tobin's q through a control variable for ln(assets), it seems likely that the asset size dummy predicts firm value primarily indirectly, through its effect on corporate governance. We return in Part VI.C to the qeustion of whether ln(assets) is a reasonable functional form for the direct effect of firm size on Tobin's
q.
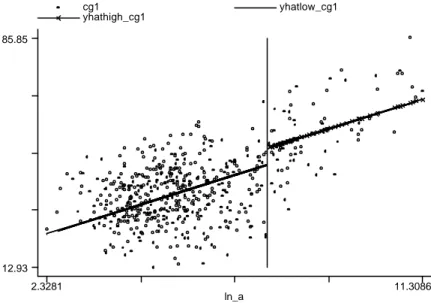
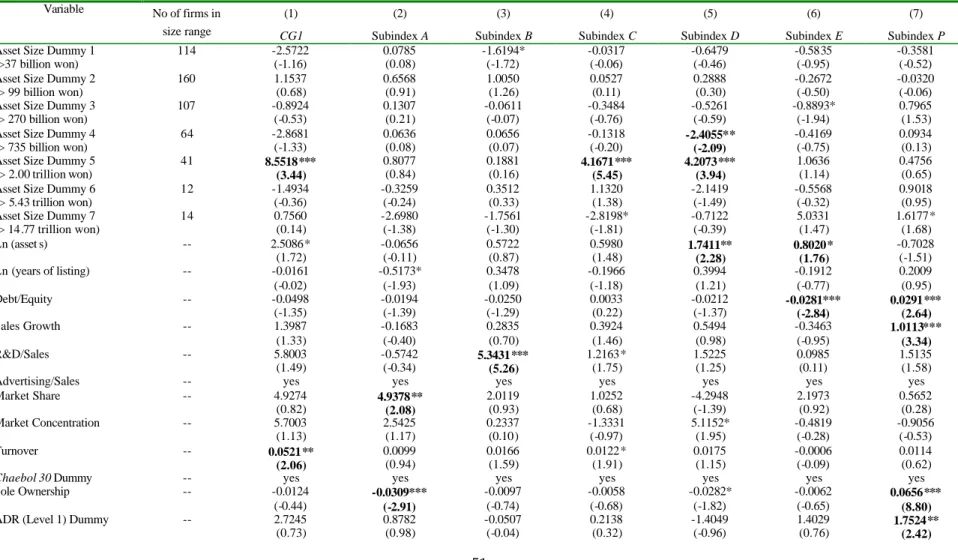
Third, we confirm in Table 8 that the asset size dummy at 2 trillion won has predictive power for CG1 and subindices C and D precisely where it should based on the relevant legal rules, and that asset size dummies at other sizes lack similar power. In Table 8, Panel A, we regress the overall corporate governance index (CG1) and each subindex (A, B, C, D, E, and P) on our usual control variables, including ln(assets),plus a family of asset size dummy variables, defined as follows:
Asset size dummy 1 = 1 if ln(assets) > 3.6 (assets > 37 billion won); 0 otherwise Asset size dummy 2 = 1 if ln(assets) > 4.6 (assets > 99 billion won); 0 otherwise Asset size dummy 3 = 1 if ln(assets) > 5.6 (assets > 270 billion won); 0 otherwise Asset size dummy 4 = 1 if ln(assets) > 6.6 (assets > 735 billion won); 0 otherwise
Asset size dummy 5 = 1 if ln(assets) > 7.6 (assets > 2 trillion won); 0 otherwise (this is our instrumental variable)
Asset size dummy 6 = 1 if ln(assets) > 8.6 (assets > 5.4 trillion won); 0 otherwise Asset size dummy 7 = 1 if ln(assets) > 9.6 (assets > 14.8 trillion won); 0 otherwise If the legal rules that apply to firms with assets greater than 2 trillion won cause these firms to have higher corporate governance scores, we should observe a significant coefficient on asset size dummy 5 for CG1, and the subindices to which the relevant legal rules apply -- C (outside directors)and D (audit committee and internal auditor). We expect other asset size dummies to show no consistent effect on CG1 or any of the subindices, and we expect asset size dummy 5 to have no significant effect on subindices A, B, E, and P.
24
Some firms with assets close to 2 trillion won might manage their assets to avoid being subject to these legal requirements. We are not aware of anecdotes suggesting such behavior, and the corporate governance rules are mild enough so that this is unlikely. Only a few firms have assets close enough to 2 trillion won to make this manipulation plausible. Three firms in our sample have assets between 1.9 and 2 trillion won, compared to 2 firms with assets between 2.0 and 2.1 trillion won. This difference is obviously not significant. For broader ranges of asset size (1.8-2.0 vs. 2.0-2.2 and 1.5-2.0 vs. 2.0-2.5 trillion won), there is again no significant difference between the number of firms in the lower size range and the number in the upper size range. Thus, any manipulation of asset size appears to be de minimus.
This is exactly what we observe. For asset size dummy 5 the coefficients are large, positive and highly significant for the regressions with CG1 and subindices C and D as dependent variables, and insignificant for other subindices. For the other asset size dummy variable, the coefficients are insignificant for the CG1 regression, and vary in sign and are mostly insignificant. The two significant coefficients (one negative, one positive) on subindices show no apparent pattern. Thus, Table 8, Panel A offers strong evidence that our asset size dummy is an exogenous predictor of corporate governance.
We further confirm that the asset size dummy predicts a change in firm behavior in Table 8, Panel B. Here, we focus on the specific rules that apply to firms with assets greater than 2 trillion won: governance elements C1 (firm has at least 50% outside directors) and D1 (firm has an audit committee). The differences are dramatic. Ninety-seven percent of firms above this threshold have at least 50% outside directors, compared to 4% of firms below the threshold. Similarly, 91% of firms above the threshold have an audit committee, compared to 7% of firms below the threshold.25
For the three stage least-squares regressions, we also need an instrumental variable for Tobin's q. We choose ln(years of listing) as a variable that is highly correlated with Tobin’s q
(see Table 4, Panel B), but does not appear in the corporate governance equation. Once again, to have a valid instrument, the instrument (here ln(years of listing)) should predict the dependent variable (here corporate governance index) only indirectly, through the instrumented variable (here Tobin's q) and not directly. There is no theoretical reason to expect that years of listing directly affects corporate governance, and there is no significant relationship between the two in our sample (see the first stage regressions of CG1, treated as a dependent variable, in
Table 9, Panel A).
With this choice of instruments, 3SLS estimates the following system of simultaneous equations:
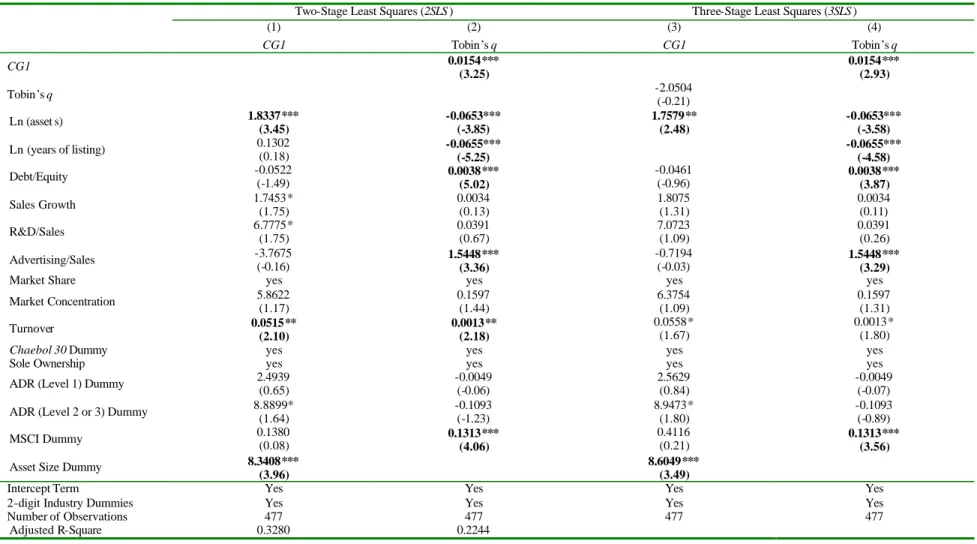
Tobin’s q = f (CG1, ln(years of listing), other exogenous variables) + ε --- (2) CG1 = g (Tobin’s q, asset size dummy, other exogenous variables) + η --- (3) C. 2SLS and 3SLS Results
25 The principal reason for noncompliance by firms above the 2 trillion won threshold are (i) the firm recently crossed the threshold and has not yet adjusted the composition of its board of directors or created an audit committee; and (ii) three utilities that are majority state-owned (Korea Telecom, Korea Electric Power, Korea Gas Corporation) are exempt from the audit committee requirement.
Table 9 shows the 2SLS and 3SLS results for the overall index CG1, and subindices C and D. The other subindices are not regressed since there is no obvious reason to believe that asset size dummy is a good instrument. We exclude banks from the sample since we have theoretical reasons to believe that our instrument is not valid for banks. The coefficients on CG1 and on subindices C and D the indices are larger than those estimated by OLS and reported in Table 4. This is consistent with the endogeneity test in Table 7, which found a negative correlation between the corporate governance indices and the error term. The coefficient of 0.0194 on
CG1 in regression (2) of Table 9 is statistically significant at the 1% level and almost three times larger than the OLS estimate in Table 4. The coefficient implies that an increase in the overall corporate governance by 10 points results in an increase of market capitalization by 19.4% of the company’s book asset value. Notice that our instrumental variable, asset size dummy, is highly significant in the first-stage regression (1).26
The coefficient of 0.0423 on subindex C in equation (6) suggests that a 10-point improvement in outside director practice predicts an increase in market capitalization of 42.3% of the company’s book asset value. The coefficient of 0.0487 on subindex D in equation (10) suggests that an improvement of audit committee and inside auditor practice by 10 points predicts an increase in market capitalization of by 48.7% of the company’s book asset value. The coefficients on Tobin’s q in 3SLS for CG1, C, and D are not statistically significant, suggesting that the causality goes primarily from corporate governance to firm value, not the other way around (regressions 3, 7, and 11).
Our results imply that mandatory rules can have a real effect on firm behavior, specifically the rules requiring firms with 2 trillion won in assets to have 50% outside directors and an audit committee. A competing hypothesis can be called the "lackey effect": Mandatory rules will have little effect because company insiders who do not want more outsiders on their boards, or do not want an audit committee, will put lackeys on the board or audit committee, and the firm's behavior will not change. There may be a lackey effect at some firms, but our results suggest that these rules can affect firm behavior, or so investors believe.
D. Chaebol Versus Non-Chaebol Subsamples
26 Also notice that 2SLS and 3SLS coefficients are identical. This is because the system is just
Table 10 shows 2SLS and 3SLS results for the overall CG1 index for the whole sample and the subsamples of chaebols, and non-chaebols. We do not analyze the bank subsample due to its small size (12 firms). We do not analyze subsamples divided by asset value because we are using asset size dummy as an instrument. The results show that corporate governance affect firm value for both chaebol firms and non-chaebol firms. The coefficient on CG1 on CG1 is 0.0178 for chaebol firms and is significant in 3SLS and marginally significant in 2SLS. The coefficient for non-chaebol firms is .0109 and is highly significant in both 2SLS and 3SLS. Our results are likely weaker for chaebol firms primarily because of the smaller size of the
chaebol subsample (104 firms).
VI. Robustness Checks
In this section, we describe a number of checks on the robustness of our results and the reliability of our asset size dummy as an instrument for corporate governance. First, we assess how using different weighting schemes to combine our corporate governance subindices into an overall corporate governance index affects our results. Second, we consider how using other measures of firm value affects our results. Third, we address some issues involving instrument reliability.
A. Alternate Specifications of the Corporate Governance Index
We construst five alternative corporate governance indices, as follows. Recall that our basic CG1 index combines subindex B (board of directors in general) and subindex C (outside directors) into an overall board of directors subindex. We then equally weight this overall board subindex and the other four subindices (A (shareholder rights), D (audit committee and interna l audit), E (disclosure to investors), and P (ownership parity)), giving each a weight of 20 points toward an overall total of 100 points.
CG2 splits subindices B (board of directors in general) and C (outside directors), and thus gives more weight to these subindices, at the cost of possibly overweighting board of directors variables in the overall index. CG3 drops subindex C (outside directors), and thus give zero weight on C (outside directors) and a greater weight on B (board of directors).27 Each index is scaled to have a value between 0 and 100
27 The reason, such as it is, for this alternate specification is that in Table 4, Panel C, where we run OLS
(
B C)
D E P A CG1= + + 2+ + + --- (1)(
)
[
A B C D E P]
CG2= 100/120 + + + + + --- (4) P E D B A CG3= + + + + --- (5)Table 11 shows the results. Given that each subindex is individually significant as a predictor of Tobin's q (Table 4, Panel B), we expect, and find, that altering the linear combinations of subindices used to form the overall index has only a small effect on the coefficients or t-statistics for the overall index. This remains true in 2SLS and 3SLS, and for two alternative firm value variables, market/book and market/sales.
Table 4, Panel C can be seen as providing still other alternative specifications of a possible corporate governance index. Each regression in this Panel shows a statistically significant coefficient on a Reduced Index consisting of the sum of different groups of five of the six subindices, with a separate control variable for the 6th subindex. The coefficients on the Reduced Index are highly significant in all cases, and range from .0033 to .0057. Thus, they are comparable in magnitude to the .0059 coefficient for the full CG1 index in Table 4, Panel B.
B. Alternative Measures of Firm Value
As a robustness check, we consider two additional firm performance measures: market-to-book ratio and market-to-sales ratio. Market-market-to-book ratio is defined as the market value of common stock divided by the book value of common stock. Market-to-sales ratio is defined as the market value of assets divided by sales.
Table 11 summarizes the results for these variables. The results for market/book are similar in statistical significance to those for Tobin's q. The results for market/sales are weaker than those for Tobin's q or market/book, with t-stastistics in the 4's for OLS and 2's for
2SLS and 3SLS, but remain statistically significant (highly so for OLS). Overall, these results confirm that the importance of corporate governance as a predictor of firm value is robust to different specifications of firm value.
C. Instrument Reliability: Functional form for Dependence of Firm Value on Firm Size
subindex C has a negligible (indeed slightly negative) coefficient. However, when we remove subindex C, the coefficient on the overall index declines in OLS, and statistical significance declines in 3SLS.