ISSN: 2347-7474
International Journal Advances in Social Science and Humanities
Available online at: www.ijassh.com
RESEARCH ARTICLE
Evaluating the Extent of Share Price Dispersion on the Nigerian
Stock Exchange
Fadiran Taiwo P*
Accounting Department, Adekunle Ajasin University, Akungba-Akoko, Ondo State, Nigeria
*Corresponding Author: Email:
[email protected]
Abstract
The stock markets globally undergo overvaluation and undervaluation cycles. For one reason or the other
a stock may worth more or less than the current market price (SP); the gap referred to as Spare Price
Dispersion. The literatures, both theoretical and empirical, conclusively opine that overvaluation and
undervaluation result in suboptimal allocation of resources. While it may not be possible to eliminate
share price dispersion completely in capital markets, to what extent should SP be different from its
intrinsic value? The objective of this study is to evaluate the extent of share price dispersion (SPD) on the
Nigerian Stock Exchange (NSE)
.
Using the Dividend Share Valuation Model (DSVM) as economic
measure of intrinsic value (INTV), the study evaluated the intrinsic value of dividend paying firms on
the NSE and compared this with SP to determine the extent of SPD in the market. Nine percent of the
shares in the study were undervalued while the remaining 91% (786) were overvalued. Analysing the
extent of dispersion revealed that 179 i.e. 20.72% are less than N1, 406 (47%) between N1 and N10 with
14% amounting to 121 shares have dispersion in their share price between N10 and N20. Approximately
11% have their price dispersion between N20 and N50 while 5% are between N50 and N100 with 2%
above N100. Share Price Dispersion, whichever direction it is, has severe economic consequences;
therefore its determinants should be identified for policy attention to mitigate its adverse effect of
misallocation of resources.
Keywords:
Dividend Share Valuation Model, Intrinsic Value, Nigerian Stock Exchange, Share Price
Dispersion, Share Price.
Introduction
Stock market report is a major news items
on a daily basis; with opening and closing
share price as well as top losers and gainers
publicly announced. Share price by its
nature is known to be volatile, but the
concern is how close or far to the intrinsic
values are these price movements. The
objective of the research is to ascertain the
gap between share price and its intrinsic
value on the Nigerian Stock Exchange
(NSE).
The stock markets globally tend to undergo
overvaluation and undervaluation cycles.
For one reason or the other a stock may be
worth more or less than the current market
price. Optimal pricing is essential for the
best possible allocation and utilization of
economy scarce resources. If the capital
market must attract needed funds for
growth and development, the problem of
overvaluation
and
undervaluation
of
securities must be addressed.
What are the bases of valuing stock on the
Nigerian Stock Exchange (NSE) and how
close to their intrinsic values are these
market prices? This study attempts to find
answer to these questions.
and discussion while the last section
concludes the study with recommendations.
Literature Review
Stock valuation approach followed on the
NSE is the fundamental approach to
valuation of shares and the methods used at
one time or the other is either the Net Asset
basis or the maintainable profit basis [1,2].
To effectively forecast the future cash
income and earnings of a company, the
Security
and
Exchange
Commission
examined
information
contained
in
published annual financial reports and/or
the prospectus of such company. Financial
analysis through various forms of ratios is
normally carried out to evaluate the
profitability performance, liquidity as well
as the capital structure among others.
Relevant ratios include the following: Price
earnings ratio, Earnings per share,
Earnings yield, Dividend per share, Return
on Equity, Gearing ratio, Book value of the
share, liquidity ratios, and growth rate of
turnover, profit, dividend, shareholders
fund, capital employed and return on
capital employed.
The Net Assets Value Basis method seeks to
determine the price of shares by dividing
the net assets (excluding fictitious and
intangible assets) of the company by the
number of equity shares. Where the
intangible assets have a marketable value,
they are included in arriving at the net
assets value.
The Maintainable Profit Basis Method
capitalizes the average profits of the
company at the expected rate of return in
the industry and divides the amount so
computed by the number of share to obtain
the unit price of shares. There are a number
of other methods for valuing shares adopted
by practitioners and these methods include
Earnings Basis, Super Profits Method and
Dual Capitalization Method.
If shares are held in perpetuity and firms
are supposed to be going-concern, then why
estimating the value of a share on the basis
of net assets as if the assets were to be
realized as practiced on the NSE? Moreover,
assets’ valuations in the annual reports are
usually based on the historical cost
accounting principle which tends to
understate certain asset values below the
current market price. Therefore, adopting
the valuation of a share on the basis of
income that accrues to the shareholders by
calculating the present value of streams of
dividend is more intuitive and a more
realistic measure of the intrinsic value of a
share.
Theoretical
Framework
and
Methodology
Theoretical Framework
The Dividend Share Valuation Model
(DSVM) was used to evaluate the intrinsic
value of the shares in the market. It was
adopted and adapted by using time varying
discount and interest rates. The DSVM
developed by Modigliani and Miller [3]
states that stock prices equal the discounted
value of streams of future dividends.
Therefore, the benefit from owning a share
is discounted to their Present Value to
determine the current price of a share,
given by:
SP
0= D
1+ SP
1/ (1 + Ke )
Eq 1
Where:
SP
0is the current share price
D
1is the dividend to be received in a year’s
time.
SP
1is the share price in a year’s time.
Ke is the rate of return for securities of this
risk class.
Note that SP
1depends on benefits the next
owner expects to get from ownership.
SP
1= D
2+ SP
2/ (1 + Ke)
Eq 2
Substituting for P1 in P0, we have:
SP
0= D
1/(1+Ke) + D
2/(1+Ke)
2+ SP
2/(1+Ke)
2Eq 3
In the same way, SP
2and subsequent SP
SP
0= D
1/(1+Ke) + D
2/(1+Ke)
2+ D
3/(1+Ke)
3+---
Eq 4
Thus:
∞
SP
0= ∑ D
t/ (1+K
e)
tEq 5
t=1
The equation above presents the dividend
share valuation model (DSVM) and it
follows that:
SP
t= ∑ D
t+1/ (1+ K
e)
tEq. 6
Where:
SP
t, is the price of a share at time t
D
t+1is the dividend paid at time t+1 and
K
eis the rate of return for securities of this
risk class used as the stochastic discount
factor for cash flows that occur at time t.
Simply put Equation 2 becomes:
Share Price = D
1k – g
Eq. 3
Where:
D
1=Next
Year's
Dividend
k=
interest
Rate
g = Dividend Growth Rate
Methodology and Data Source
The intrinsic value of each firm’s share was
calculated using the Constant Growth
model variant of Dividend Share Valuation
Model (DSVM) given above. Instead of
using an assumed constant growth rate for
dividend and discount rate, the study
utilized the dividend growth rate for each of
the firm from period to period. Also, the
prevailing interest rate in each of the period
was used as the discounting rate for that
period. The choice of these variants was to
allow for comparison of value. For the
share price of each firm, the annual average
of the shares concerned was used. This was
generated from the daily official price
history of the firms from NSE. Share price
dispersion was evaluated by taking the
difference between the annual average of
the share price and the calculated intrinsic
value.
Empirical Analysis and Discussion
Descriptive Analysis
The descriptive statistics of the variables
are presented in table 1.
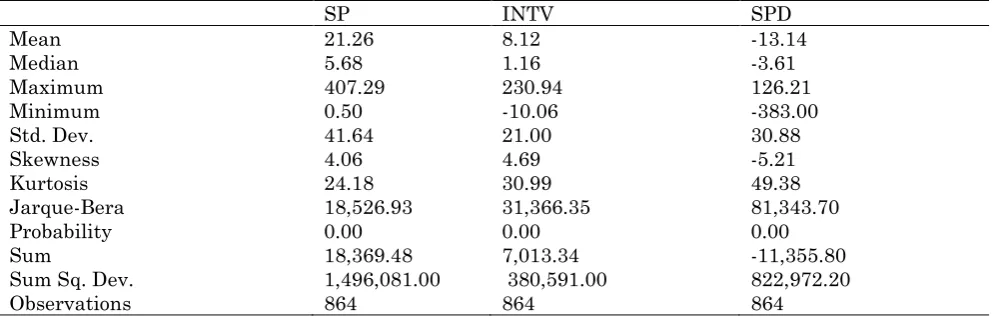
Table 1: Descriptive statistics of the variables
SP
INTV
SPD
Mean
21.26
8.12
-13.14
Median
5.68
1.16
-3.61
Maximum
407.29
230.94
126.21
Minimum
0.50
-10.06
-383.00
Std. Dev.
41.64
21.00
30.88
Skewness
4.06
4.69
-5.21
Kurtosis
24.18
30.99
49.38
Jarque-Bera
18,526.93
31,366.35
81,343.70
Probability
0.00
0.00
0.00
Sum
18,369.48
7,013.34
-11,355.80
Sum Sq. Dev.
1,496,081.00
380,591.00
822,972.20
Observations
864
864
864
Table 1 reveals that the mean distribution
for share price is N21.26 with the minimum
of N 0.50 and maximum of N407.29 with
standard deviation as high as 41.64. The
mean distribution for intrinsic value of
shares is N8.12 with a minimum of N-10 and
a maximum of N230.94 with standard
deviation of 21. Share price dispersion in the
market has a mean distribution of N-13.14,
minimum of N-383, maximum of N126.21
with a standard deviation of
approximately 31. This descriptive statistics
reveal a wide divergence between share
prices and its intrinsic value. There is also a
wide divergence in Share price dispersion in
the market.
Correlation Statistics
Table 2: Correlation statistics among the
variables
SP
INTV
SPD
SP
1.00
INTV
0.70
1.00
The correlation statistics between share
prices and intrinsic value is 0.7 (70%) as
shown on table 2. This shows that share
price (SP) is clearly different from its
intrinsic value (INTV) in the market with a
gap of 30%. There is also a positive
correlation between SP and INTV which
indicates that, although they are different,
the higher the intrinsic value, the higher the
market share price will be. The table also
reveals a negative correlation between share
prices and share price dispersion, implying
that the higher the price dispersion, the
lower the share prices.
The
Extent
of
Share
Price
Dispersion on NSE
The extent of Share price dispersion on the
Nigerian Stock Exchange is shown in
Appendix I. Most of the shares in the market
were overvalued or undervalued in the
period covered by the study, 2000-2011.
Share Price dispersion (SPD) with positive
sign is an under valuation while SPD with
negative sign is an overvaluation (-). An
analysis of the extent of price dispersion in
the market is presented on table 4.3. In the
12 year period for 72 firms, giving us a total
of 864, only 78 (9%) were undervalued while
the remaining 786 (91%) were overvaluation.
the table also shows that the extent of
undervaluation was not so much except for
about six figures out of 78 that are outliers
(43.61, 89.63, 129.21, 43.43, 55.05 and
82.22), the rest are 20 and below.
Approximately 54% of undervaluation was
below N1, 31% between N1 and N10, 2.6%
lies between 20-50 with 3.85% between
50-100 and only one (28%) greater than N50-100.
If we compare this with the list of
overvalued shares totaling 786 (91%),
17.43% lies between 0 and N1, 48.6%
between N1 and N10; 14.63% lies between
N10 and N1.
Table 3: Analysis of share price dispersion on NSE
S/N
Price dispersion
Undervalued shares
Overvalued shares
Total
NO
% of total %
of
under
NO
% of total %
over
of
NO
%
1
PD<1
42
23.46
53.85
137
76.54
17.43
179
20.72
2
1≤PD≤10
24
5.91
30.77
382
94.09
48.60
406
46.99
3
10<PD≤20
6
4.96
7.69
115
95.04
14.63
121
14.00
4
20<PD≤50
2
2.13
2.56
92
97.87
11.70
94
10.88
5
50<PD≤100
3
6.38
3.85
44
93.62
5.60
47
5.44
6
PD> 100
1
5.88
1.28
16
94.12
2.04
17
1.97
TOTAL
78
9.03
100
786
90.97
100
864
100
In all, shares price dispersion (SPD) of less
than N1 (over or under valued) are 179 in
number, i.e. 20.72%. Share price dispersion
between N1 and N10 amounts to 406 in
number which accounts for about 47%.
Fourteen per cent (14%) of share price
dispersion (121 shares) were between N10
and N20. Approximately 11% have their
price dispersion between N20 and N50 while
5% are between N50 and N100 with only 2%
above N100.
Conclusions and Recommendations
The fundamental approach to valuation of
shares being adopted on the Nigerian Stock
Exchange is ideal. However, since shares are
held in perpetuity and firms are supposed to
be going-concern, valuation of shares on the
basis of income that accrues to the
shareholders by calculating the
present value of streams of dividend is more
intuitive and a more realistic measure of the
value of a share as opposed to either the Net
Asset or the maintainable profit methods
used in the market.
References
1.
Ekpenyong DB (1994) Investing in Securities
in Nigeria: The Investor’s Guide, Linnet Paul
Publications.
2.
Oludoyi SB (1998) Capital Market Efficiency
and the Effects Of Earnings Announcements on
Share Prices in Nigeria, An Unpublished Ph.D
Thesis submitted to the Department of
Economics. University of Ibadan.
3.
Miller M, Modigliani F (1961) Dividend policy,
growth and the valuation of shares, Journal of
Business, October. 34:411-433.
4.
Baumol W (1965) The Stock Market and
Economic Efficiency, Fordham University
Press,1-8.
5.
Chen J, Hong H, Stein JC (2002) Breadth of
ownership and stock returns. Journal of
Financial Economics. 66:171-205.
6.
Chowudhury RA, Abdullah MN (2011)
Overheated Stock Market: Remedial Measures
for Soft Landing. Journal Of The Institute Of
Cost
&
Management
Accountants
of
Bangladesh 39(5):28.
7.
Kamstra MJ (2003)
Pricing Firms On The
Basis Of Fundamentals, Federal Reserve Bank
of Atlanta,
Economic Review.
8.
Shiller RJ
(
2000) Irrational Exuberance,
Princeton University Press.
9.
Singhvi SS, Desai HB (1971) An empirical
analysis of the quality of corporate financial
disclosure, The Accounting Review, 129-138.
10.
Stigler GJ (1961) The Economics of
APPENDIX I
Share Price Dispersion ON NSE
Obs
SP INTV SPD Obs SP INTV SPD Obs SP INTV SPD
1 - 00 10.2 11.49 1.29 5 – 00 15.67 7.66 -8.01 9 – 00 2.18 1.44 -0.75 1 - 01 9.45 5.08 -4.37 5 – 01 25.65 10.01 -15.64 9 – 01 3.2 1.81 -1.39 1 - 02 8.58 2.66 -5.92 5 – 02 21.59 8.1 -13.49 9 – 02 4.79 2.09 -2.70 1 - 03 6.82 6.29 -0.53 5 – 03 23.26 12.48 -10.78 9 – 03 3.55 2.55 -1.00 1 - 04 15.3 8.08 -7.21 5 – 04 25.89 17.08 -8.81 9 – 04 4.88 1.42 -3.46 1 - 05 15.45 11.52 -3.93 5 – 05 28.41 20.96 -7.45 9 – 05 3.9 1.12 -2.78 1 - 06 25.44 1.12 -24.32 5 – 06 41.6 16.31 -25.28 9 – 06 3.32 0.12 -3.20 1 - 07 32.68 0.11 -32.57 5 – 07 40.67 1.11 -39.57 9 – 07 8.82 0.11 -8.71 1 - 08 33.03 2.11 -30.92 5 – 08 36.92 0.08 -36.83 9 – 08 14.85 0.08 -14.77 1 - 09 26.95 1.98 -24.97 5 – 09 16.13 0.08 -16.05 9 – 09 4.54 0.08 -4.46 1 - 10 15.32 3.97 -11.35 5 – 10 14.78 8.34 -6.44 9 – 10 1.1 0.14 -0.97 1 - 11 17.15 26.41 9.26 5 – 11 14.78 12.5 -2.28 9 – 11 1.02 0.16 -0.86 2 - 00 1.57 0.1 -1.48 6 – 00 2.88 3.16 0.28 10 – 00 24.02 22.99 -1.03 2 - 01 2.61 2.97 0.36 6 – 01 5.7 3.75 -1.95 10 – 01 36.35 29.48 -6.87 2 - 02 2.98 2.08 -0.90 6 – 02 5.91 3.93 -1.98 10 – 02 38.53 23.83 -14.69 2 - 03 4.75 2.95 -1.81 6 – 03 6.45 5.25 -1.21 10 – 03 73.26 65.53 -7.74 2 - 04 8.65 2.33 -6.31 6 – 04 13.03 5.57 -7.46 10 - 04 122.11 71.56 -50.56 2 - 05 6.49 3.63 -2.86 6 – 05 10.84 7.22 -3.61 10 - 05 93.58 35.22 -58.36 2 - 06 7.54 4.24 -3.31 6 – 06 15.35 10.96 -4.39 10 - 06 114.62 48.09 -66.52 2 - 07 26.6 4.07 -22.52 6 – 07 30.9 74.51 43.61 10 - 07 124.34 47.29 -77.04 2 - 08 23.41 3.37 -20.04 6 – 08 26.97 5.5 -21.46 10 - 08 119.69 106.09 -13.60 2 - 09 8.73 1.54 -7.18 6 – 09 12.52 5.56 -6.97 10 - 09 111.51 59.8 -51.71 2 - 10 4.52 1.39 -3.13 6 – 10 17.15 8.54 -8.61 10 - 10 157.31 104.28 -53.03 2 - 11 2.16 1.6 -0.56 6 – 11 15.71 9.54 -6.18 10 - 11 215.8 132.2 -83.59 3 - 00 1.09 0.1 -0.99 7 – 00 7.76 8.14 0.38 11 - 00 0.52 15.13 14.61 3 - 01 1.3 0.1 -1.20 7 – 01 12.03 3.18 -8.85 11 - 01 1.3 21.88 20.58 3 - 02 1.83 0.06 -1.77 7 – 02 8.34 1.73 -6.61 11 - 02 1.26 13.55 12.29 3 - 03 1.83 0.42 -1.41 7 – 03 7.82 3.29 -4.53 11 - 03 42.1 9.74 -32.37 3 - 04 3.02 -0.18 -3.20 7 – 04 10.75 4.58 -6.17 11 - 04 66.83 3.91 -62.92 3 - 05 3.02 1.12 -1.90 7 – 05 11.57 7.05 -4.52 11 - 05 35.2 6.86 -28.34 3 - 06 3.52 0.12 -3.40 7 – 06 17.56 11.54 -6.02 11 - 06 37.69 13.68 -24.01 3 - 07 16.46 0.11 -16.36 7 – 07 45.57 1.11 -44.46 11 - 07 41.51 16.43 -25.08 3 - 08 16.8 1.46 -15.34 7 – 08 36.59 0.08 -36.50 11 - 08 47.49 38.85 -8.64 3 - 09 6.33 2.49 -3.84 7 – 09 11.31 0.08 -11.23 11 - 09 46.67 14.88 -31.79 3 - 10 8.85 3.49 -5.36 7 – 10 11.16 0.14 -11.02 11 - 10 67.69 48.26 -19.43 3 - 11 7.24 6.52 -0.72 7 – 11 10.19 0.16 -10.03 11 - 11 86 56.77 -29.23 4 - 00 5 0.1 -4.90 8 – 00 12.42 102.04 89.63 12 - 00 7.14 0.57 -6.57 4 - 01 8.91 0.15 -8.76 8 – 01 24.26 150.47 126.21 12 - 01 19.27 -4.07 -23.33 4 - 02 7.91 0.1 -7.81 8 – 02 22.26 8.95 -13.31 12 - 02 17.73 4.05 -13.67 4 - 03 6.92 -7.71 -14.63 8 – 03 25.66 11.29 -14.37 12 - 03 15.04 12.54 -2.50 4 - 04 6.8 1.3 -5.49 8 – 04 28.69 11.43 -17.26 12 - 04 21.28 3.17 -18.11 4 - 05 7.34 1.12 -6.22 8 – 05 24.16 16.13 -8.03 12 - 05 27.15 19.58 -7.56 4 - 06 9.15 0.12 -9.02 8 – 06 26.03 8.92 -17.11 12 - 06 42.68 18.51 -24.17 4 - 07 19.78 0.11 -19.68 8 – 07 37.1 10.1 -27.00 12 - 07 62.7 1.11 -61.59 4 - 08 22.84 0.08 -22.75 8 – 08 37.16 1.08 -36.07 12 - 08 38.36 0.08 -38.28 4 - 09 5.3 0.08 -5.22 8 – 09 10.75 0.08 -10.67 12 - 09 11.5 0.08 -11.43 4 - 10 2.38 0.14 -2.24 8 – 10 5.43 0.14 -5.29 12 - 10 20.07 0.14 -19.93 4 - 11 0.5 0.16 -0.34 8 – 11 3.18 0.16 -3.02 12 – 11 21.54 0.16 -21.38
Share Price Dispersion On NSE Continued
Obs SP INTV SPD Obs SP INTV SPD Obs SP INTV SPD
13 – 00 2.15 0.1 -2.06 17 – 00 3.09 3.83 0.75 21 – 00 1.2 1.2 0.00
16 – 03 3.65 3.96 0.30 20 – 03 1.05 0.08 -0.97 24 - 03 8.61 5.4 -3.21 16 – 04 6.45 4.4 -2.05 20 – 04 1.05 1.23 0.18 24 - 04 14.58 6.01 -8.57
16 – 05 7.49 7.79 0.31 20 – 05 1 1.73 0.73 24 - 05 13.76 8.64 -5.12
16 – 06 15.23 6.34 -8.89 20 – 06 0.68 6.75 6.07 24 - 06 21 8.43 -12.56 16 – 07 41.2 9.42 -31.79 20 – 07 1.16 11.13 9.98 24 - 07 25.92 7.45 -18.47 16 – 08 56.26 6.32 -49.95 20 – 08 7.9 4.95 -2.95 24 - 08 24.21 5.35 -18.85 16 – 09 32.26 14.05 -18.22 20 – 09 7.06 18.42 11.36 24 - 09 18.79 5.3 -13.49 16 – 10 30.73 14.4 -16.33 20 – 10 6.43 1.68 -4.75 24 - 10 29.69 11.65 -18.03 16 – 11 27.89 1.16 -26.73 20 – 11 5.4 0.8 -4.60 24 - 11 32.71 13.79 -18.93
Share Price Dispersion On NSE Continued
Obs SP INTV SPD Obs SP INTV SPD Obs SP INTV SPD
25 – 00 1.23 1.43 0.20 29 – 00 1.63 0.72 -0.91 33 - 00 6.81 7.61 0.80 25 – 01 2.64 1.49 -1.16 29 – 01 2.86 0.74 -2.12 33 - 01 9.84 7.46 -2.38 25 – 02 2.56 0.97 -1.60 29 – 02 2.57 -6.28 -8.85 33 - 02 9.02 11.24 2.23 25 – 03 2.54 1.08 -1.45 29 – 03 2.22 8.87 6.65 33 - 03 12.52 4.96 -7.56 25 – 04 2.11 0.08 -2.03 29 – 04 2.21 1.72 -0.49 33 - 04 17.67 2.86 -14.81 25 – 05 0.9 0.12 -0.78 29 – 05 1.84 1.3 -0.53 33 - 05 16.46 5.09 -11.37 25 – 06 0.59 0.12 -0.47 29 – 06 2.82 1.71 -1.11 33 - 06 21.78 3.53 -18.25 25 – 07 2.75 0.11 -2.64 29 – 07 10.36 1.06 -9.30 33 - 07 24 1.11 -22.89 25 – 08 12.47 0.08 -12.39 29 – 08 13.42 1.01 -12.40 33 - 08 27.24 2.11 -25.14 25 – 09 10.66 1.19 -9.47 29 – 09 4.71 0.95 -3.76 33 - 09 17.41 1.08 -16.33 25 – 10 8.71 1.58 -7.13 29 – 10 3.11 1.67 -1.44 33 - 10 34.03 0.14 -33.89 25 – 11 6.92 1.28 -5.63 29 – 11 2.08 1.92 -0.15 33 - 11 30.95 14.43 -16.52 26 – 00 3.59 0.1 -3.50 30 – 00 3.6 3.83 0.24 34 - 00 31.45 35.92 4.47 26 – 01 3.55 14.87 11.32 30 – 01 5.63 4.71 -0.92 34 - 01 63.83 54.04 -9.79 26 – 02 3.96 21.14 17.18 30 – 02 5.37 4.32 -1.05 34 - 02 72.02 47.81 -24.22 26 – 03 6.35 49.77 43.43 30 – 03 12.01 6.31 -5.70 34 - 03 96.18 58.99 -37.20 26 – 04 14.14 69.2 55.05 30 – 04 27.71 7.86 -19.85 34 - 04 163.28 57.33 -105.95 26 – 05 14.89 12.4 -2.49 30 – 05 25.98 14.15 -11.83 34 - 05 157.05 80.65 -76.41 26 – 06 21.66 12.11 -9.55 30 – 06 38.73 15.13 -23.60 34 - 06 205.33 120.64 -84.69 26 – 07 36.09 17.21 -18.88 30 – 07 47.46 13.66 -33.80 34 - 07 236.12 88.99 -147.13 26 – 08 46.32 16.69 -29.63 30 – 08 39.17 12.49 -26.68 34 - 08 230.28 70.84 -159.45 26 – 09 33.71 10.65 -23.07 30 – 09 33.98 1.08 -32.90 34 - 09 182.44 98.89 -83.56 26 – 10 42.57 1.14 -41.43 30 – 10 39.97 0.14 -39.83 34 - 10 334.25 27.96 -306.29 26 – 11 35.96 0.16 -35.80 30 – 11 45.24 0.16 -45.08 34 - 11 407.29 24.29 -383.00 27 – 00 10.12 6.7 -3.42 31 – 00 14.83 10.54 -4.29 35 - 00 12.2 2.87 -9.32 27 – 01 25.71 9.82 -15.89 31 – 01 25.66 14.08 -11.59 35 - 01 23.58 7.58 -16.00 27 – 02 20.4 3.18 -17.22 31 – 02 30.25 9.6 -20.64 35 - 02 28.09 9.13 -18.95 27 – 03 15.62 3.92 -11.70 31 – 03 42.09 14.57 -27.53 35 - 03 42.62 13.4 -29.22 27 – 04 17.27 4.45 -12.82 31 – 04 70.69 12.08 -58.60 35 - 04 67.32 10.08 -57.24 27 – 05 17 1.12 -15.89 31 – 05 54.29 14.69 -39.60 35 - 05 61.22 7.41 -53.81 27 – 06 16.39 0.12 -16.27 31 – 06 57.68 1.12 -56.56 35 - 06 51.03 1.12 -49.91
27 – 07 17.11 0.11 -17.01 31 – 07 34.49 0.11 -34.38 35 - 07 44.49 0.11 -44.38 27 – 08 21.2 2.11 -19.09 31 – 08 36.56 0.08 -36.48 35 - 08 51.94 0.08 -51.85 27 – 09 12.49 3.66 -8.83 31 – 09 12.77 0.08 -12.69 35 - 09 22.76 0.08 -22.68 27 – 10 29.12 14.3 -14.82 31 – 10 24.15 0.14 -24.01 35 - 10 32.15 0.14 -32.01 27 – 11 27.09 17.61 -9.48 31 – 11 19.49 0.16 -19.33 35 - 11 38.98 0.16 -38.82 28 – 00 22.57 4.79 -17.78 32 – 00 8.77 5.75 -3.02 36 - 00 6.83 2.39 -4.43 28 – 01 48.27 5.35 -42.92 32 – 01 14.95 6.77 -8.18 36 - 01 4.37 2.48 -1.89 28 – 02 31.54 2.15 -29.39 32 – 02 14.99 4.75 -10.24 36 - 02 4.98 1.61 -3.37 28 – 03 20.14 1.66 -18.48 32 – 03 13.79 3.83 -9.95 36 - 03 7.7 1.08 -6.62 28 – 04 18.86 1.38 -17.48 32 – 04 18.12 4.98 -13.14 36 - 04 7.93 1.64 -6.29 28 – 05 17.3 6.26 -11.03 32 – 05 18.12 8.06 -10.06 36 - 05 7.93 1.12 -6.82 28 – 06 30.52 10.61 -19.91 32 – 06 44.47 10.08 -34.39 36 - 06 7.6 0.12 -7.48 28 – 07 60.77 48.13 -12.64 32 – 07 76.39 9.42 -66.96 36 - 07 6.41 0.11 -6.31 28 – 08 93.88 2.44 -91.43 32 – 08 74.18 8.32 -65.86 36 - 08 5.97 0.08 -5.88 28 – 09 93.88 1.08 -92.80 32 – 09 23.6 4.46 -19.14 36 - 09 5.95 0.08 -5.87 28 – 10 46.77 0.14 -46.63 32 – 10 62.92 1.14 -61.78 36 - 10 5.73 0.14 -5.59 28 – 11 48.82 0.16 -48.66 32 – 11 77.82 29.16 -48.66 36 - 11 5.66 0.16 -5.50
Share Price Dispersion on NSE Continued
obs SP INTV SPD Obs SP INTV SPD Obs SP INTV SPD
39 - 05 5.05 3.46 -1.59 43 – 05 2.7 1.84 -0.85 47 - 05 1.92 1.21 -0.71 39 - 06 6.14 1.12 -5.02 43 – 06 2.79 1.94 -0.86 47 - 06 1.34 1.12 -0.22 39 - 07 12.23 0.11 -12.12 43 – 07 7.23 1.77 -5.46 47 - 07 3.27 0.11 -3.16 39 - 08 11.65 0.08 -11.57 43 – 08 19.7 1.63 -18.07 47 - 08 5.87 0.08 -5.78 39 - 09 4.82 0.08 -4.74 43 – 09 16.08 1.88 -14.20 47 - 09 1.42 0.08 -1.34 39 - 10 5.49 0.14 -5.35 43 – 10 10.39 1.14 -9.25 47 - 10 0.79 0.14 -0.65 39 - 11 3.76 0.16 -3.60 43 – 11 8.04 0.16 -7.88 47 - 11 3.09 0.16 -2.92 40 - 00 3.13 0.1 -3.04 44 – 00 2.94 1.44 -1.51 48 - 00 3.26 0.48 -2.78 40 - 01 3.38 0.5 -2.88 44 – 01 1.77 1.1 -0.67 48 - 01 3.01 1.1 -1.91 40 - 02 2.58 0.19 -2.39 44 – 02 1.45 0.06 -1.38 48 - 02 2.06 0.64 -1.42 40 - 03 1.39 0.38 -1.01 44 – 03 0.95 0.84 -0.11 48 - 03 2 0.84 -1.16 40 - 04 1.35 0.89 -0.46 44 – 04 1.01 0.91 -0.10 48 - 04 2.02 1.08 -0.94 40 - 05 1.02 0.24 -0.78 44 – 05 0.84 0.58 -0.26 48 - 05 1.86 0.12 -1.75 40 - 06 0.91 1.12 0.21 44 – 06 0.67 1.12 0.45 48 - 06 2.09 0.12 -1.96 40 - 07 1.8 0.11 -1.70 44 – 07 2.13 0.11 -2.03 48 - 07 3.72 0.11 -3.61 40 - 08 13.37 0.25 -13.12 44 – 08 5.24 0.08 -5.15 48 - 08 4.27 0.08 -4.18 40 - 09 13.1 1.08 -12.02 44 – 09 1.63 0.08 -1.55 48 - 09 1.07 0.08 -0.99 40 - 10 11.65 0.14 -11.51 44 – 10 0.63 0.14 -0.49 48 - 10 1.1 0.14 -0.96 40 - 11 9.56 0.16 -9.40 44 – 11 0.59 0.16 -0.43 48 - 11 0.77 0.16 -0.61
Share Price Dispersion ON NSE continued
obs SP INTV SPD Obs SP INTV SPD Obs SP INTV SPD
49 - 00 1.93 0.1 -1.83 53 – 00 1.42 0.48 -0.94 57 - 00 2.95 1.44 -1.52 49 - 01 2.6 1.39 -1.22 53 – 01 1.58 -0.01 -1.59 57 - 01 4.08 1.65 -2.43 49 - 02 1.77 0.96 -0.80 53 – 02 1.4 0.57 -0.83 57 - 02 3.66 1.28 -2.38 49 - 03 1 0.13 -0.86 53 – 03 1.3 1.01 -0.29 57 - 03 3.36 1.51 -1.84 49 - 04 0.89 0.61 -0.28 53 – 04 1.31 1.08 -0.23 57 - 04 3.43 1.08 -2.35 49 - 05 1.24 0.82 -0.42 53 – 05 1.26 0.12 -1.15 57 - 05 3.36 0.58 -2.78 49 - 06 1.8 1.12 -0.68 53 – 06 1.28 0.12 -1.16 57 - 06 2.77 1.12 -1.65 49 - 07 5.11 0.11 -5.00 53 – 07 3.66 0.11 -3.55 57 - 07 4.16 1.05 -3.11 49 - 08 7.39 0.08 -7.31 53 – 08 5.05 0.08 -4.96 57 - 08 4.58 1.08 -3.50 49 - 09 2.81 0.08 -2.73 53 – 09 1.16 0.08 -1.09 57 - 09 1.52 0.08 -1.44 49 - 10 0.76 0.14 -0.62 53 – 10 0.55 0.7 0.15 57 - 10 0.62 0.14 -0.48 49 - 11 0.51 0.16 -0.35 53 – 11 0.53 1.16 0.63 57 - 11 0.51 0.16 -0.35 50 - 00 0.66 0.1 -0.56 54 – 00 0.56 0.1 -0.46 58 - 00 1.36 0.96 -0.40 50 - 01 0.59 0.1 -0.49 54 – 01 0.54 0.1 -0.44 58 - 01 1.35 0.99 -0.37 50 - 02 0.6 0.06 -0.53 54 – 02 0.51 0.06 -0.44 58 - 02 1.15 0.96 -0.19 50 - 03 0.6 0.08 -0.52 54 – 03 0.52 0.08 -0.43 58 - 03 1.97 1.26 -0.71 50 - 04 0.59 0.08 -0.51 54 – 04 1.08 0.08 -1.00 58 - 04 2.02 2.52 0.50 50 - 05 0.65 0.12 -0.54 54 – 05 0.64 0.12 -0.53 58 - 05 1.34 2.05 0.71 50 - 06 0.66 1.04 0.38 54 – 06 0.83 0.12 -0.71 58 - 06 1.22 1.21 -0.01 50 - 07 1.82 1.11 -0.71 54 – 07 3.23 0.11 -3.12 58 - 07 4.51 1.11 -3.41 50 - 08 2.82 0.08 -2.73 54 – 08 3.24 0.42 -2.82 58 - 08 11.87 0.08 -11.78 50 - 09 0.59 0.08 -0.51 54 – 09 0.69 0.52 -0.17 58 - 09 4.8 0.08 -4.72 50 - 10 0.5 0.14 -0.36 54 – 10 0.55 0.58 0.04 58 - 10 2.67 0.14 -2.53 50 - 11 0.5 0.16 -0.34 54 – 11 0.53 0.48 -0.06 58 - 11 1.14 0.16 -0.98 51 - 00 0.79 0.96 0.17 55 – 00 3.94 0.45 -3.49 59 - 00 1.61 0.24 -1.37 51 - 01 1.82 0.99 -0.83 55 – 01 4.67 0.62 -4.05 59 - 01 1.03 0.1 -0.93 51 - 02 1.81 0.46 -1.34 55 – 02 3.48 -0.05 -3.52 59 - 02 0.72 -0.61 -1.33 51 - 03 1.41 1.18 -0.23 55 – 03 3.89 -0.09 -3.99 59 - 03 0.64 0.42 -0.21 51 - 04 2.59 0.7 -1.89 55 – 04 3.95 0.6 -3.34 59 - 04 1.11 0.51 -0.60 51 - 05 2.79 2.24 -0.55 55 – 05 3.09 0.99 -2.09 59 - 05 0.97 0.91 -0.06 51 - 06 3.18 1.12 -2.06 55 – 06 2.84 -0.85 -3.69 59 - 06 1.07 1.1 0.03 51 - 07 7.22 0.11 -7.11 55 – 07 4.41 0.41 -3.99 59 - 07 4.19 1.05 -3.14 51 - 08 8.5 0.08 -8.41 55 – 08 6.41 0.77 -5.64 59 - 08 10.22 0.81 -9.41 51 - 09 1.96 0.08 -1.89 55 – 09 1.59 1.08 -0.51 59 - 09 8.46 0.95 -7.51 51 - 10 0.72 0.14 -0.58 55 – 10 0.9 0.14 -0.76 59 - 10 7.41 1.14 -6.27 51 - 11 0.55 0.16 -0.39 55 – 11 0.65 0.16 -0.49 59 - 11 6.45 0.16 -6.29 52 - 00 0.88 1.2 0.32 56 – 00 3.12 1.68 -1.45 60 - 00 5.61 3.35 -2.26 52 - 01 1.57 1.24 -0.33 56 – 01 2.87 1.73 -1.14 60 - 01 5.41 4.53 -0.88 52 - 02 1.27 0.92 -0.35 56 – 02 2.29 1.12 -1.17 60 - 02 5.02 3.21 -1.81 52 - 03 0.99 0.01 -0.99 56 – 03 2.73 1.46 -1.27 60 - 03 5.69 4.21 -1.48 52 - 04 0.83 1.08 0.25 56 – 04 2.09 1.26 -0.82 60 - 04 6.56 1.08 -5.47 52 - 05 0.92 0.12 -0.80 56 – 05 2.6 1.34 -1.27 60 - 05 5.45 0.12 -5.33 52 - 06 0.82 0.12 -0.70 56 – 06 2.78 1.61 -1.17 60 - 06 5.78 0.12 -5.66 52 - 07 2.63 0.11 -2.52 56 – 07 6.02 1.87 -4.15 60 - 07 15.6 1.11 -14.49 52 - 08 3.29 0.08 -3.20 56 – 08 9.79 1.69 -8.10 60 - 08 22.56 0.08 -22.48 52 - 09 0.87 0.08 -0.79 56 – 09 4.5 1.08 -3.42 60 - 09 21.03 0.08 -20.96 52 - 10 0.51 0.14 -0.37 56 – 10 3.15 0.14 -3.01 60 - 10 15.02 0.14 -14.88 52 - 11 0.5 0.16 -0.34 56 – 11 1.76 0.16 -1.60 60 - 11 13.52 0.16 -13.36
Share Price Dispersion on NSE Continued
5 SP INTV SPD Obs SP INTV SPD obs SP INTV SPD
APPENDIX II
List of Firms in the Study
S/N FIRM/OBS CLASSIFICATION NSE SECTORAL S/N FIRM/OBS CLASSIFICATION NSE SECTORAL
1 Okomu Agriculture 39 May & Baker Nig Plc Healthcare
2 R. T. Briscoe (Nig) Plc Automobile&Tyre 40 Morison Industries Plc Healthcare
3 Access Bank Plc Banking 41 Neimeth Pharm Healthcare
4 Afribank Plc Banking 42 Pharma-Deko Plc Healthcare
5 First Bank Of Nigeria P Banking 43 B O C Gases Nig Plc Industrial Product
6 Gtbank Plc Banking 44 first aluminium Industrial Product
7 United Bank For Africa Plc Banking 45 Nigerian Enamel Ware Industrial Product 8 Union Bank Of Nigeria Plc Banking 46 Vitafoam Nig Plc Industrial Product
9 Wema Bank Plc Banking 47 Vono Products Plc Industrial Product
10 Guinness Nig Plc Breweries 48 AIICO Insurance Plc Insurance
11 Nigerian Breweries Plc Breweries 49 Crusader Nigeria Plc Insurance
12 Ashaka Cement Plc Building Material 50 Guinea Insurance Plc Insurance 13 Cem Co Of Northern Nig Building Material 51 Inter WAPIC Ins Plc Insurance 14 Lafarge Wapco Plc Building Material 52 Lasaco Assurance Plc Insurance 15 Berger Paints Nig Chemical & Paint 53 Law Union n Rock Ins Insurance 16 Chemical And Allied Products Chemical & Paint 54 N E M Ins Co Nig Plc Insurance 17 D.N. Meyer Nigeria Chemical & Paint 55 Niger Ins Co Plc Insurance 18 Nig- German Chemicals Chemical & Paint 56 Prestige Assurance Plc Insurance
19 Premier Paints Chemical & Paint 57 Royal Exchange Plc Insurance
20 Trans nation express Commercial/Services 58 C & I Leasing Leasing
21 A.G.Leventis Nigeria Conglomerates 59 Avon Crowncaps Packaging
22 Chellarams Plc Conglomerates 60 Delta Glass Co. Plc Packaging
23 John holt Conglomerates 61 Nampak Nigeria Plc Packaging
24 PZ Cussons Nig Plc Conglomerates 62 MRS Oil Nigeria Plc Petroleum Marketing
25 SCOA Nig Plc Conglomerates 63 Conoil Plc Petroleum Marketing
26 UAC Of Nig Plc Conglomerates 64 Mobil Oil Nigeria Plc Petroleum Marketing
27 Unilever Nig Plc Conglomerates 65 Oando Plc Petroleum Marketing
28 Julius Berger Nig Plc Construction 66 Total Petroleum Marketing
29 Cutix Engineering Tech 67 Academy Press Publishing&Printing
30 7-Up Bottling Co. Plc Food&Beverages 68 Longman Nigeria Publishing&Printing 31 Cadbury Nig Plc Food&Beverages 69 University Press Publishing&Printing 32 Flour Mills Nig Plc Food&Beverages 70 UACN Property Devt Real Estate 33 Northern Nig Flour Mills Food&Beverages 71 United Nigeria Textiles Textile 34 Nestle Nigeria Plc Food&Beverages 72 Smart products nig. Plc Second-tier market 35 Nig Bottling Company Food&Beverages
36 PS Mandrides Food&Beverages
37 Evans Medical Plc Healthcare
38 Glaxosmith Healthcare
List of Undervalued Shares on NSE
S/N FIRM YEAR SPD S/N FIRM YEAR SPD S/N FIRM YEAR SPD
1 okomu 2000 1.29 27 A.G.Leventis 2005 0.11 53 Lasaco 2000 0.32
2 okomu 2011 9.26 28 A.G.Leventis 2011 0.01 54 Lasaco 2004 0.25
3 R. T. Briscoe 2001 0.36 29 Chellarams 2000 0.79 55 Law Union 2010 0.15 4 Gtbank Plc 2000 0.28 30 Chellarams 2005 0.31 56 Law Union 2011 0.63 5 Gtbank Plc 2007 *43.61 31 John holt 2003 1.13 57 N E M Ins 2010 0.04
6 UBA 2000 0.38 32 John holt 2004 0.84 58 C & I 2004 0.50
7 UBN 2000 *89.63 33 John holt 2005 1.22 59 C & I 2005 0.71
8 UBN 2001 *126.21 34 John holt 2006 1.27 60 AvonCrow 2006 0.03